WPeMatico 2.8.12
Does WPeMatico work with WordPress 6.8.3 and PHP 8.1.12? A smoke test was performed on .
Summary
Errors
| 1 | PHP notices |
| 1 | JavaScript exceptions |
| All test pages loaded successfully | |
| No resource errors |
Performance
Memory usage: 257.26 KiB
The average PHP memory usage increased by this amount after activating by the plugin.
Page speed impact:
insignificant.
The plugin didn't make the site noticeably slower.
Environment
| WordPress version | 6.8.3 |
|---|---|
| PHP version | 8.1.12 |
| MySQL version | 10.6.10 |
| PHP memory limit | 512M |
Plugin Info
| Last updated | |
|---|---|
| Active installs | 10,000+ |
| WordPress.org page | https://wordpress.org/plugins/wpematico/ |
| Badges |
|
Pages 14
Plugins ‹ Test site — WordPress
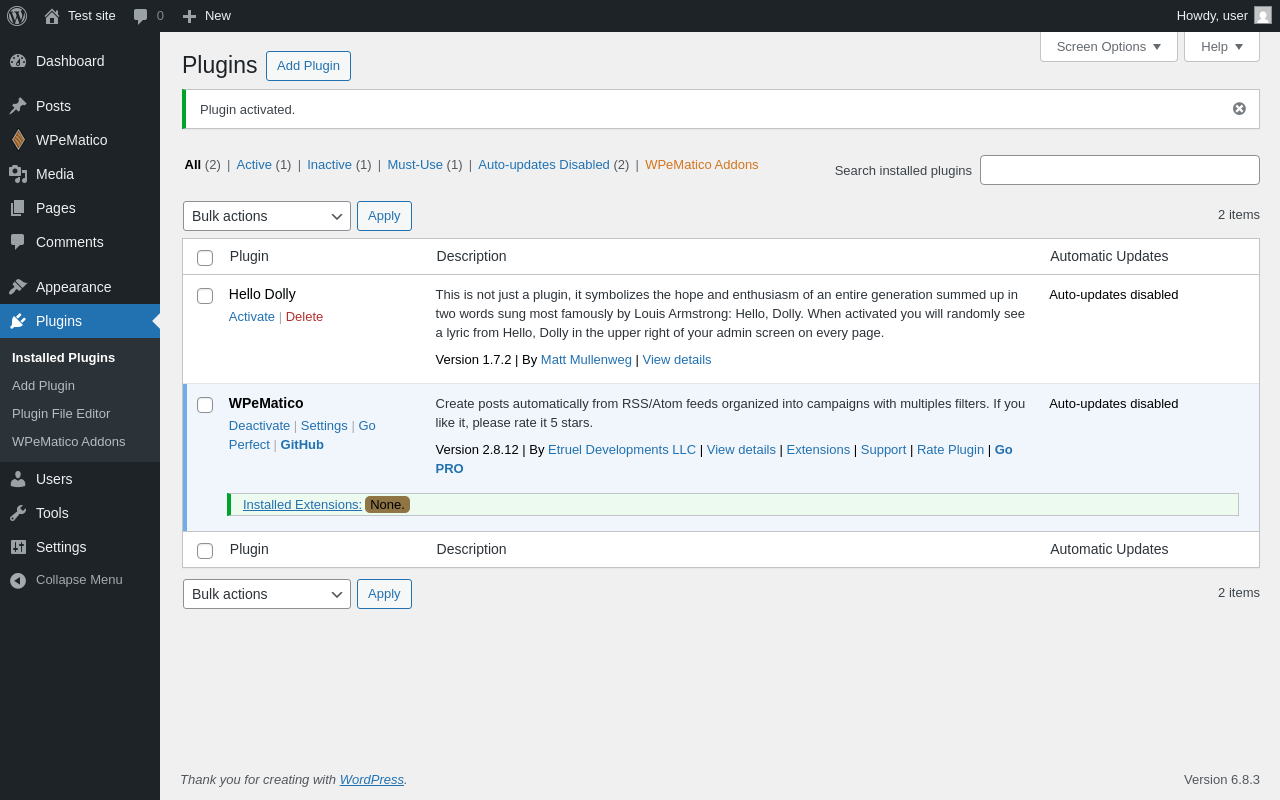
| URL | /wp-admin/plugins.php?plugin_status=all&paged=1&s |
|---|---|
| Requested URL | /wp-admin/plugins.php?action=activate&plugin=wpematico%2Fwpematico.php&plugin_status=all&paged=1&s&_wpnonce=045c55b1ff |
| Aspect | after-activation |
| HTTP status | 200 |
| Load time | 4.493 s |
| Memory usage | 8.41 MiB |
| JS errors | None |
| Resource errors | None |
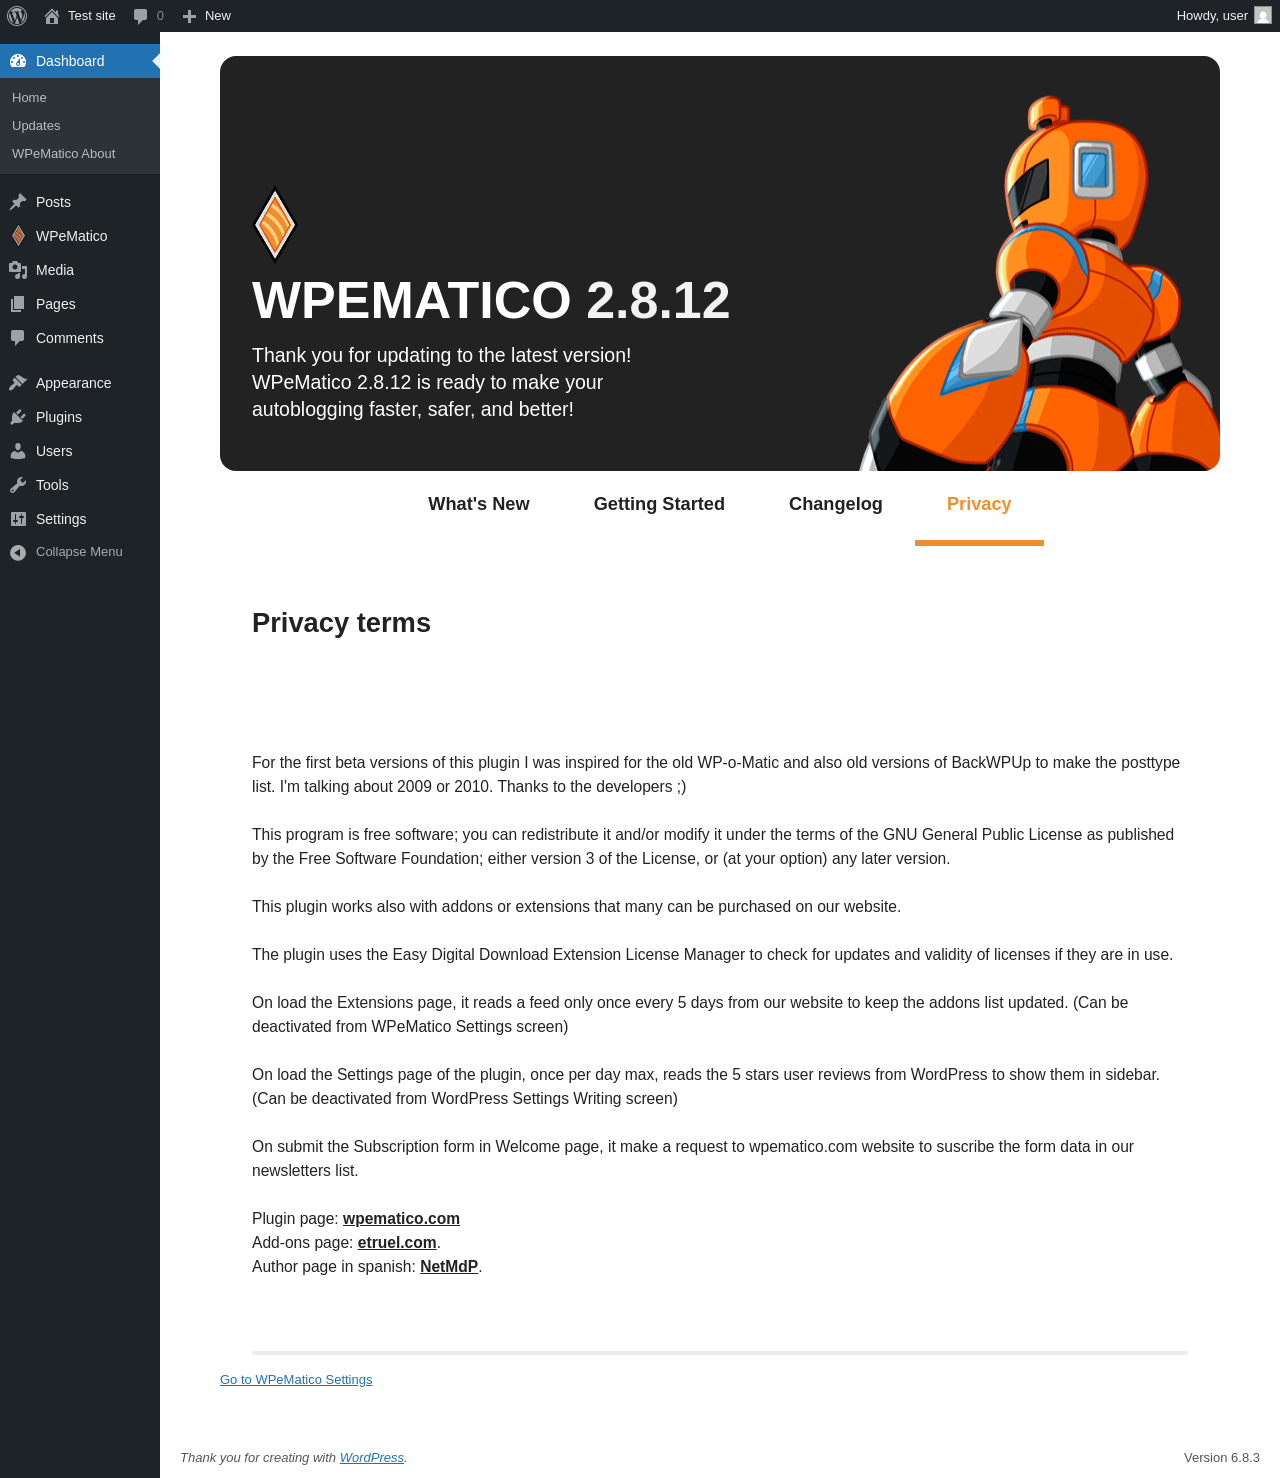
Dashboard → WPeMatico About
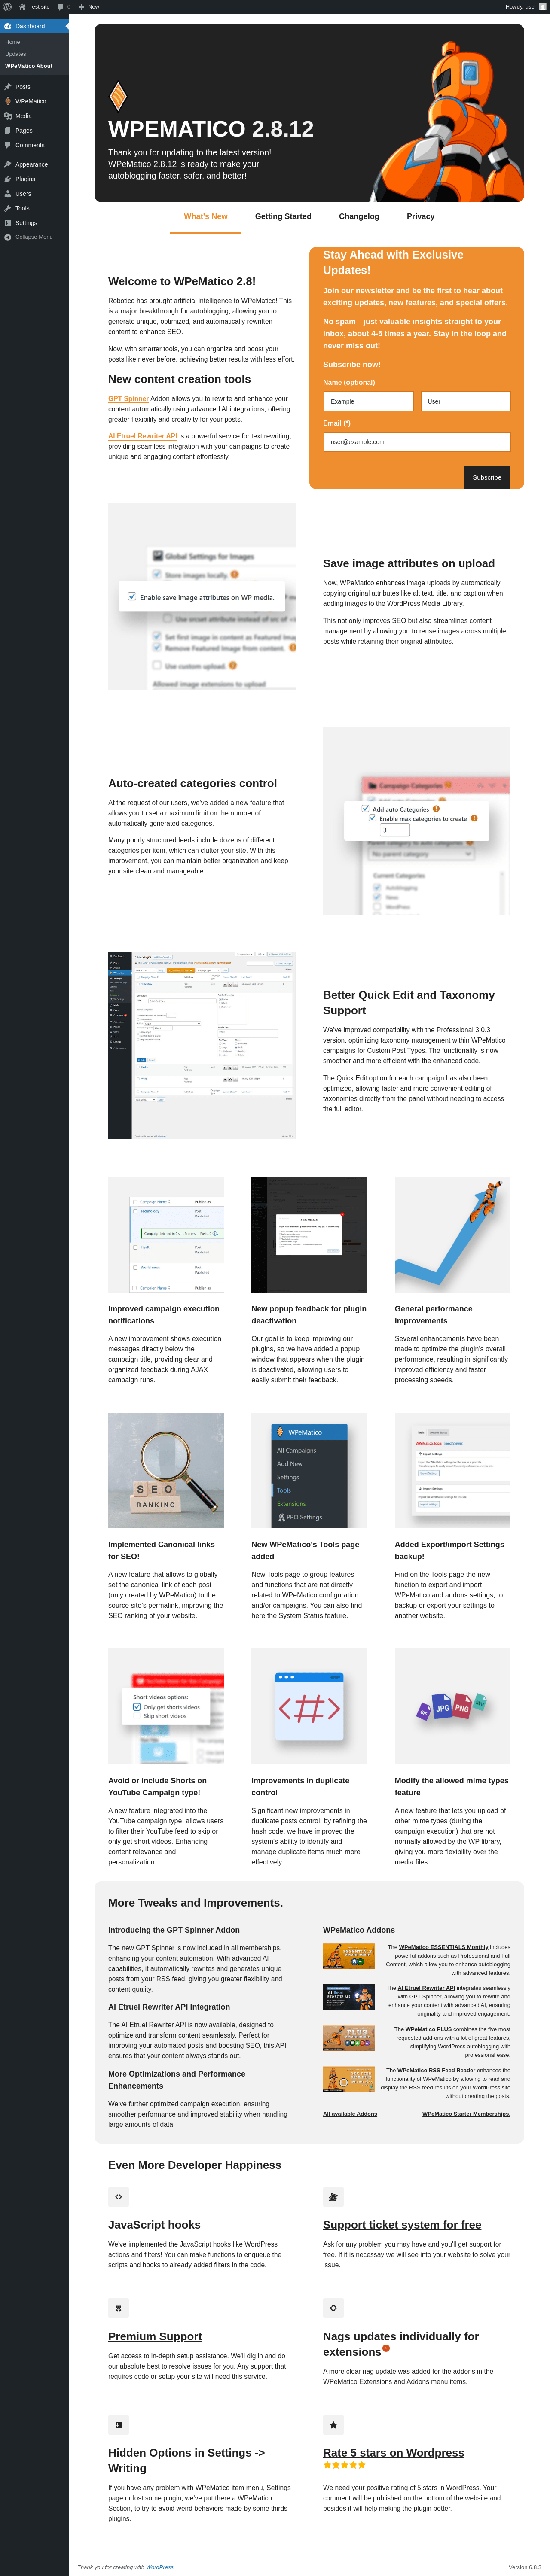
| URL | /wp-admin/index.php?page=wpematico-about |
|---|---|
| Aspect | menu-item |
| HTTP status | 200 |
| Load time | 0.360 s |
| Memory usage | 3.75 MiB |
| JS errors | None |
| Resource errors | None |
Dashboard → WPeMatico About → Getting Started
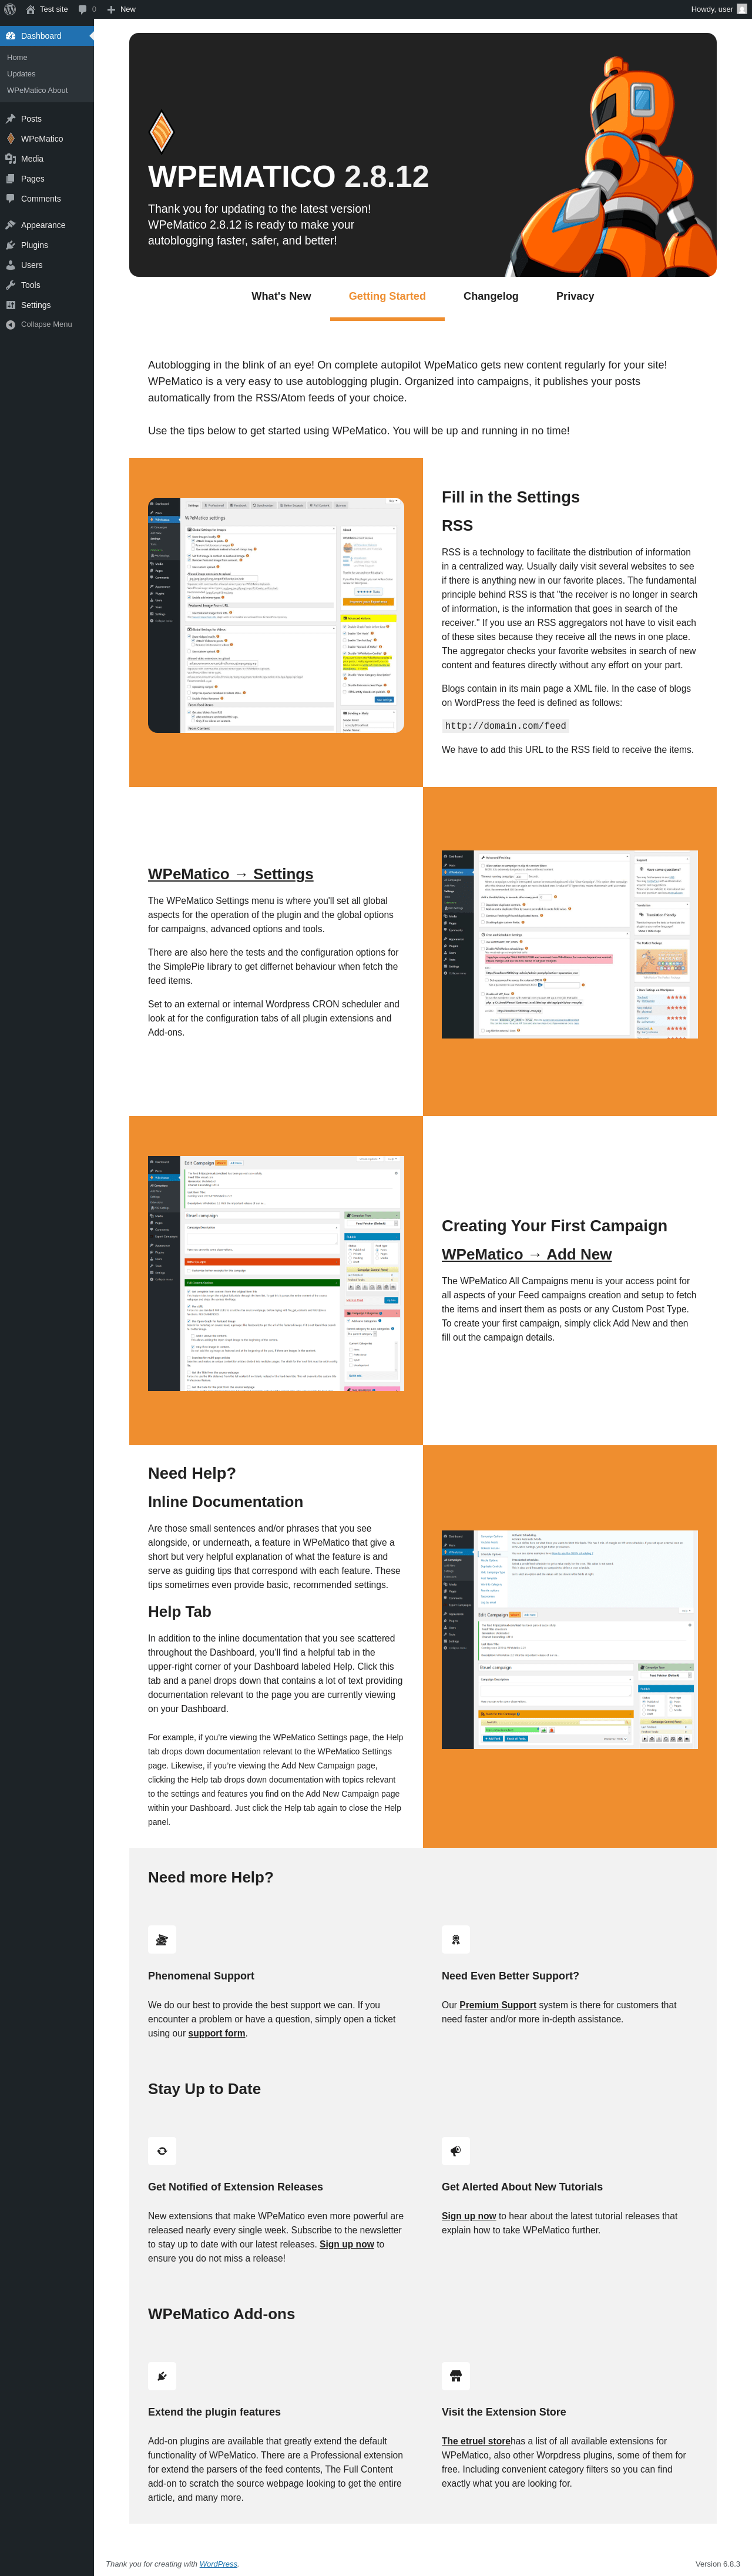
| URL | /wp-admin/index.php?page=wpematico-getting-started |
|---|---|
| Aspect | menu-item-tab |
| HTTP status | 200 |
| Load time | 0.234 s |
| Memory usage | 3.75 MiB |
| JS errors | None |
| Resource errors | None |
Dashboard → WPeMatico About → Changelog
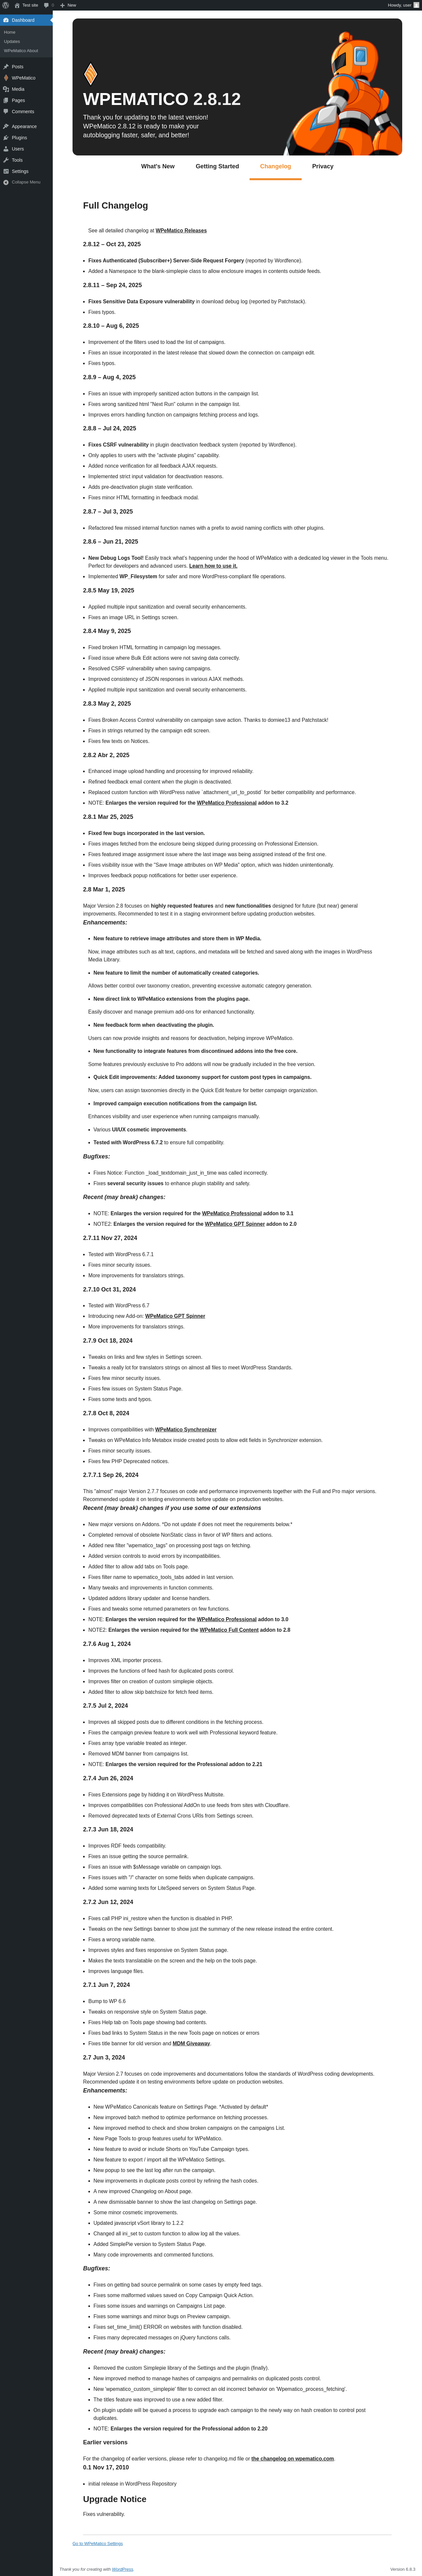
| URL | /wp-admin/index.php?page=wpematico-changelog |
|---|---|
| Aspect | menu-item-tab |
| HTTP status | 200 |
| Load time | 0.252 s |
| Memory usage | 3.75 MiB |
| JS errors | None |
| Resource errors | None |
Dashboard → WPeMatico About → Privacy
| URL | /wp-admin/index.php?page=wpematico-privacy |
|---|---|
| Aspect | menu-item-tab |
| HTTP status | 200 |
| Load time | 0.168 s |
| Memory usage | 3.75 MiB |
| JS errors | None |
| Resource errors | None |
WPeMatico
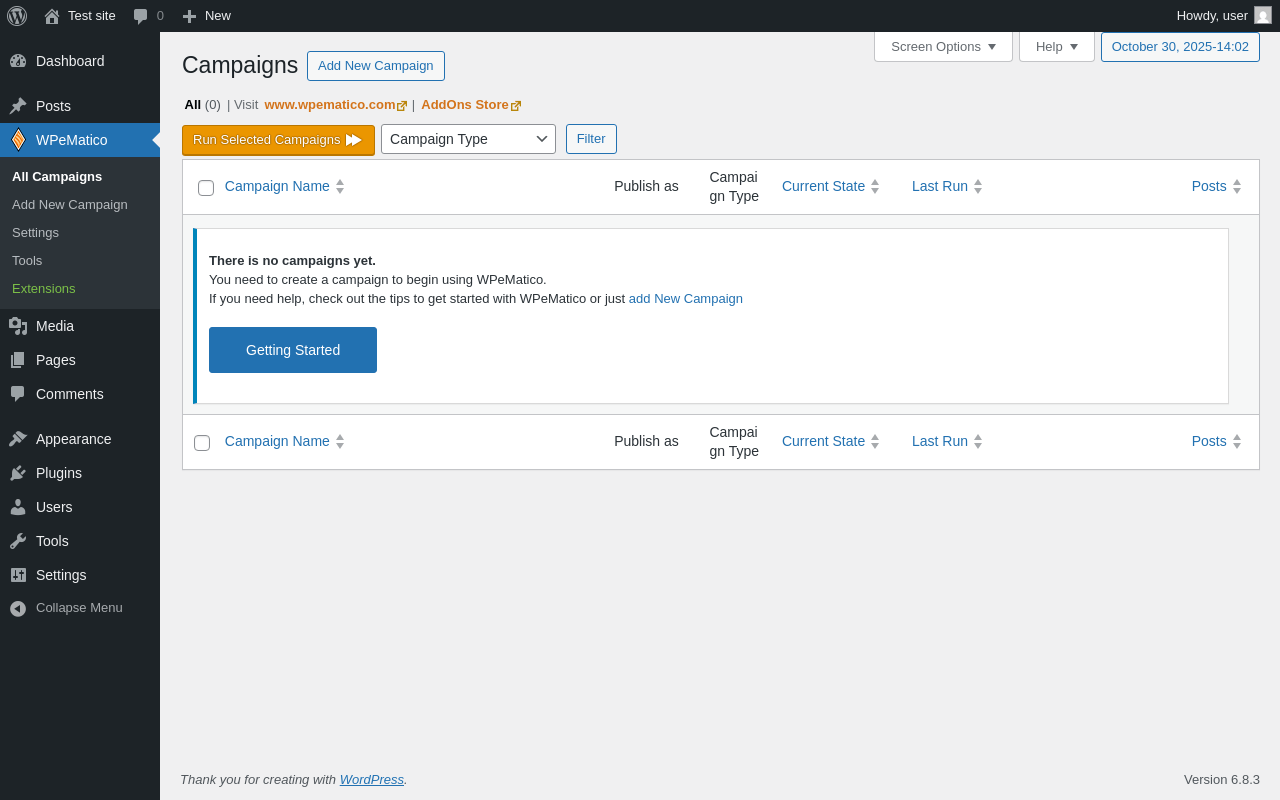
| URL | /wp-admin/edit.php?post_type=wpematico |
|---|---|
| Aspect | menu-item |
| HTTP status | 200 |
| Load time | 0.535 s |
| Memory usage | 3.84 MiB |
| JS errors | None |
| Resource errors | None |
WPeMatico → Add New Campaign
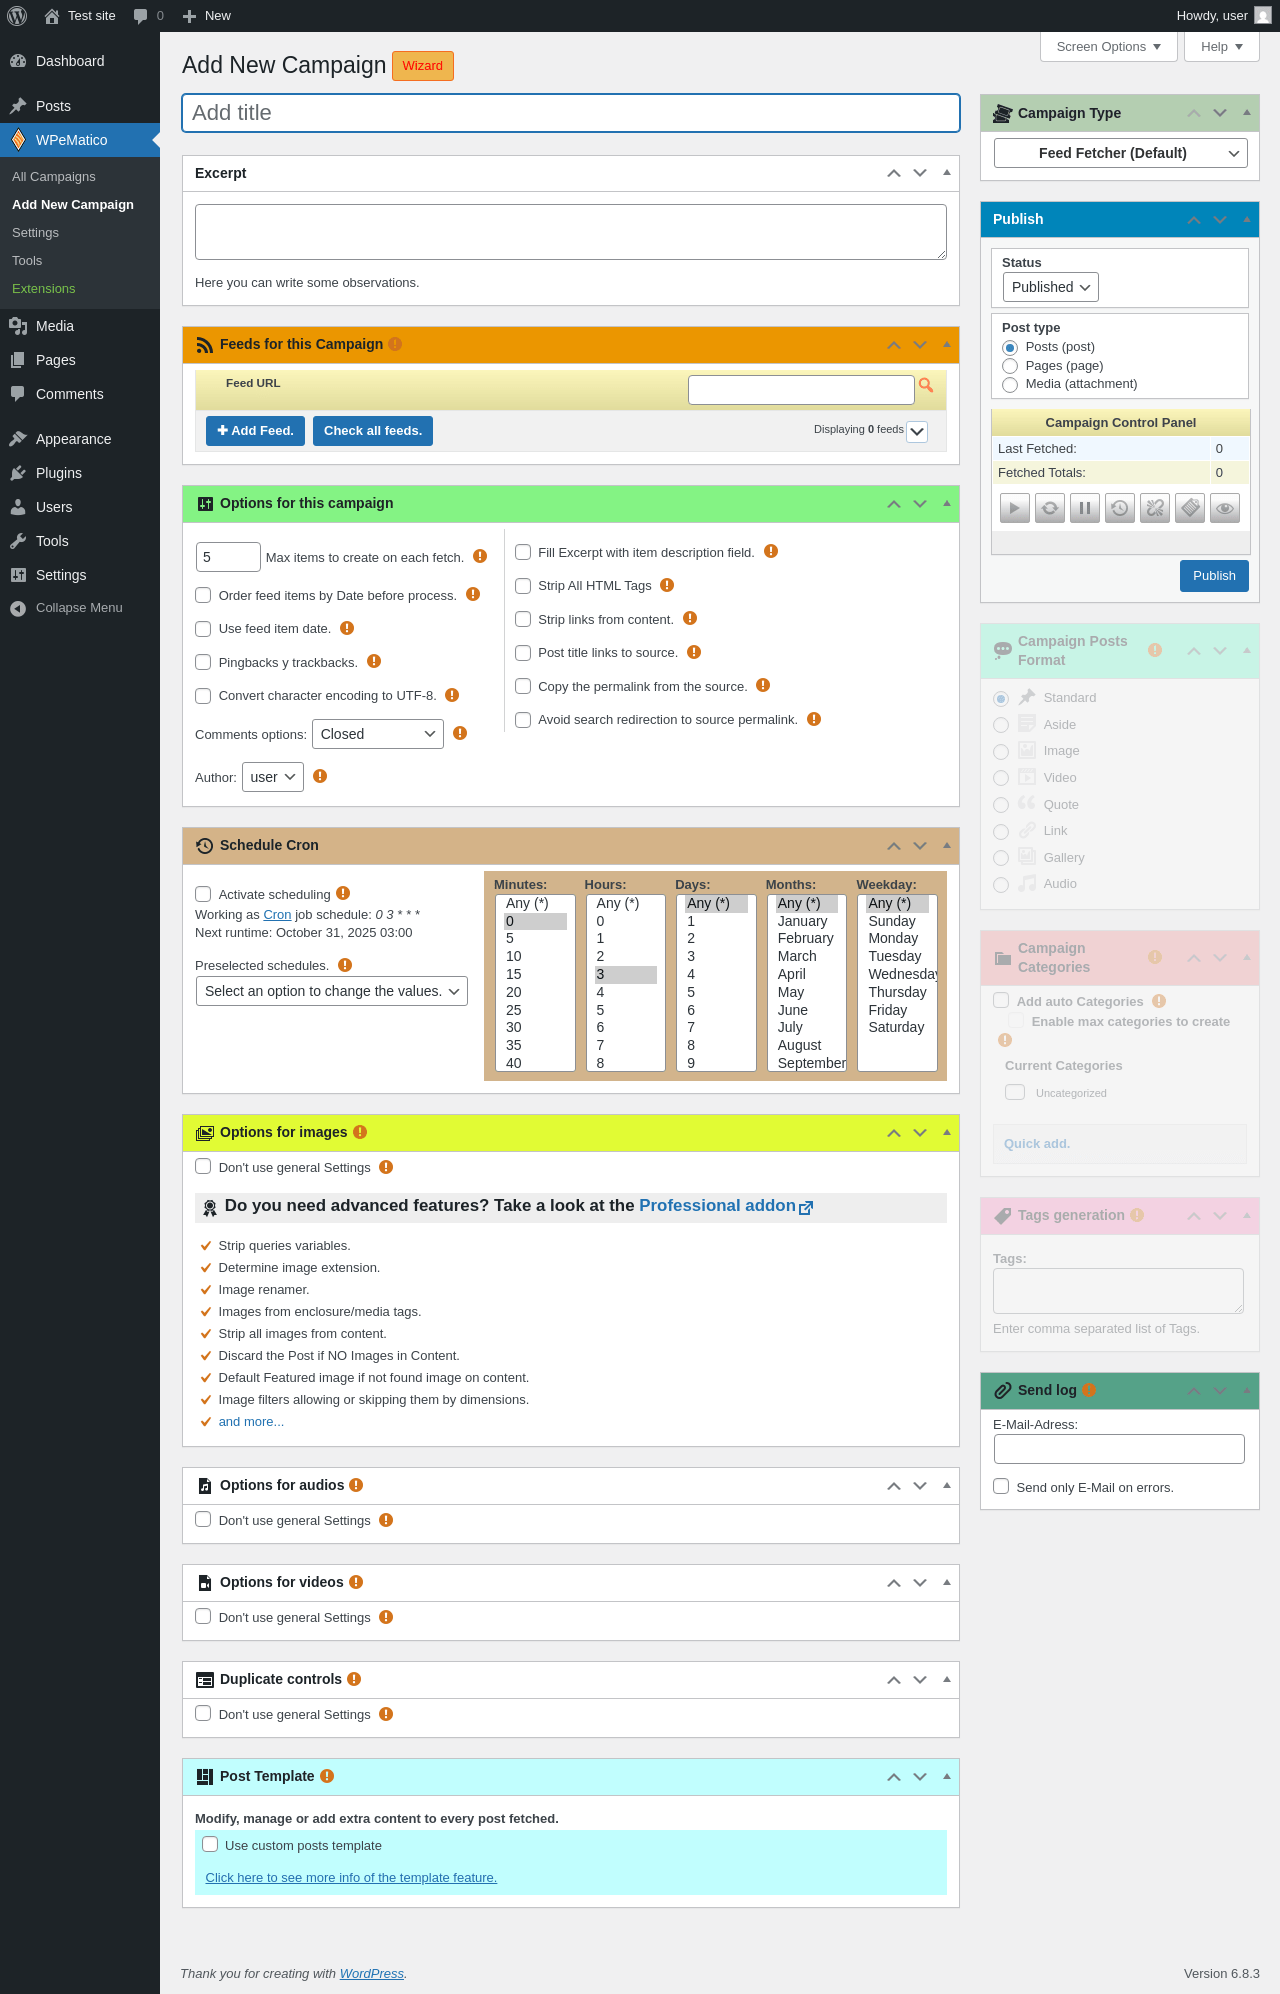
| URL | /wp-admin/post-new.php?post_type=wpematico |
|---|---|
| Aspect | menu-item |
| HTTP status | 200 |
| Load time | 0.418 s |
| Memory usage | 3.9 MiB |
| JS errors | None |
| Resource errors | None |
WPeMatico → Settings
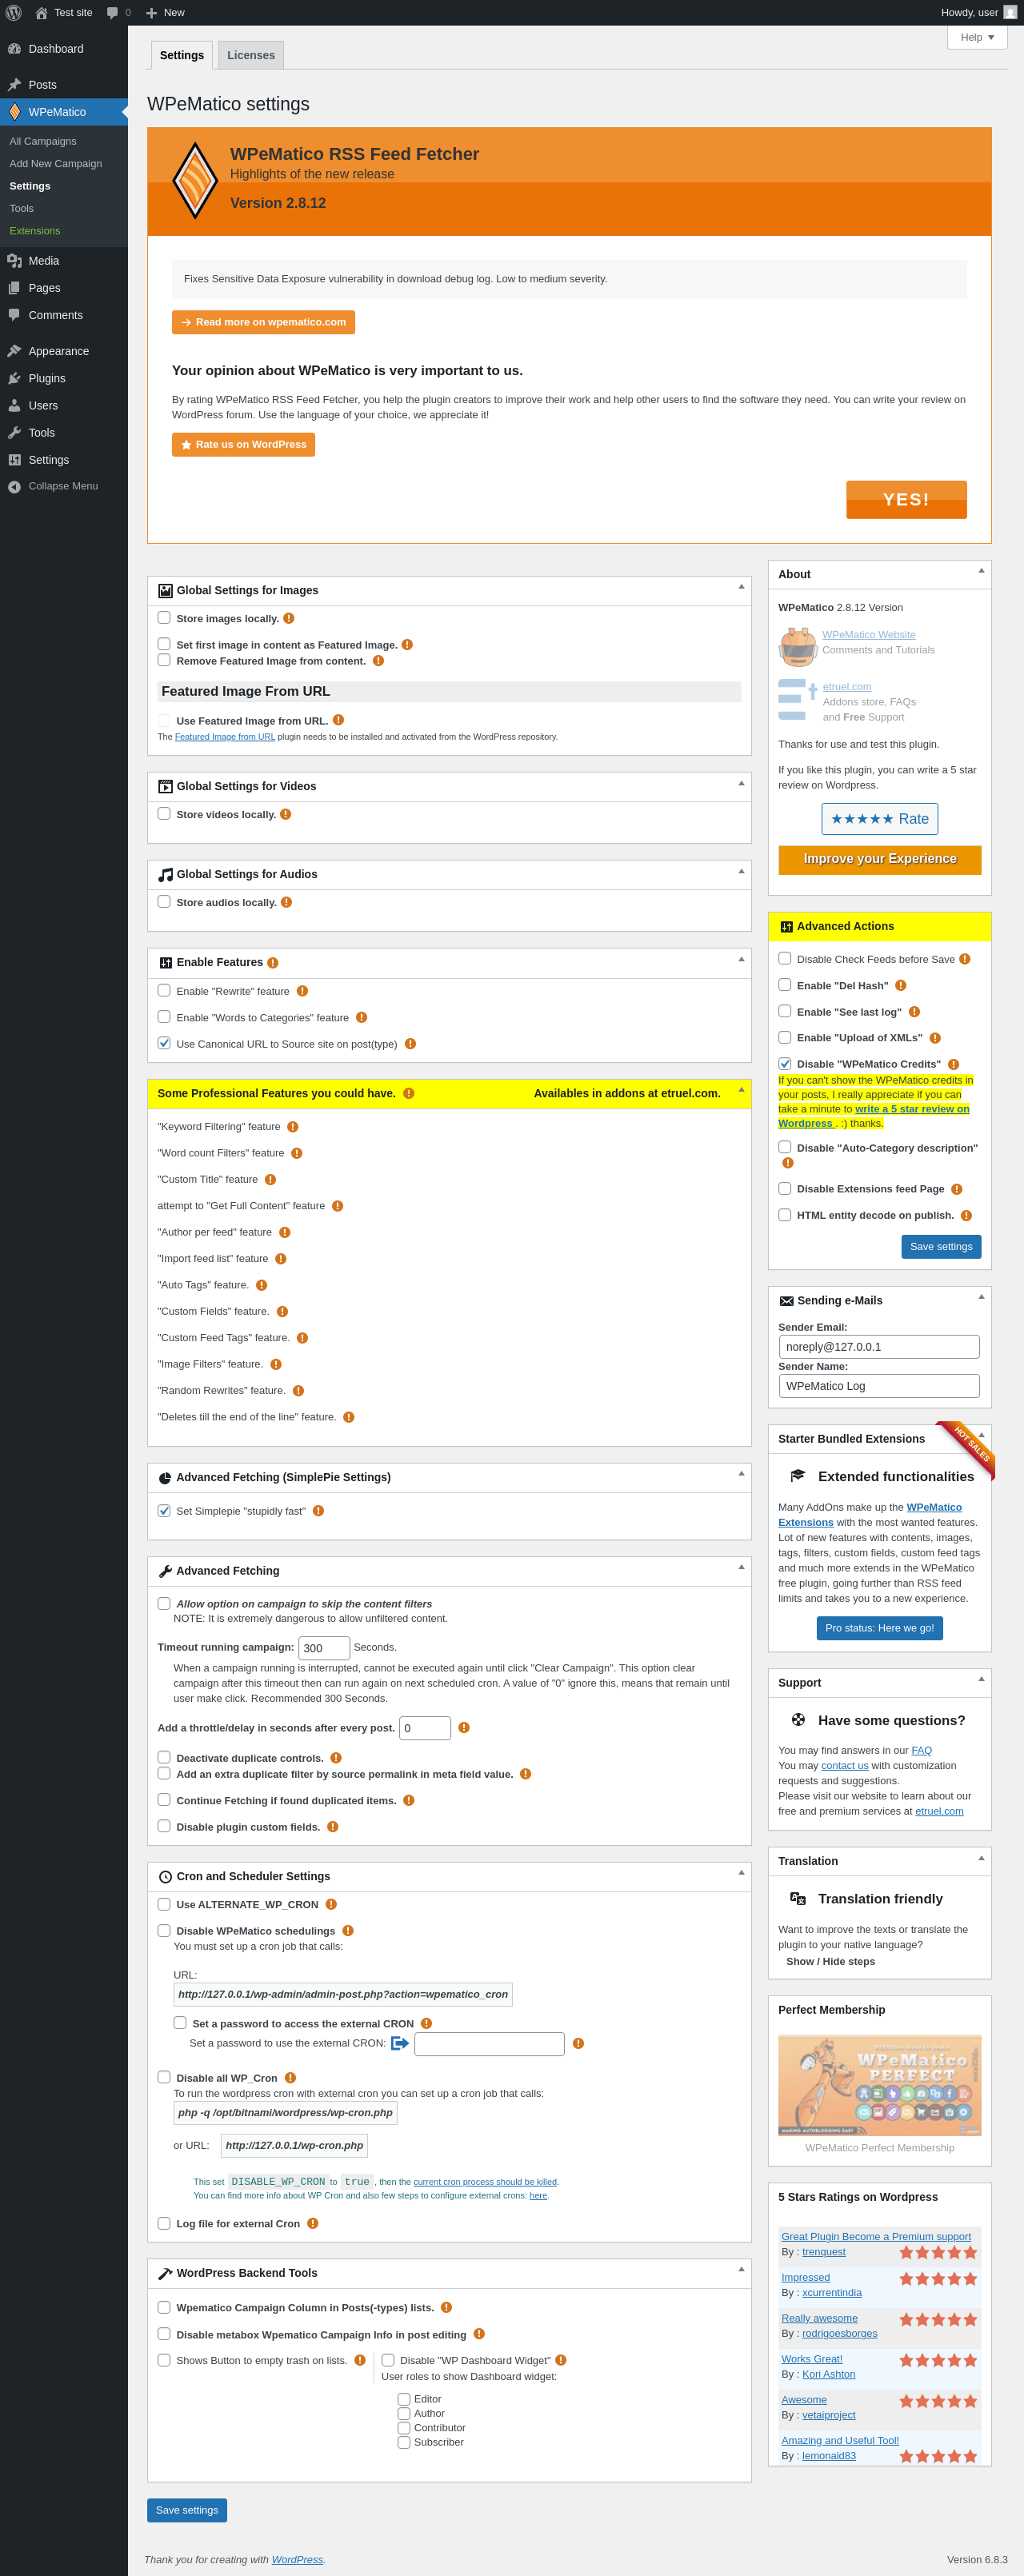
| URL | /wp-admin/edit.php?post_type=wpematico&page=wpematico_settings |
|---|---|
| Aspect | menu-item |
| HTTP status | 200 |
| Load time | 2.498 s |
| Memory usage | 4.93 MiB |
| JS errors | None |
| Resource errors | None |
WPeMatico → Settings → Licenses
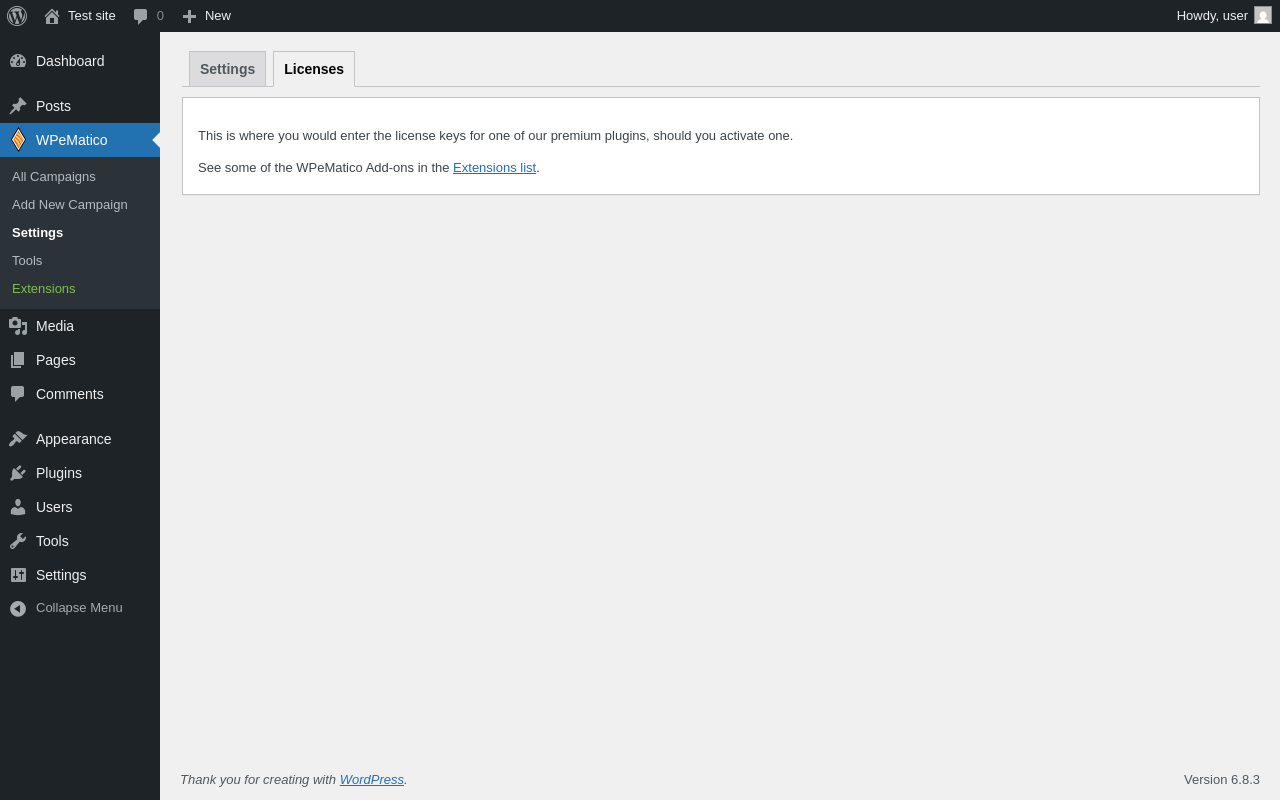
| URL | /wp-admin/edit.php?post_type=wpematico&page=wpematico_settings&tab=pro_licenses |
|---|---|
| Aspect | menu-item-tab |
| HTTP status | 200 |
| Load time | 0.214 s |
| Memory usage | 3.78 MiB |
| JS errors | None |
| Resource errors | None |
WPeMatico → Tools
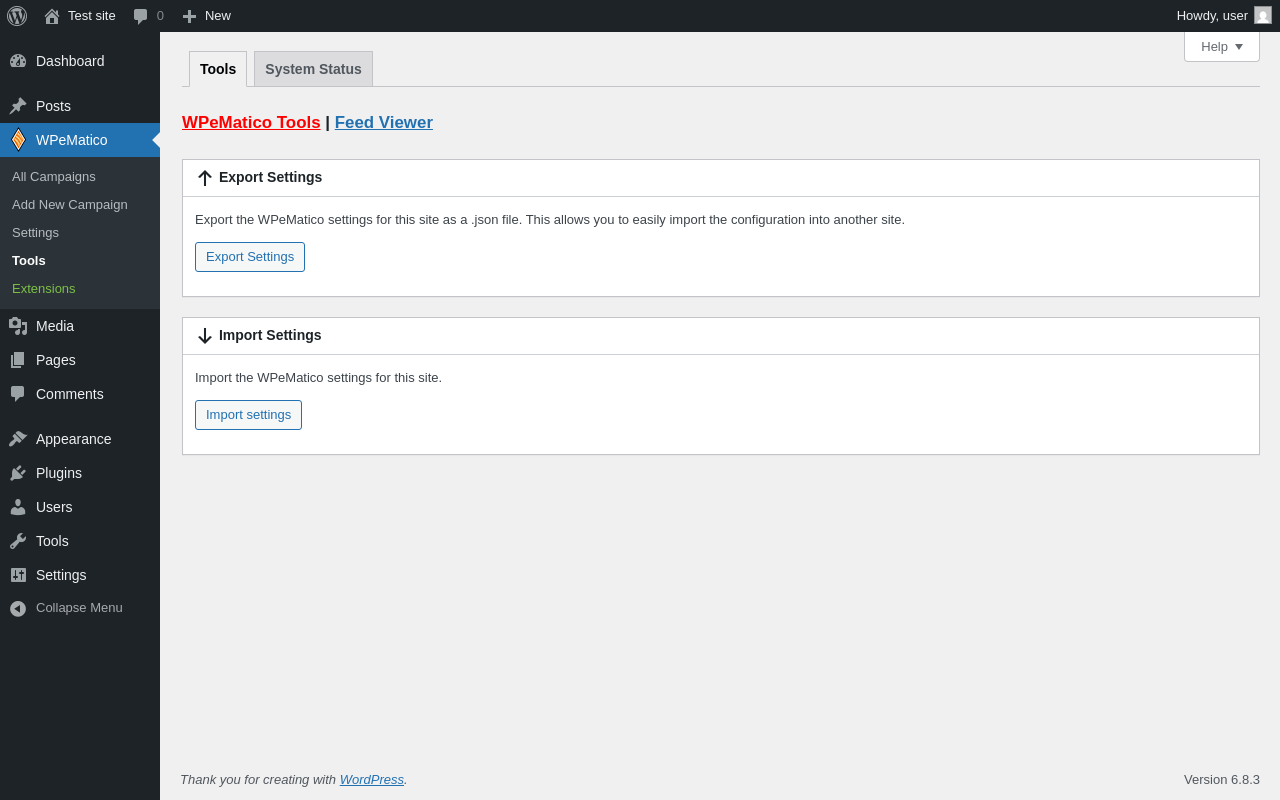
| URL | /wp-admin/edit.php?post_type=wpematico&page=wpematico_tools |
|---|---|
| Aspect | menu-item |
| HTTP status | 200 |
| Load time | 0.177 s |
| Memory usage | 3.78 MiB |
| JS errors | None |
| Resource errors | None |
WPeMatico → Tools → System Status
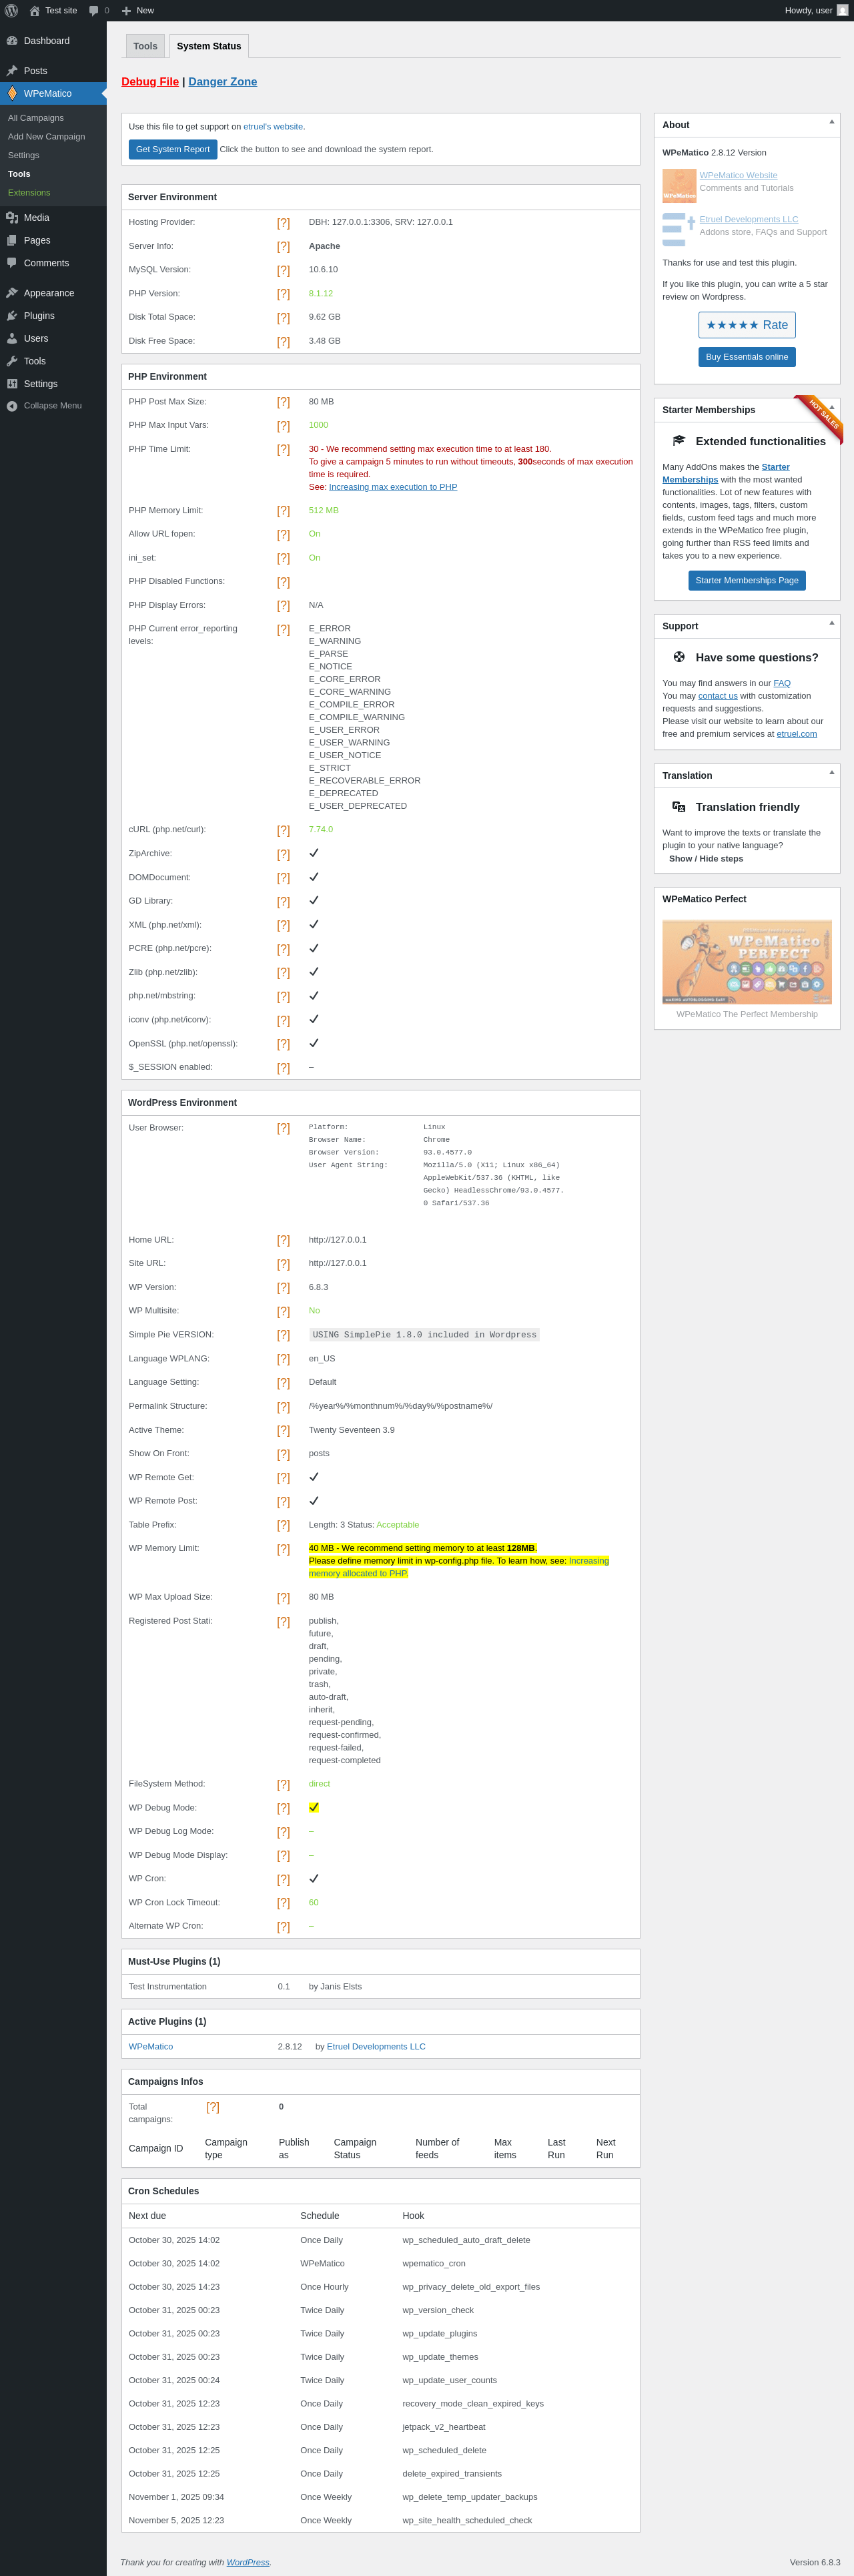
| URL | /wp-admin/edit.php?post_type=wpematico&page=wpematico_tools&tab=debug_info |
|---|---|
| Aspect | menu-item-tab |
| HTTP status | 200 |
| Load time | 9.799 s |
| Memory usage | 10.87 MiB |
| JS errors | None |
| Resource errors | None |
WPeMatico → Extensions
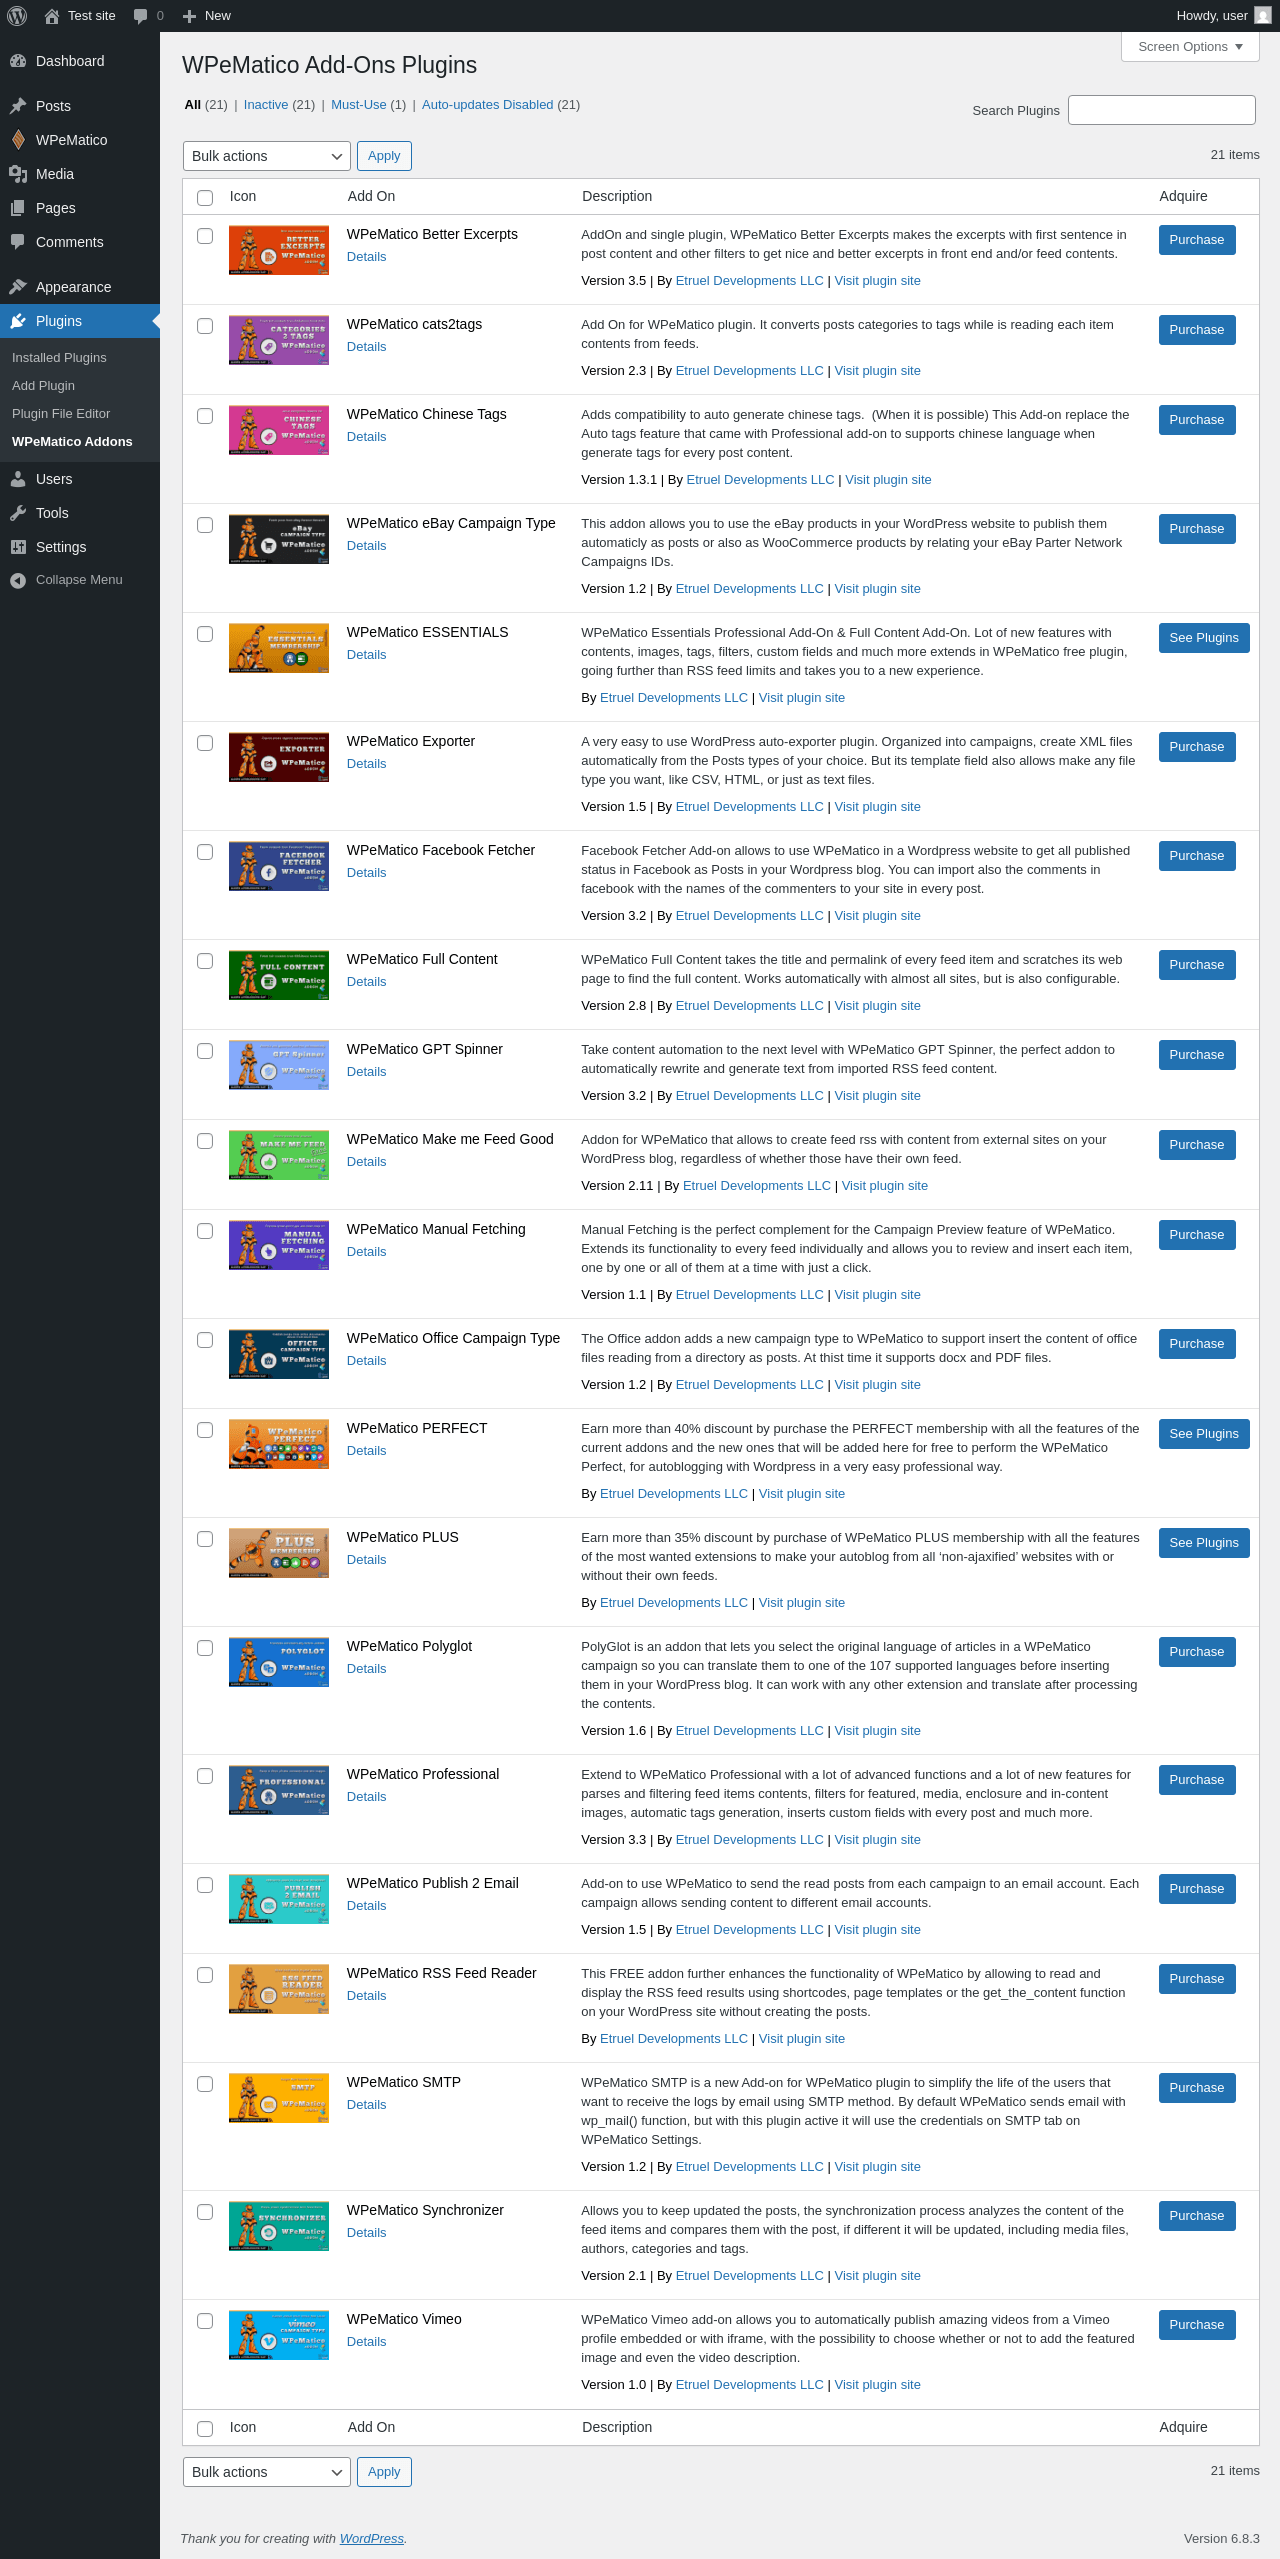
| URL | /wp-admin/plugins.php?page=wpemaddons |
|---|---|
| Aspect | menu-item |
| HTTP status | 200 |
| Load time | 0.629 s |
| Memory usage | 3.88 MiB |
| JS errors | |
| Resource errors | None |
Test site – Just another WordPress site
| URL | / |
|---|---|
| Aspect | front-page |
| HTTP status | 200 |
| Load time | 0.225 s |
| Memory usage | 3.5 MiB |
| JS errors | None |
| Resource errors | None |
Dashboard ‹ Test site — WordPress
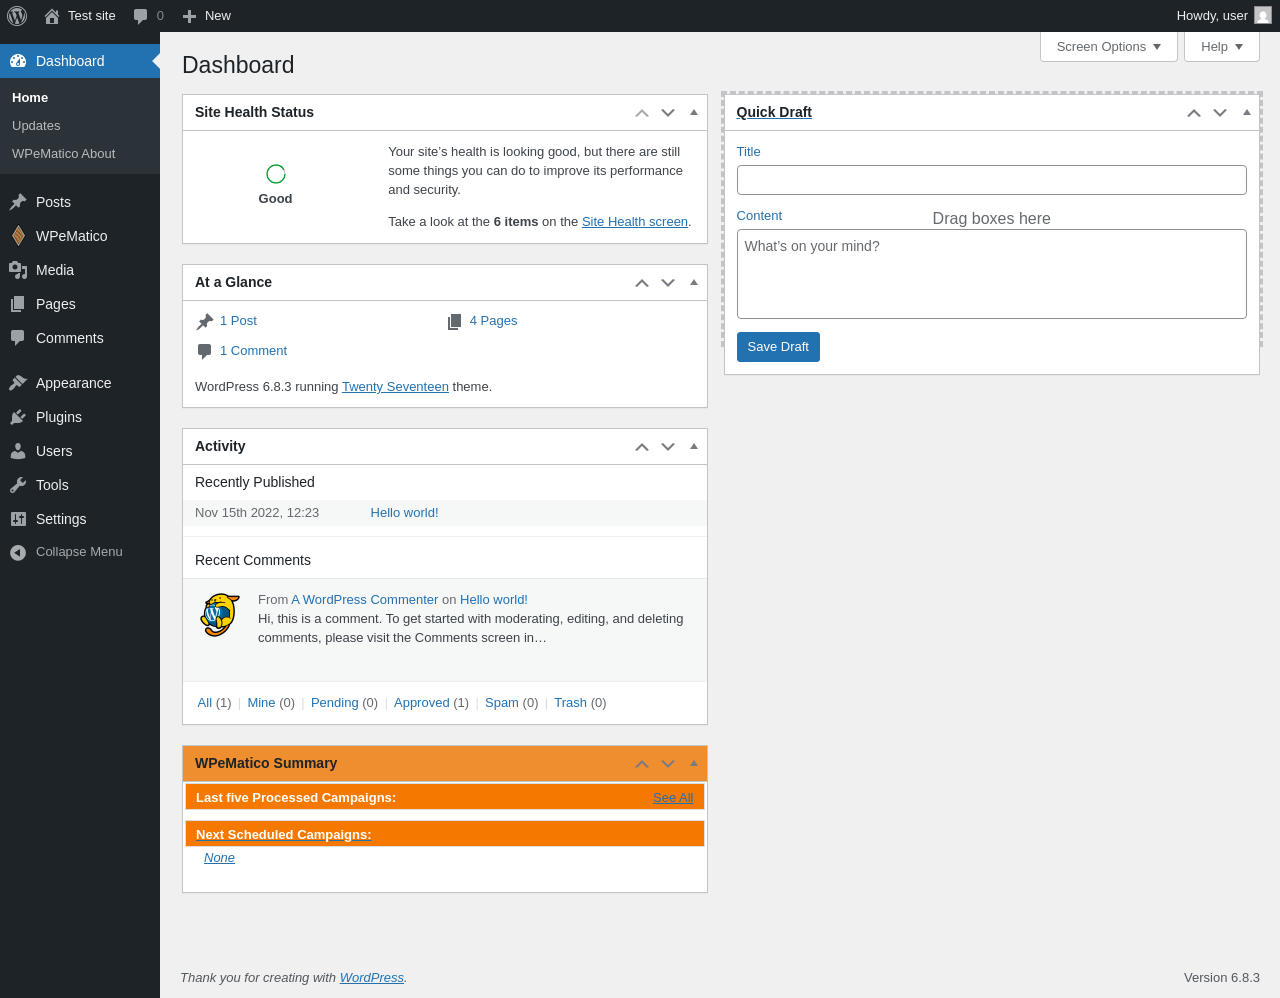
| URL | /wp-admin/index.php |
|---|---|
| Aspect | new-meta-boxes |
| HTTP status | 200 |
| Load time | 0.324 s |
| Memory usage | 3.79 MiB |
| JS errors | None |
| Resource errors | None |
Benchmark
| URL | Load time | Memory usage | ||||
|---|---|---|---|---|---|---|
| Inactive | Active | Change | Inactive | Active | Change | |
| /wp-admin/index.php | 0.412 s | 0.336 s | -0.076 s | 3.51 MiB | 3.79 MiB | + 288.96 KiB |
| /wp-admin/edit.php | 0.183 s | 0.215 s | +0.032 s | 3.57 MiB | 3.86 MiB | + 290.99 KiB |
| /wp-admin/post-new.php | 0.755 s | 0.808 s | +0.053 s | 6.06 MiB | 6.41 MiB | + 354.07 KiB |
| /wp-admin/upload.php | 0.732 s | 0.689 s | -0.043 s | 3.52 MiB | 3.77 MiB | + 255.9 KiB |
| /wp-admin/options-writing.php | 0.201 s | 0.237 s | +0.036 s | 3.5 MiB | 3.76 MiB | + 259.89 KiB |
| /wp-admin/media-new.php | 0.257 s | 0.227 s | -0.030 s | 3.49 MiB | 3.75 MiB | + 268.09 KiB |
| /wp-admin/edit-tags.php?taxonomy=category | 0.217 s | 0.206 s | -0.011 s | 3.5 MiB | 3.77 MiB | + 272.63 KiB |
| /wp-admin/post-new.php?post_type=page | 0.648 s | 0.604 s | -0.044 s | 6.05 MiB | 6.3 MiB | + 258.69 KiB |
| /wp-admin/options-discussion.php | 0.342 s | 0.267 s | -0.075 s | 3.5 MiB | 3.75 MiB | + 256.39 KiB |
| /wp-admin/edit-comments.php | 0.191 s | 0.235 s | +0.044 s | 3.52 MiB | 3.77 MiB | + 255.89 KiB |
| / | 0.311 s | 0.571 s | +0.260 s | 3.43 MiB | 3.5 MiB | + 68.38 KiB |
| Average | 0.386 s | 0.400 s | +0.013 s | 3.97 MiB | 4.22 MiB | + 257.26 KiB |
Code Statistics
Note: Third-party libraries and minified JS/CSS files are excluded from these statistics where possible, so the numbers you see here may be lower than those reported by other tools.
| Language | % | Lines of code | Comment lines | Files | |
|---|---|---|---|---|---|
| PO File | 70.6% | 54,561 | 23,482 | 11 | |
| PHP | 20.1% | 15,539 | 3,093 | 37 | |
| JavaScript | 4.3% | 3,363 | 770 | 16 | |
| CSS | 3.5% | 2,712 | 27 | 6 | |
| Markdown | 1.5% | 1,139 | 0 | 2 | |
| Total | 77,314 | 27,372 | 72 | ||
PHP Code Analysis | More results »
| Lines of code | 15,314 |
|---|---|
| Total complexity | 3,495 |
| Median class complexity | 57.5 |
| Median method complexity | 3.0 |
| Most complex class | WPeMatico_functions |
| Most complex function | WPeMatico_functions::check_campaigndata() |
| Classes | 28 |
|---|---|
| Methods | 435 |
| Functions | 82 |
Additions
Things that the plugin adds to the site. This section is not intended to be comprehensive. The test tool only looks for a few specific types of added content.
Options wp_options 2
- wpematico_db_version
- WPeMatico_Options
Custom Post Types 1
| ID | Name |
|---|---|
| wpematico | Campaigns |
Meta Boxes
{
    "dashboard": {
        "wpematico_widget": {
            "title": "WPeMatico Summary",
            "context": "normal"
        }
    }
}
PHP Error Log 1 lines
[30-Oct-2025 14:02:48 UTC] PHP Notice: Function _load_textdomain_just_in_time was called <strong>incorrectly</strong>. Translation loading for the <code>wpematico</code> domain was triggered too early. This is usually an indicator for some code in the plugin or theme running too early. Translations should be loaded at the <code>init</code> action or later. Please see <a href="https://developer.wordpress.org/advanced-administration/debug/debug-wordpress/">Debugging in WordPress</a> for more information. (This message was added in version 6.7.0.) in /wp-includes/functions.php on line 6121