WP Visitor Statistics (Real Time Traffic) 8.3
Does "WP Visitor Statistics (Real Time Traffic)" work with WordPress 6.8.2 and PHP 8.1.12? A smoke test was performed on .
Summary
| No PHP errors, warnings or notices | |
| No JavaScript exceptions | |
| All test pages loaded successfully | |
| No resource errors | |
| Looks good! No problems were detected. |
Memory usage: 110.87 KiB
The average PHP memory usage increased by this amount after activating by the plugin.
Page speed impact:
0.044 seconds
The average page load time increased by this amount after activating the plugin.
| WordPress version | 6.8.2 |
|---|---|
| PHP version | 8.1.12 |
| MySQL version | 10.6.10 |
| PHP memory limit | 512M |
| Last updated | |
|---|---|
| Active installs | 30,000+ |
| WordPress.org page | https://wordpress.org/plugins/wp-stats-manager/ |
| Badges |
|
Pages 9
Plugins ‹ Test site — WordPress
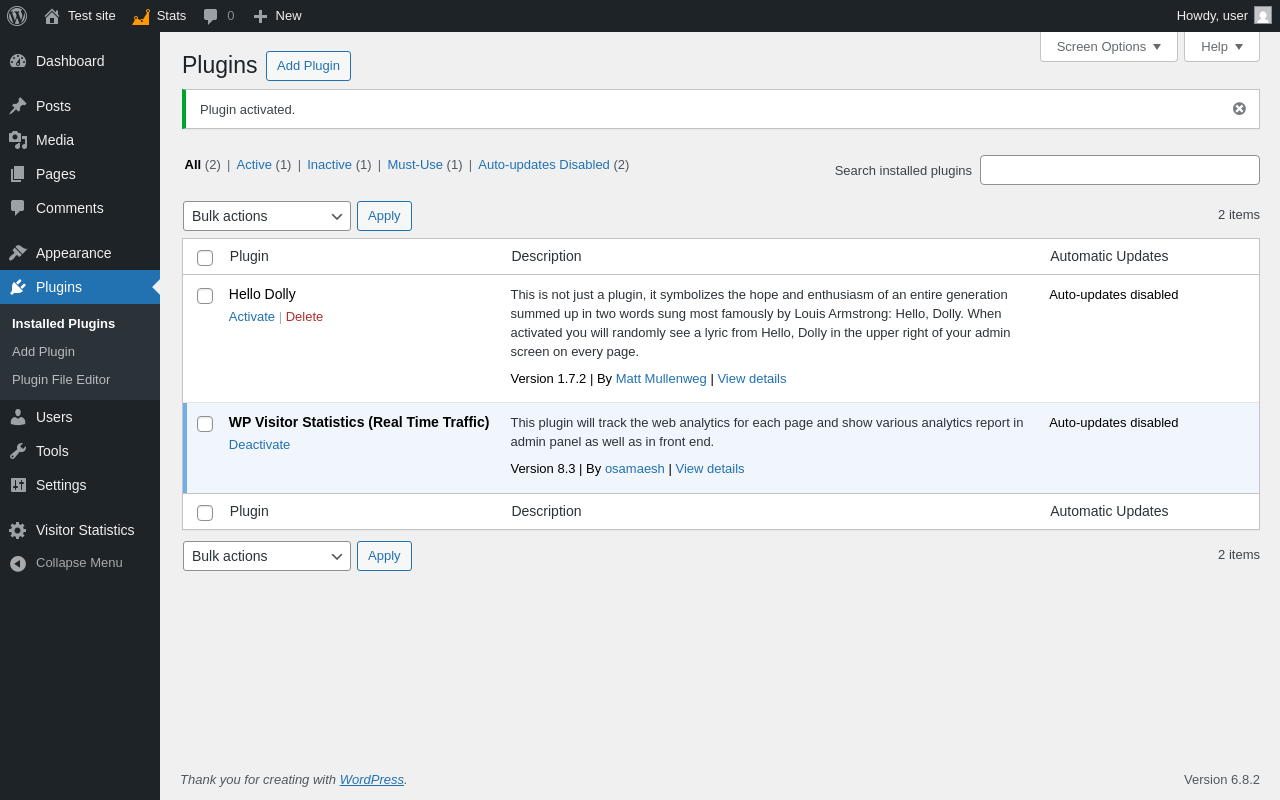
| URL | /wp-admin/plugins.php?plugin_status=all&paged=1&s |
|---|---|
| Requested URL | /wp-admin/plugins.php?action=activate&plugin=wp-stats-manager%2Fwp-stats-manager.php&plugin_status=all&paged=1&s&_wpnonce=fbbb8c3c3f |
| Aspect | after-activation |
| HTTP status | 200 |
| Load time | 0.635 s |
| Memory usage | 3.63 MiB |
| JS errors | None |
| Resource errors | None |
Visitor Statistics
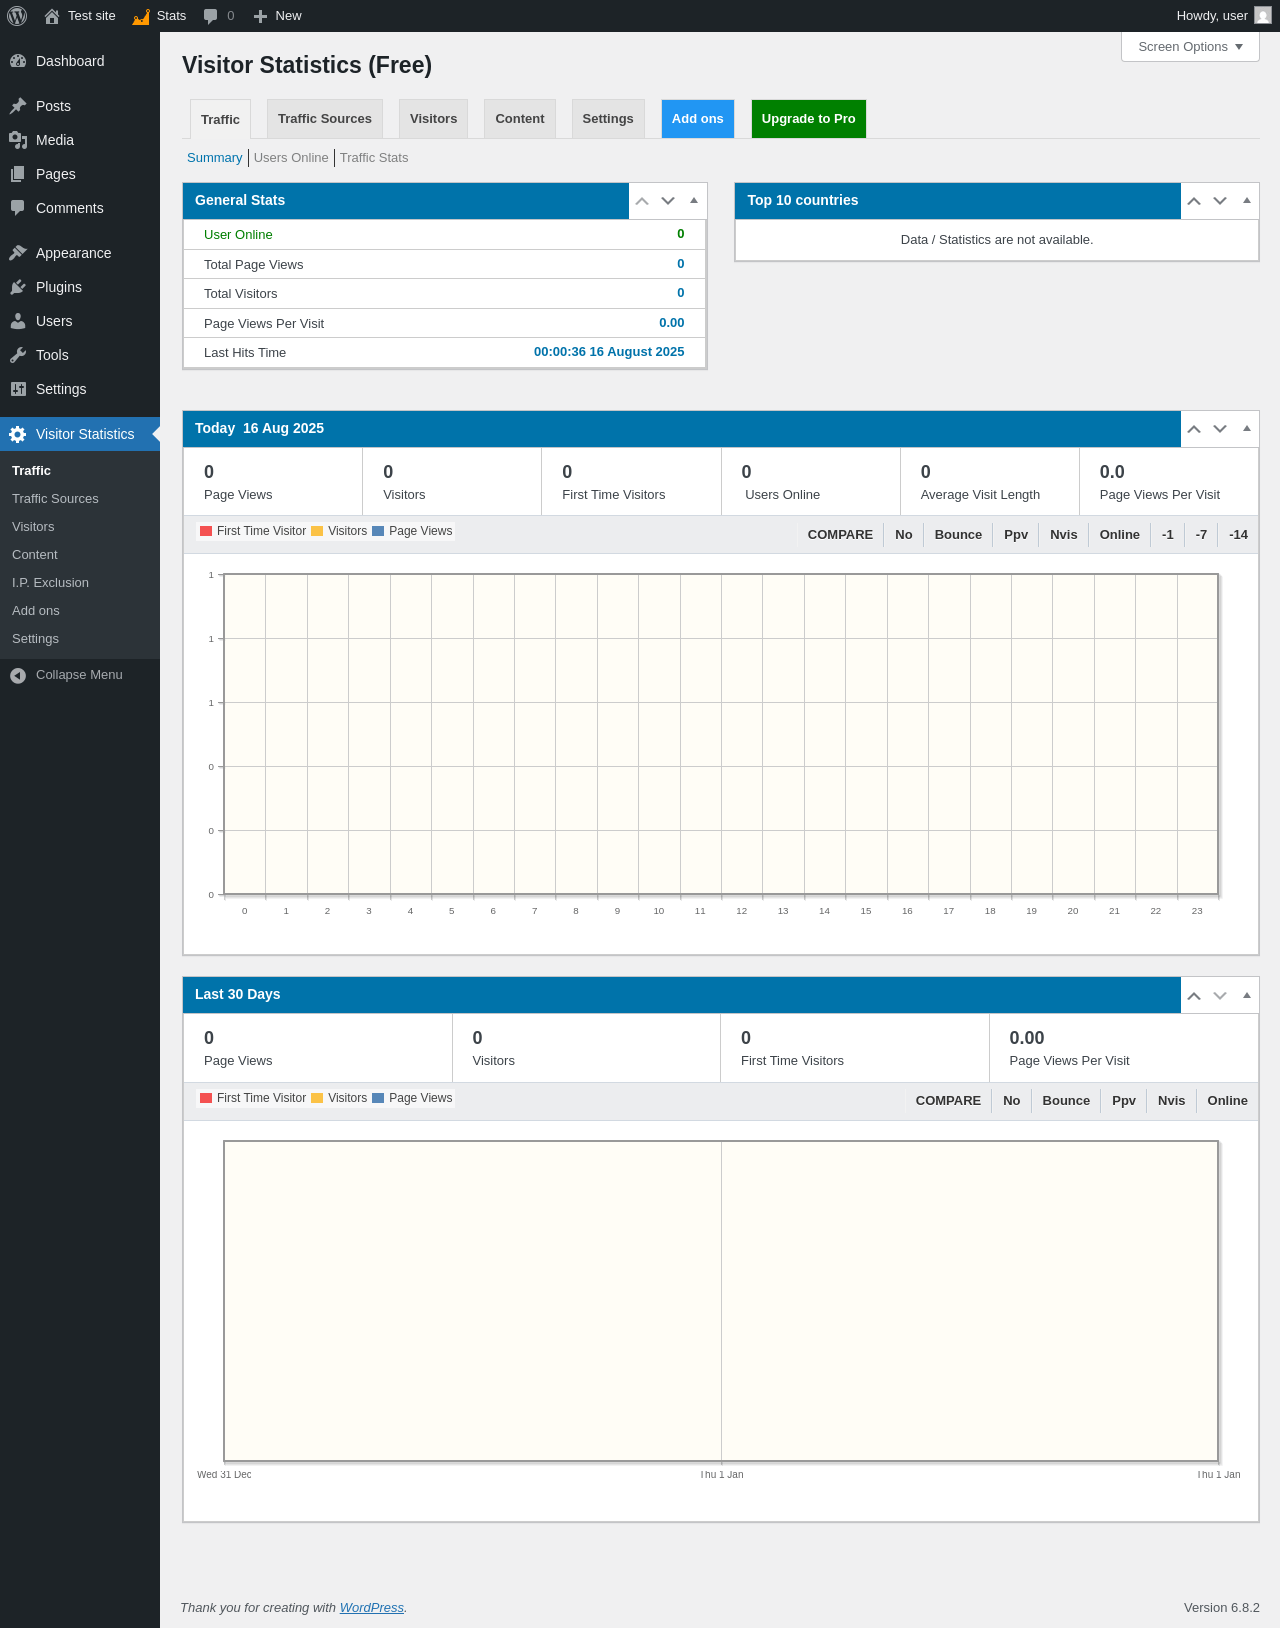
| URL | /wp-admin/admin.php?page=wsm_traffic |
|---|---|
| Aspect | menu-item |
| HTTP status | 200 |
| Load time | 1.065 s |
| Memory usage | 3.69 MiB |
| JS errors | None |
| Resource errors | None |
Visitor Statistics → Traffic Sources
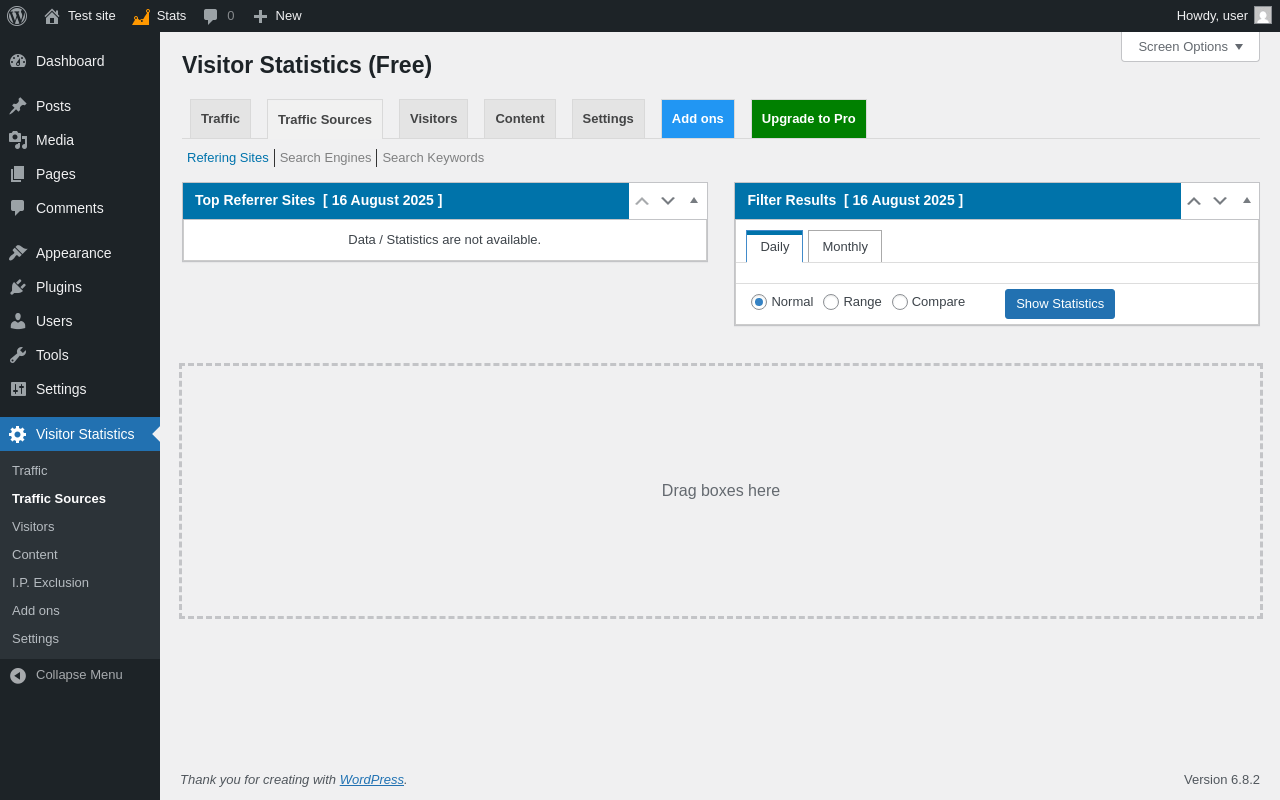
| URL | /wp-admin/admin.php?page=wsm_trafficsrc |
|---|---|
| Aspect | menu-item |
| HTTP status | 200 |
| Load time | 0.481 s |
| Memory usage | 3.62 MiB |
| JS errors | None |
| Resource errors | None |
Visitor Statistics → Visitors
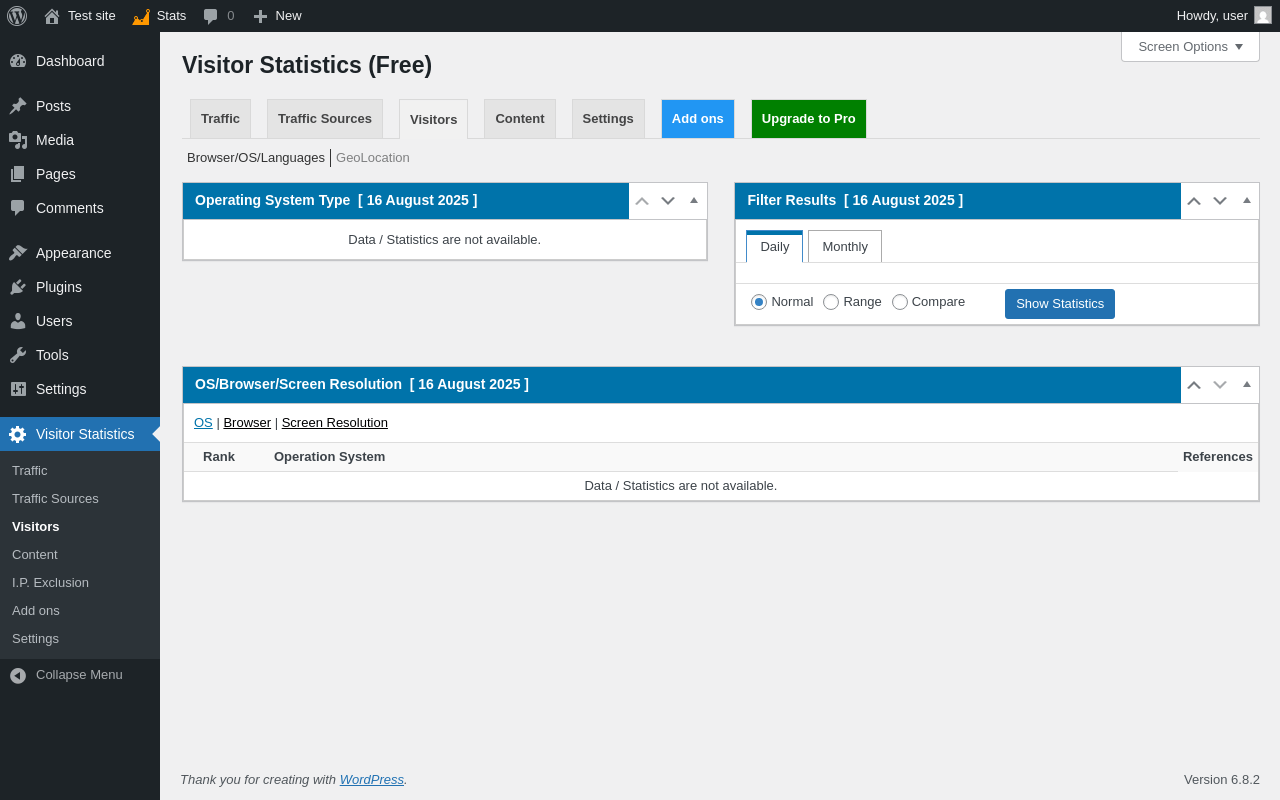
| URL | /wp-admin/admin.php?page=wsm_visitors |
|---|---|
| Aspect | menu-item |
| HTTP status | 200 |
| Load time | 0.394 s |
| Memory usage | 3.68 MiB |
| JS errors | None |
| Resource errors | None |
Visitor Statistics → Content
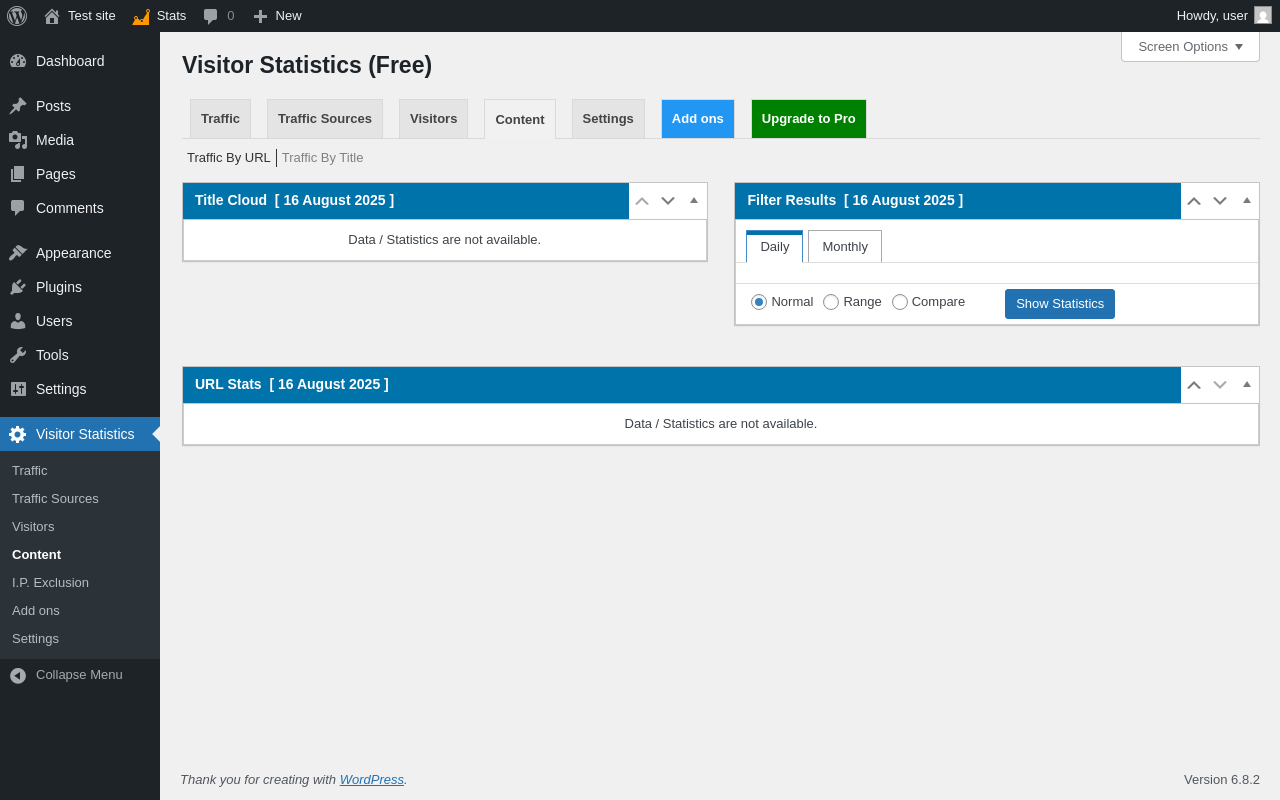
| URL | /wp-admin/admin.php?page=wsm_content |
|---|---|
| Aspect | menu-item |
| HTTP status | 200 |
| Load time | 0.388 s |
| Memory usage | 3.62 MiB |
| JS errors | None |
| Resource errors | None |
Visitor Statistics → I.P. Exclusion
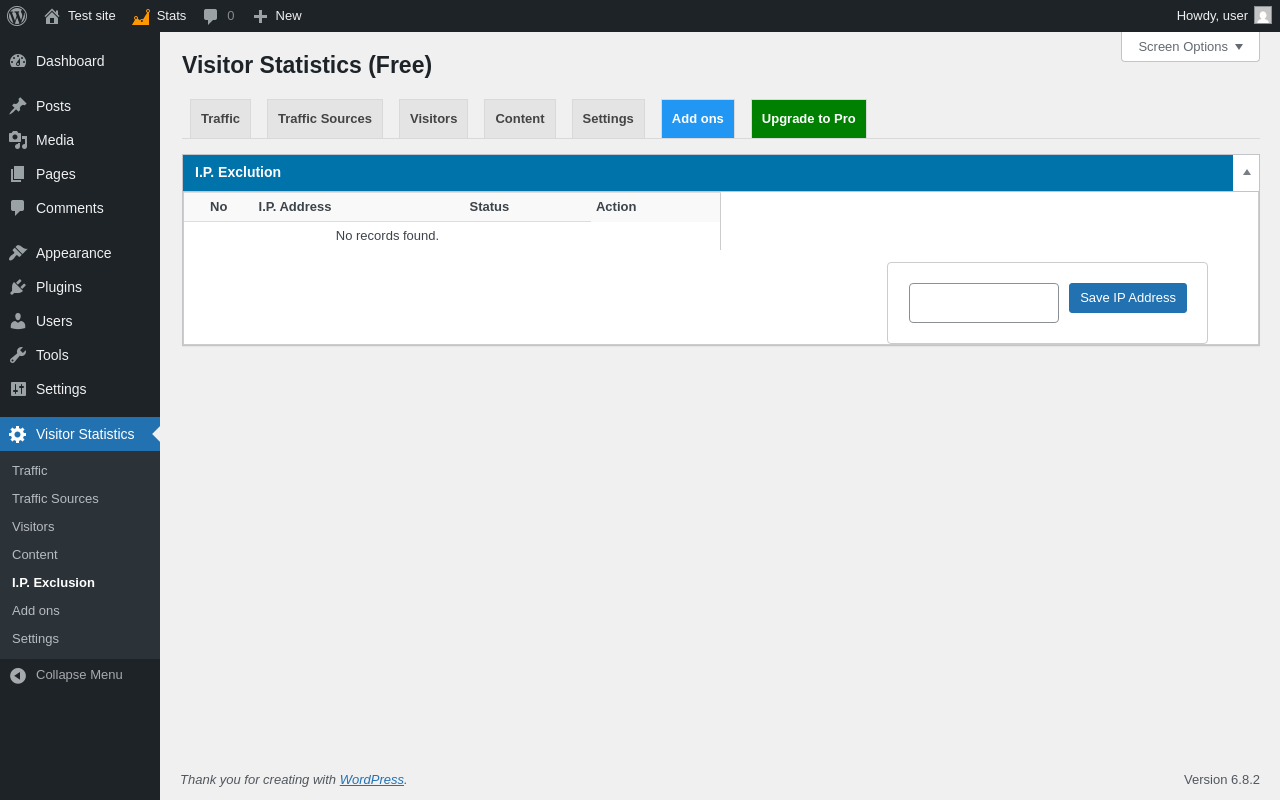
| URL | /wp-admin/admin.php?page=wsm_ipexc |
|---|---|
| Aspect | menu-item |
| HTTP status | 200 |
| Load time | 0.355 s |
| Memory usage | 3.62 MiB |
| JS errors | None |
| Resource errors | None |
Visitor Statistics → Add ons
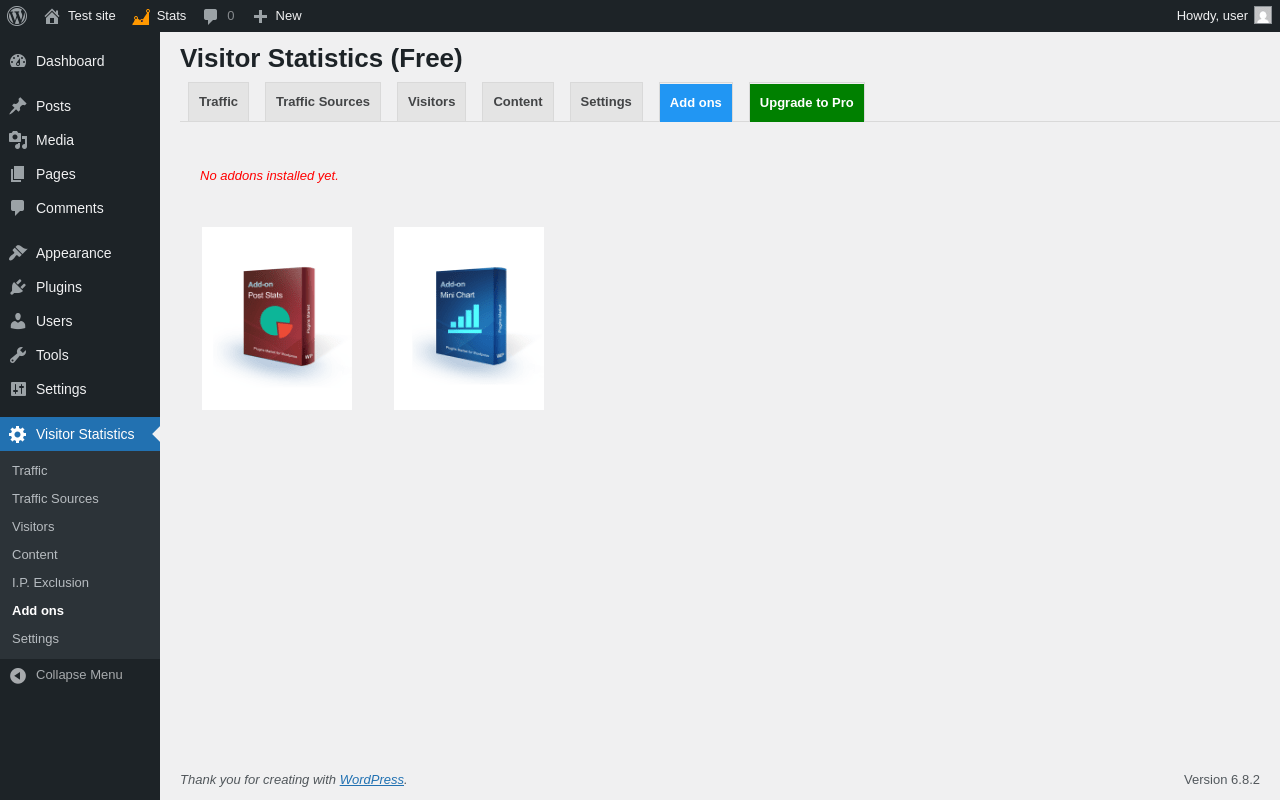
| URL | /wp-admin/admin.php?page=wsm_addons |
|---|---|
| Aspect | menu-item |
| HTTP status | 200 |
| Load time | 0.449 s |
| Memory usage | 3.62 MiB |
| JS errors | None |
| Resource errors | None |
Visitor Statistics → Settings
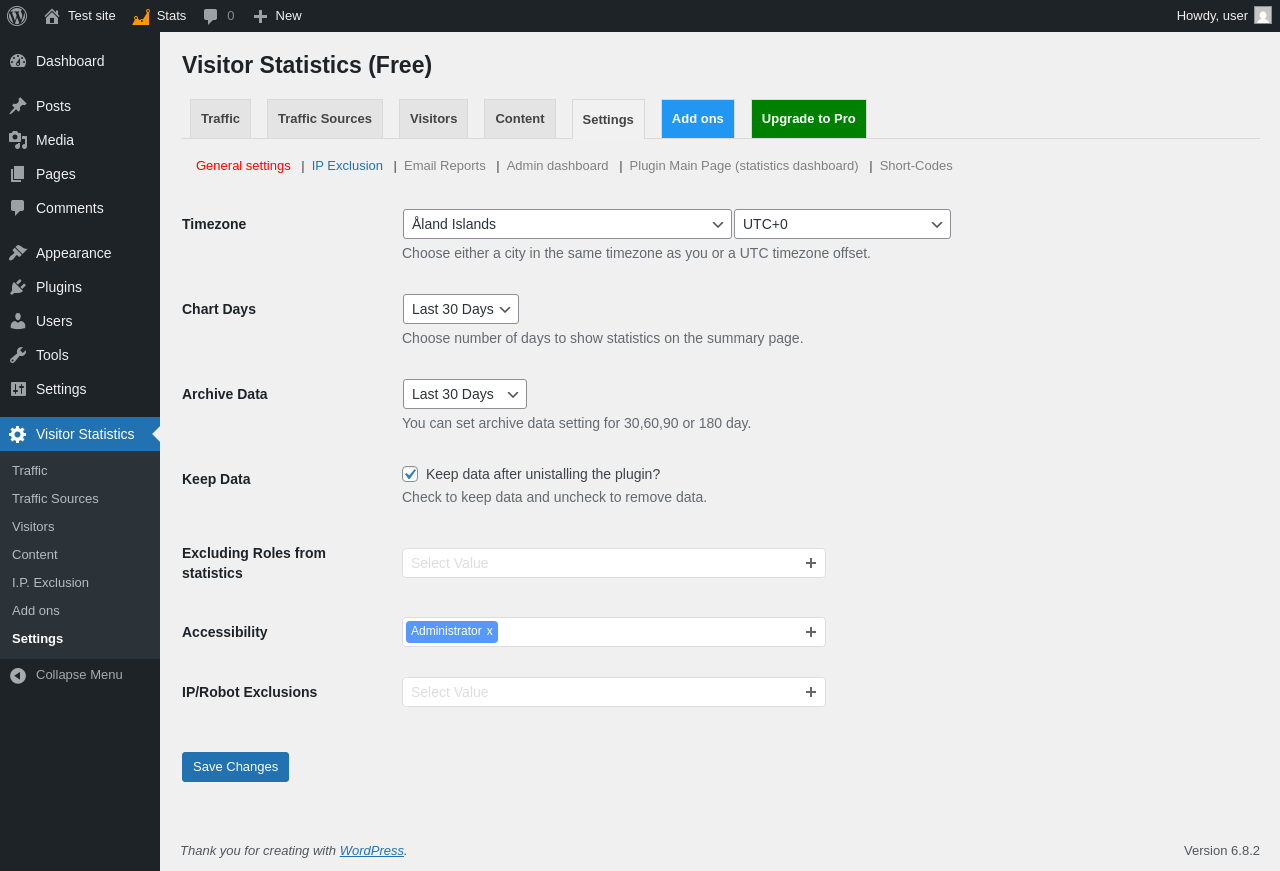
| URL | /wp-admin/admin.php?page=wsm_settings |
|---|---|
| Aspect | menu-item |
| HTTP status | 200 |
| Load time | 0.480 s |
| Memory usage | 4.05 MiB |
| JS errors | None |
| Resource errors | None |
Test site – Just another WordPress site
| URL | / |
|---|---|
| Aspect | front-page |
| HTTP status | 200 |
| Load time | 0.546 s |
| Memory usage | 3.52 MiB |
| JS errors | None |
| Resource errors | None |
Benchmark
| URL | Load time | Memory usage | ||||
|---|---|---|---|---|---|---|
| Inactive | Active | Change | Inactive | Active | Change | |
| /wp-admin/index.php | 0.308 s | 0.592 s | +0.284 s | 3.51 MiB | 3.62 MiB | + 115.38 KiB |
| /wp-admin/edit.php | 0.205 s | 0.328 s | +0.123 s | 3.57 MiB | 3.67 MiB | + 104.39 KiB |
| /wp-admin/post-new.php | 0.839 s | 0.997 s | +0.158 s | 6.06 MiB | 6.26 MiB | + 199 KiB |
| /wp-admin/upload.php | 0.755 s | 0.333 s | -0.422 s | 3.52 MiB | 3.62 MiB | + 95.29 KiB |
| /wp-admin/options-writing.php | 0.207 s | 0.232 s | +0.025 s | 3.5 MiB | 3.59 MiB | + 90.97 KiB |
| /wp-admin/media-new.php | 0.270 s | 0.267 s | -0.003 s | 3.49 MiB | 3.59 MiB | + 99.16 KiB |
| /wp-admin/edit-tags.php?taxonomy=category | 0.176 s | 0.183 s | +0.007 s | 3.5 MiB | 3.62 MiB | + 117.84 KiB |
| /wp-admin/post-new.php?post_type=page | 0.748 s | 0.778 s | +0.030 s | 6.05 MiB | 6.18 MiB | + 130.52 KiB |
| /wp-admin/options-discussion.php | 0.274 s | 0.342 s | +0.068 s | 3.5 MiB | 3.59 MiB | + 87.47 KiB |
| /wp-admin/edit-comments.php | 0.226 s | 0.208 s | -0.018 s | 3.52 MiB | 3.62 MiB | + 94.97 KiB |
| / | 0.307 s | 0.539 s | +0.232 s | 3.43 MiB | 3.52 MiB | + 84.59 KiB |
| Average | 0.392 s | 0.436 s | +0.044 s | 3.97 MiB | 4.08 MiB | + 110.87 KiB |
Code Statistics
Note: Third-party libraries and minified JS/CSS files are excluded from these statistics where possible, so the numbers you see here may be lower than those reported by other tools.
| Language | % | Lines of code | Comment lines | Files | |
|---|---|---|---|---|---|
| JavaScript | 48.6% | 16,011 | 5,354 | 18 | |
| PHP | 43.7% | 14,414 | 1,562 | 11 | |
| PO File | 4.9% | 1,630 | 1,088 | 3 | |
| CSS | 2.7% | 904 | 47 | 6 | |
| Total | 32,959 | 8,051 | 38 | ||
PHP Code Analysis | More results »
| Lines of code | 14,108 |
|---|---|
| Total complexity | 3,141 |
| Median class complexity | 285.5 |
| Median method complexity | 4.0 |
| Most complex class | wsmStatistics |
| Most complex function | wsmFnGetTimeZoneByCountry() |
| Classes | 6 |
|---|---|
| Methods | 278 |
| Functions | 48 |
Additions
Things that the plugin adds to the site. This section is not intended to be comprehensive. The test tool only looks for a few specific types of added content.
Database Tables 35
- wp_wsm_bounceVisits
- wp_wsm_browsers
- wp_wsm_countries
- wp_wsm_dailyHourlyReport
- wp_wsm_dateWiseBounce
- wp_wsm_dateWiseBounceRate
- wp_wsm_dateWiseFirstVisitors
- wp_wsm_dateWisePageViews
- wp_wsm_dateWiseVisitors
- wp_wsm_datewise_report
- wp_wsm_hourWiseBounce
- wp_wsm_hourWiseBounceRate
- wp_wsm_hourWiseFirstVisitors
- wp_wsm_hourWisePageViews
- wp_wsm_hourWiseVisitors
- wp_wsm_logUniqueVisit
- wp_wsm_logVisit
- wp_wsm_monthWiseBounce
- wp_wsm_monthWiseBounceRate
- wp_wsm_monthWiseFirstVisitors
- wp_wsm_monthWisePageViews
- wp_wsm_monthWiseVisitors
- wp_wsm_monthlyDailyReport
- wp_wsm_monthwise_report
- wp_wsm_oSystems
- wp_wsm_pageViews
- wp_wsm_regions
- wp_wsm_resolutions
- wp_wsm_searchEngines
- wp_wsm_toolBars
- wp_wsm_uniqueVisitors
- wp_wsm_url_log
- wp_wsm_visitorInfo
- wp_wsm_yearlyMonthlyReport
- wp_wsm_yearwise_report
Options wp_options 6
- wsm_dailyReportedTime
- wsm_free_active_time
- wsm_lastHitTime
- wsm_popup_status
- wsm_tables
- wsmKeepData
PHP Error Log
The log file is empty.