WP Visitor Statistics (Real Time Traffic) 7.9
Does "WP Visitor Statistics (Real Time Traffic)" work with WordPress 6.8.1 and PHP 8.1.12? A smoke test was performed on .
Summary
| No PHP errors, warnings or notices | |
| No JavaScript exceptions | |
| All test pages loaded successfully | |
| No resource errors | |
| Looks good! No problems were detected. |
Memory usage: 105.44 KiB
The average PHP memory usage increased by this amount after activating by the plugin.
Page speed impact:
insignificant.
The plugin didn't make the site noticeably slower.
| WordPress version | 6.8.1 |
|---|---|
| PHP version | 8.1.12 |
| MySQL version | 10.6.10 |
| PHP memory limit | 512M |
| Last updated | |
|---|---|
| Active installs | 30,000+ |
| WordPress.org page | https://wordpress.org/plugins/wp-stats-manager/ |
| Badges |
|
Pages 9
Plugins ‹ Test site — WordPress
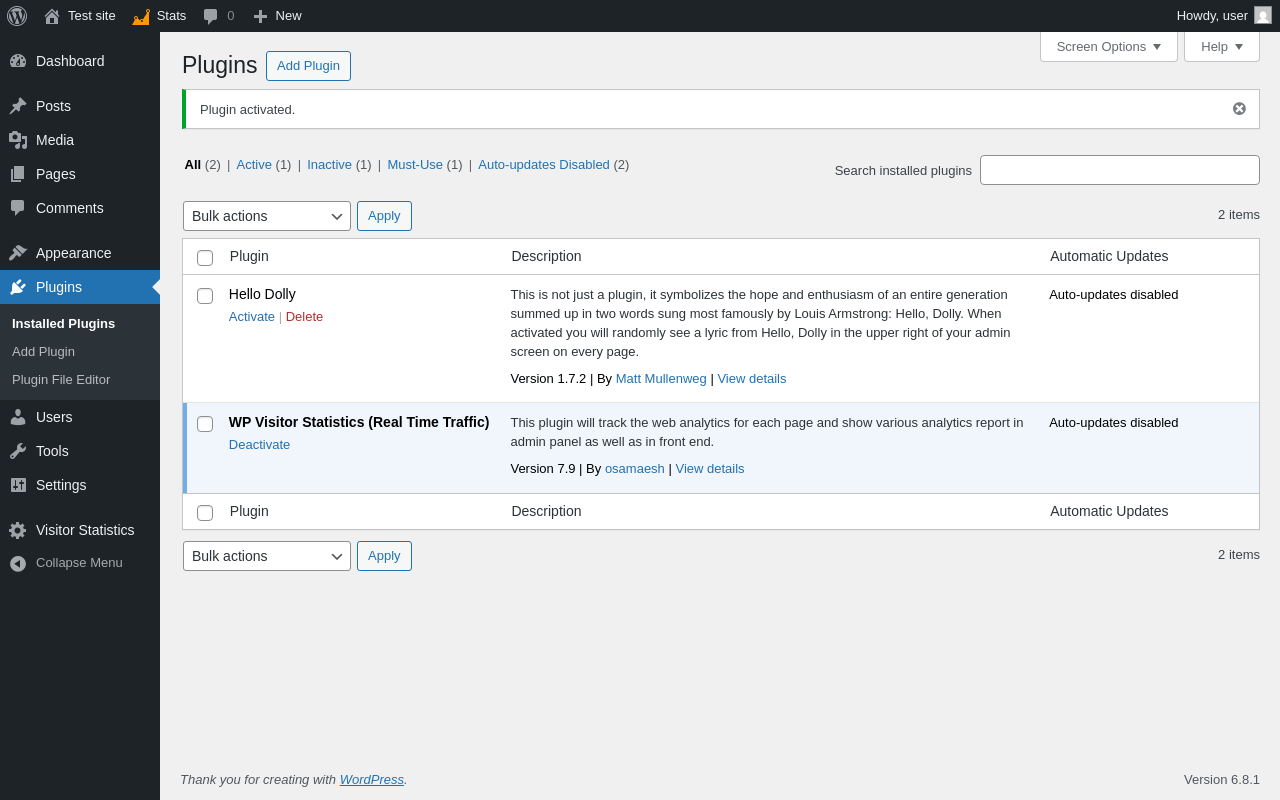
| URL | /wp-admin/plugins.php?plugin_status=all&paged=1&s |
|---|---|
| Requested URL | /wp-admin/plugins.php?action=activate&plugin=wp-stats-manager%2Fwp-stats-manager.php&plugin_status=all&paged=1&s&_wpnonce=257bd60730 |
| Aspect | after-activation |
| HTTP status | 200 |
| Load time | 0.587 s |
| Memory usage | 3.63 MiB |
| JS errors | None |
| Resource errors | None |
Visitor Statistics
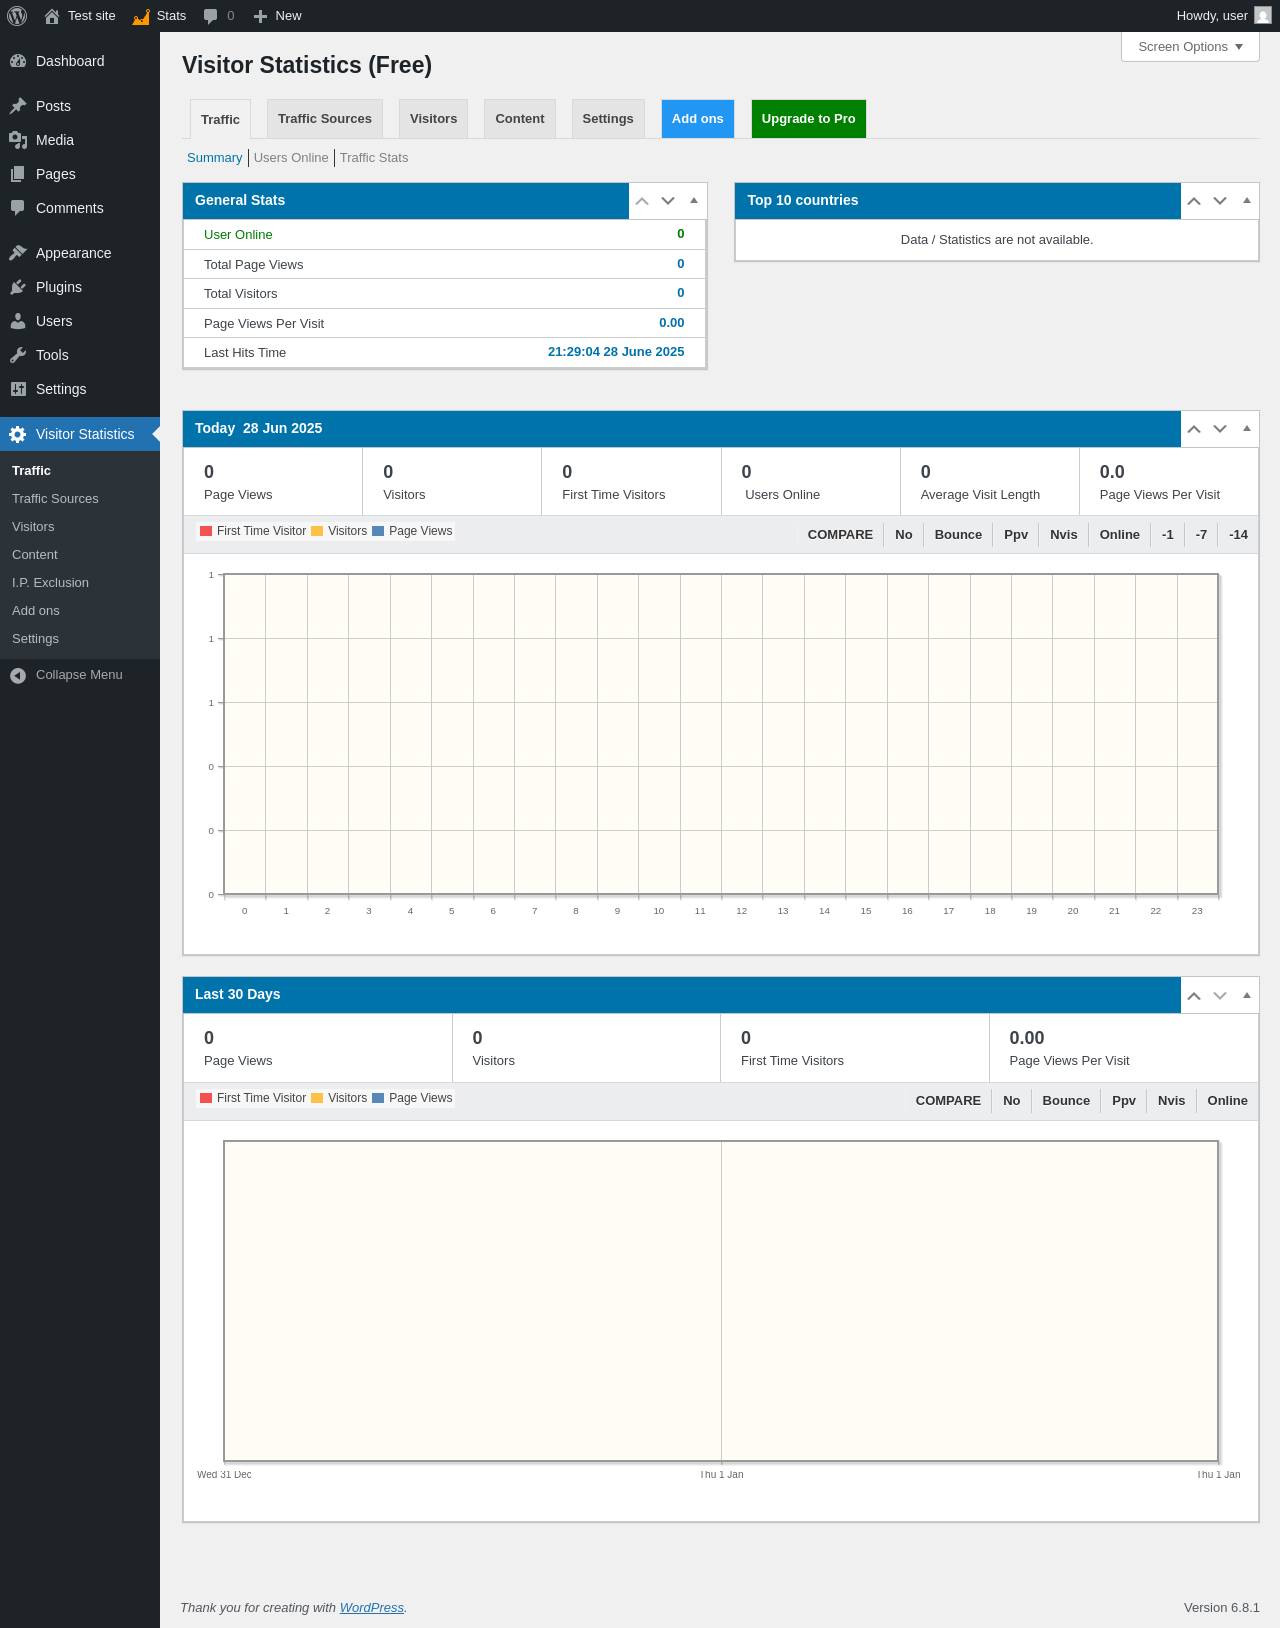
| URL | /wp-admin/admin.php?page=wsm_traffic |
|---|---|
| Aspect | menu-item |
| HTTP status | 200 |
| Load time | 1.014 s |
| Memory usage | 3.69 MiB |
| JS errors | None |
| Resource errors | None |
Visitor Statistics → Traffic Sources
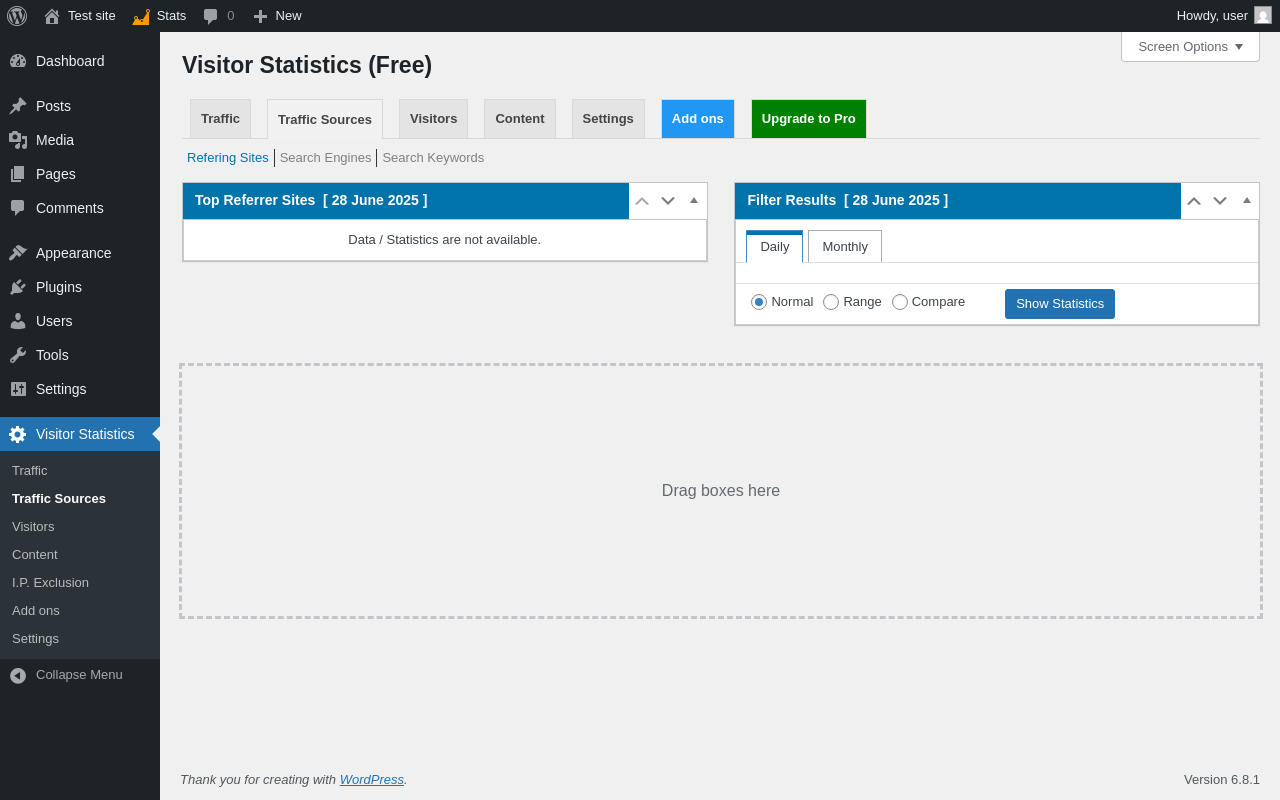
| URL | /wp-admin/admin.php?page=wsm_trafficsrc |
|---|---|
| Aspect | menu-item |
| HTTP status | 200 |
| Load time | 0.373 s |
| Memory usage | 3.62 MiB |
| JS errors | None |
| Resource errors | None |
Visitor Statistics → Visitors
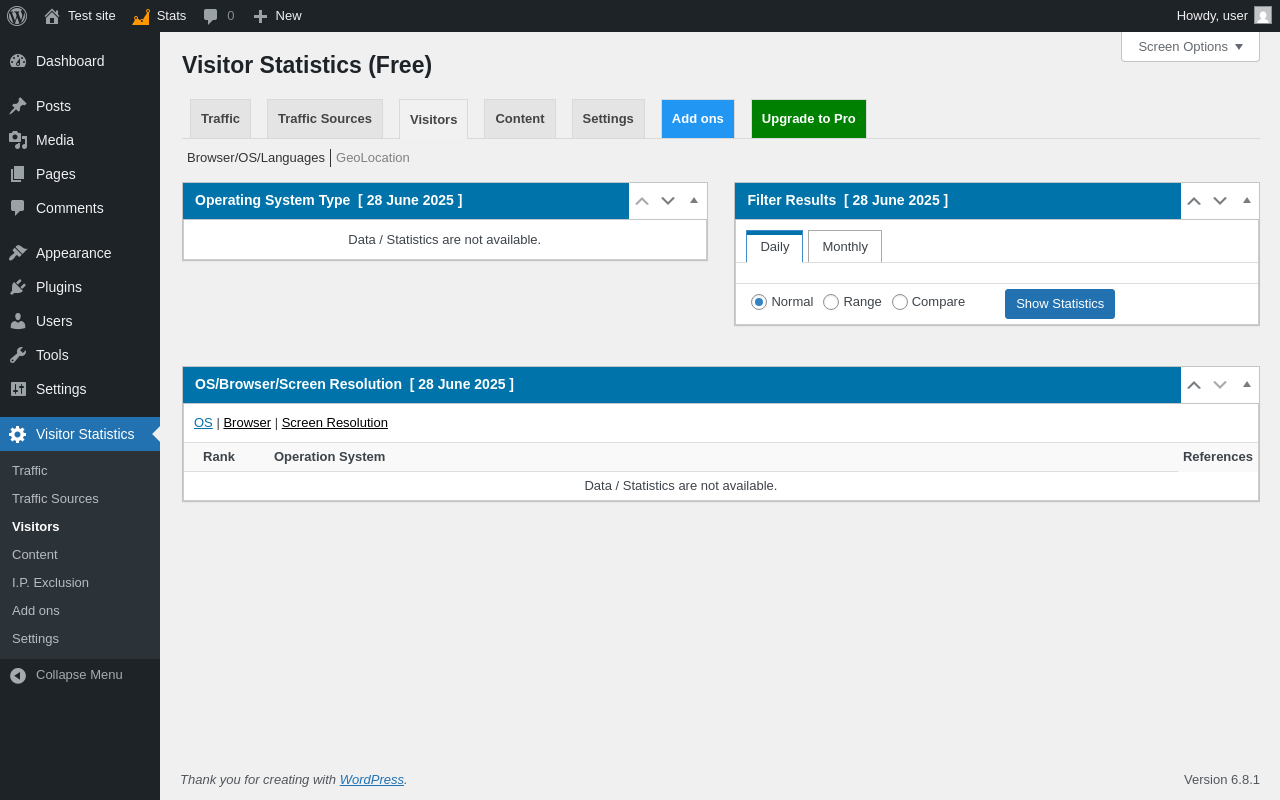
| URL | /wp-admin/admin.php?page=wsm_visitors |
|---|---|
| Aspect | menu-item |
| HTTP status | 200 |
| Load time | 0.389 s |
| Memory usage | 3.68 MiB |
| JS errors | None |
| Resource errors | None |
Visitor Statistics → Content
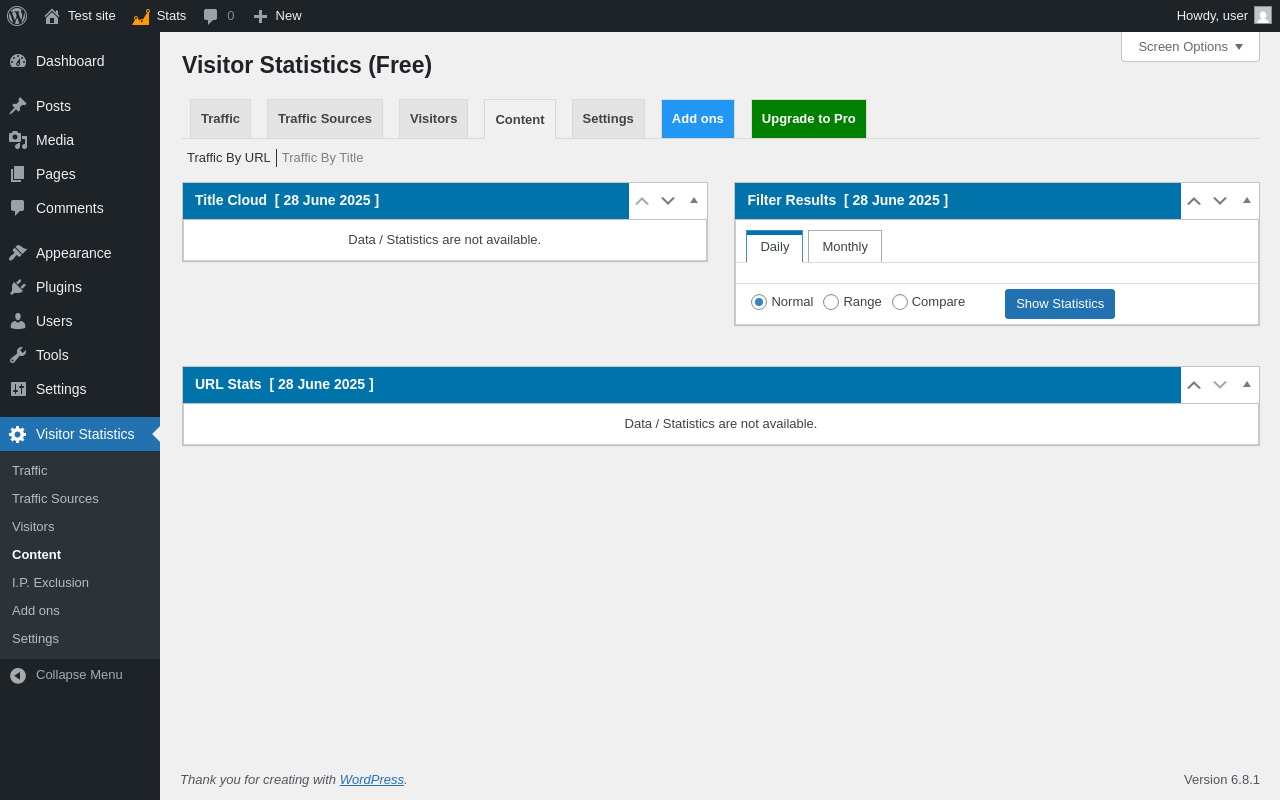
| URL | /wp-admin/admin.php?page=wsm_content |
|---|---|
| Aspect | menu-item |
| HTTP status | 200 |
| Load time | 0.414 s |
| Memory usage | 3.62 MiB |
| JS errors | None |
| Resource errors | None |
Visitor Statistics → I.P. Exclusion
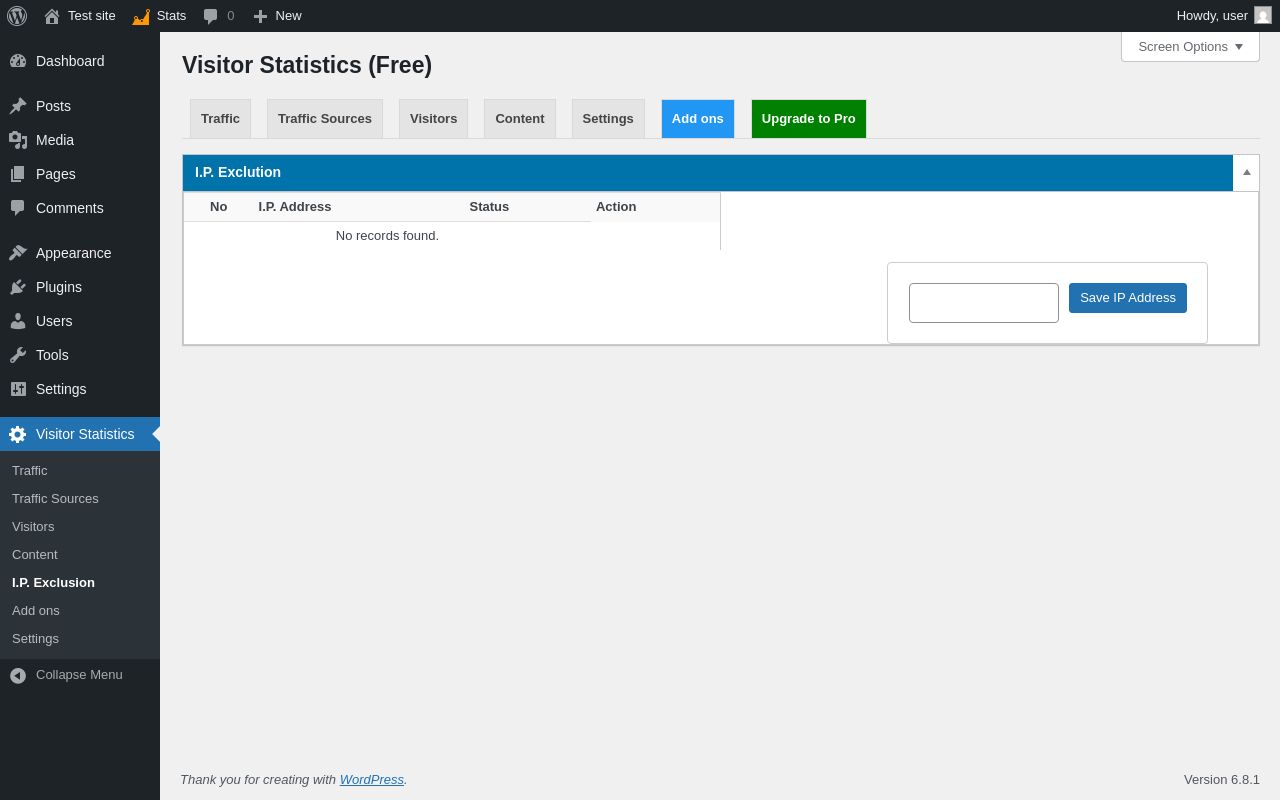
| URL | /wp-admin/admin.php?page=wsm_ipexc |
|---|---|
| Aspect | menu-item |
| HTTP status | 200 |
| Load time | 0.320 s |
| Memory usage | 3.62 MiB |
| JS errors | None |
| Resource errors | None |
Visitor Statistics → Add ons
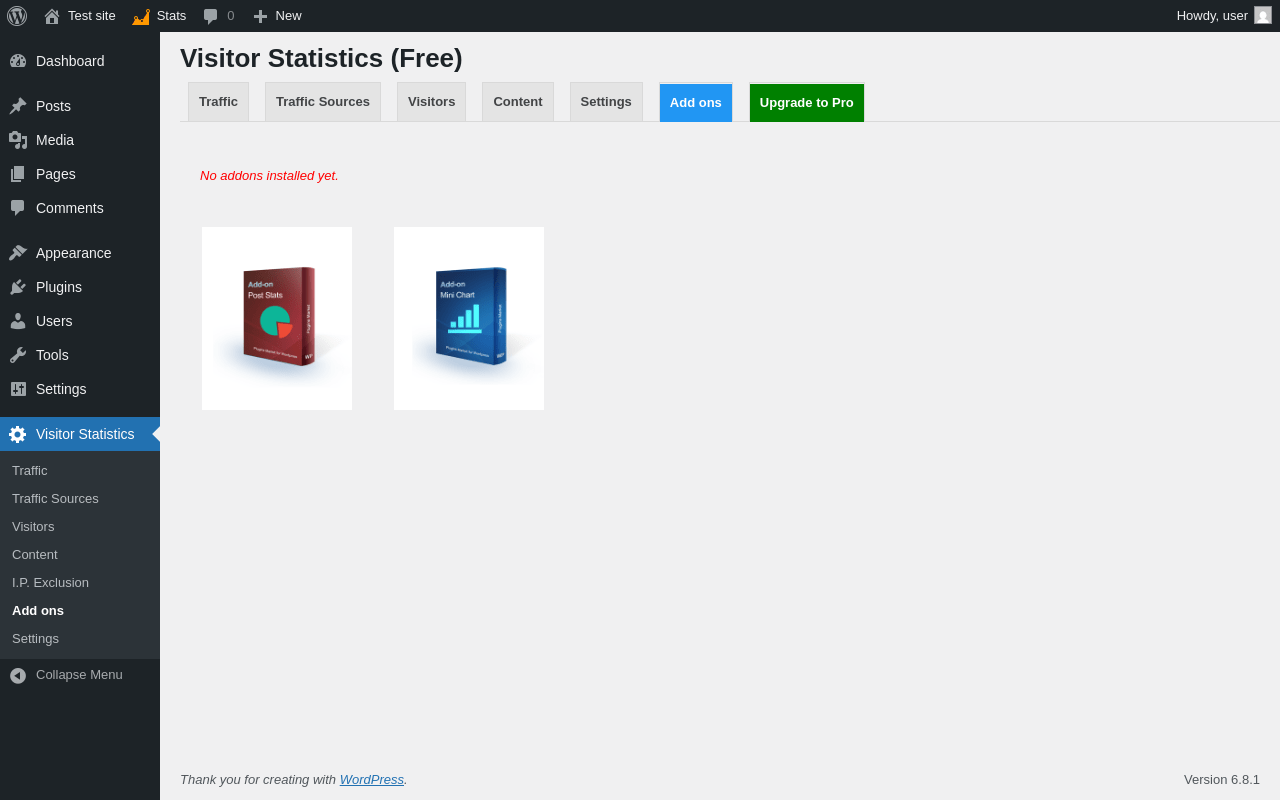
| URL | /wp-admin/admin.php?page=wsm_addons |
|---|---|
| Aspect | menu-item |
| HTTP status | 200 |
| Load time | 0.479 s |
| Memory usage | 3.62 MiB |
| JS errors | None |
| Resource errors | None |
Visitor Statistics → Settings
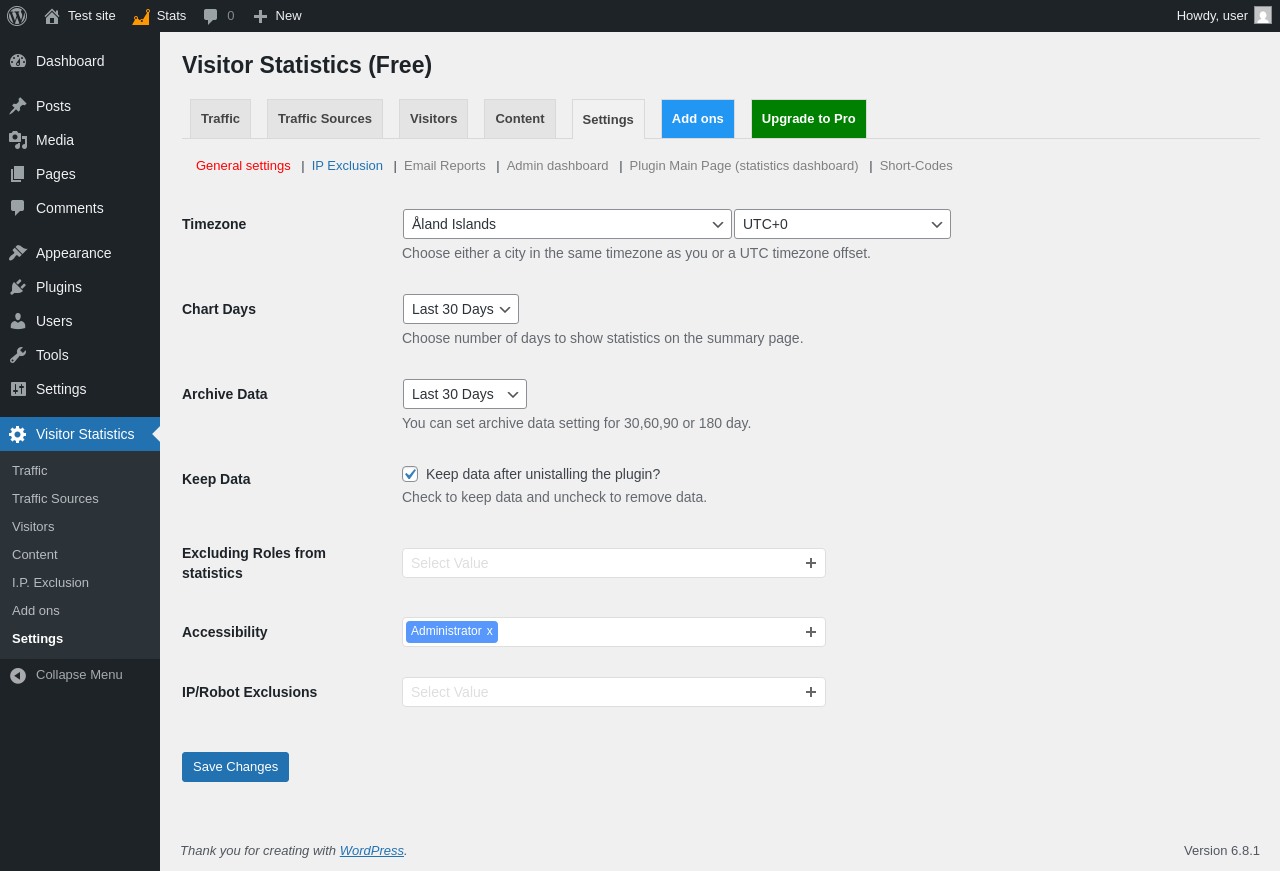
| URL | /wp-admin/admin.php?page=wsm_settings |
|---|---|
| Aspect | menu-item |
| HTTP status | 200 |
| Load time | 0.510 s |
| Memory usage | 4.05 MiB |
| JS errors | None |
| Resource errors | None |
Test site – Just another WordPress site
| URL | / |
|---|---|
| Aspect | front-page |
| HTTP status | 200 |
| Load time | 0.611 s |
| Memory usage | 3.52 MiB |
| JS errors | None |
| Resource errors | None |
Benchmark
| URL | Load time | Memory usage | ||||
|---|---|---|---|---|---|---|
| Inactive | Active | Change | Inactive | Active | Change | |
| /wp-admin/index.php | 0.598 s | 0.458 s | -0.140 s | 3.51 MiB | 3.62 MiB | + 116.05 KiB |
| /wp-admin/edit.php | 0.222 s | 0.199 s | -0.023 s | 3.57 MiB | 3.67 MiB | + 105.06 KiB |
| /wp-admin/post-new.php | 0.815 s | 1.208 s | +0.393 s | 6.06 MiB | 6.26 MiB | + 199.67 KiB |
| /wp-admin/upload.php | 0.671 s | 0.568 s | -0.103 s | 3.52 MiB | 3.62 MiB | + 95.97 KiB |
| /wp-admin/options-writing.php | 0.241 s | 0.206 s | -0.035 s | 3.5 MiB | 3.59 MiB | + 91.65 KiB |
| /wp-admin/media-new.php | 0.286 s | 0.243 s | -0.043 s | 3.49 MiB | 3.59 MiB | + 99.84 KiB |
| /wp-admin/edit-tags.php?taxonomy=category | 0.203 s | 0.414 s | +0.211 s | 3.5 MiB | 3.62 MiB | + 118.52 KiB |
| /wp-admin/post-new.php?post_type=page | 1.121 s | 0.783 s | -0.338 s | 6.05 MiB | 6.18 MiB | + 131.2 KiB |
| /wp-admin/options-discussion.php | 0.333 s | 0.492 s | +0.159 s | 3.5 MiB | 3.59 MiB | + 88.15 KiB |
| /wp-admin/edit-comments.php | 0.478 s | 0.211 s | -0.267 s | 3.52 MiB | 3.62 MiB | + 95.65 KiB |
| / | 0.347 s | 0.564 s | +0.217 s | 3.5 MiB | 3.52 MiB | + 18.06 KiB |
| Average | 0.483 s | 0.486 s | +0.003 s | 3.98 MiB | 4.08 MiB | + 105.44 KiB |
Code Statistics
Note: Third-party libraries and minified JS/CSS files are excluded from these statistics where possible, so the numbers you see here may be lower than those reported by other tools.
| Language | % | Lines of code | Comment lines | Files | |
|---|---|---|---|---|---|
| JavaScript | 48.6% | 16,011 | 5,354 | 18 | |
| PHP | 43.7% | 14,390 | 1,561 | 11 | |
| PO File | 4.9% | 1,630 | 1,088 | 3 | |
| CSS | 2.7% | 904 | 47 | 6 | |
| Total | 32,935 | 8,050 | 38 | ||
PHP Code Analysis | More results »
| Lines of code | 14,082 |
|---|---|
| Total complexity | 3,130 |
| Median class complexity | 282.5 |
| Median method complexity | 4.0 |
| Most complex class | wsmStatistics |
| Most complex function | wsmFnGetTimeZoneByCountry() |
| Classes | 6 |
|---|---|
| Methods | 278 |
| Functions | 48 |
Additions
Things that the plugin adds to the site. This section is not intended to be comprehensive. The test tool only looks for a few specific types of added content.
Database Tables 35
- wp_wsm_bounceVisits
- wp_wsm_browsers
- wp_wsm_countries
- wp_wsm_dailyHourlyReport
- wp_wsm_dateWiseBounce
- wp_wsm_dateWiseBounceRate
- wp_wsm_dateWiseFirstVisitors
- wp_wsm_dateWisePageViews
- wp_wsm_dateWiseVisitors
- wp_wsm_datewise_report
- wp_wsm_hourWiseBounce
- wp_wsm_hourWiseBounceRate
- wp_wsm_hourWiseFirstVisitors
- wp_wsm_hourWisePageViews
- wp_wsm_hourWiseVisitors
- wp_wsm_logUniqueVisit
- wp_wsm_logVisit
- wp_wsm_monthWiseBounce
- wp_wsm_monthWiseBounceRate
- wp_wsm_monthWiseFirstVisitors
- wp_wsm_monthWisePageViews
- wp_wsm_monthWiseVisitors
- wp_wsm_monthlyDailyReport
- wp_wsm_monthwise_report
- wp_wsm_oSystems
- wp_wsm_pageViews
- wp_wsm_regions
- wp_wsm_resolutions
- wp_wsm_searchEngines
- wp_wsm_toolBars
- wp_wsm_uniqueVisitors
- wp_wsm_url_log
- wp_wsm_visitorInfo
- wp_wsm_yearlyMonthlyReport
- wp_wsm_yearwise_report
Options wp_options 6
- wsm_dailyReportedTime
- wsm_free_active_time
- wsm_lastHitTime
- wsm_popup_status
- wsm_tables
- wsmKeepData
PHP Error Log
The log file is empty.