Home
WP Statistics – The Most Popular Privacy-Friendly Analytics Plugin
14.13.2
Does WP Statistics work with WordPress 6.8 and PHP 8.1.12? A smoke test was performed on 2025-04-20 09:32:49 UTC .
Summary
Errors
2 PHP notices 1 Unrecognized messages in the PHP error log
No JavaScript exceptions
All test pages loaded successfully
No resource errors
Performance
Memory usage: 458.83 KiB The average PHP memory usage increased by this amount after activating by the plugin.
Page speed impact:
0.045 seconds The average page load time increased by this amount after activating the plugin.
Environment
WordPress version 6.8 PHP version 8.1.12 MySQL version 10.6.10 PHP memory limit 512M
Pages 17 Plugins ‹ Test site — WordPress
URL
/wp-admin/plugins.php?plugin_status=all&paged=1&s
Requested URL
/wp-admin/plugins.php?action=activate&plugin=wp-statistics%2Fwp-statistics.php&plugin_status=all&paged=1&s&_wpnonce=ff2048c9dd
Aspect
after-activation
HTTP status
200
Load time
0.744 s
Memory usage
4.46 MiB
JS errors
None
Resource errors
None
Statistics
URL
/wp-admin/admin.php?page=wps_overview_page
Aspect
menu-item
HTTP status
200
Load time
1.016 s
Memory usage
3.98 MiB
JS errors
None
Resource errors
None
Statistics → Visitor Insights
URL
/wp-admin/admin.php?page=wps_visitors_page
Aspect
menu-item
HTTP status
200
Load time
0.442 s
Memory usage
3.97 MiB
JS errors
None
Resource errors
None
Statistics → Page Insights
URL
/wp-admin/admin.php?page=wps_pages_page
Aspect
menu-item
HTTP status
200
Load time
0.419 s
Memory usage
3.97 MiB
JS errors
None
Resource errors
None
Statistics → Referrals
URL
/wp-admin/admin.php?page=wps_referrals_page
Aspect
menu-item
HTTP status
200
Load time
0.314 s
Memory usage
3.98 MiB
JS errors
None
Resource errors
None
Statistics → Content Analytics
URL
/wp-admin/admin.php?page=wps_content-analytics_page
Aspect
menu-item
HTTP status
200
Load time
0.454 s
Memory usage
4.09 MiB
JS errors
None
Resource errors
None
Statistics → Author Analytics
URL
/wp-admin/admin.php?page=wps_author-analytics_page
Aspect
menu-item
HTTP status
200
Load time
0.633 s
Memory usage
4.32 MiB
JS errors
None
Resource errors
None
Statistics → Category Analytics
URL
/wp-admin/admin.php?page=wps_category-analytics_page
Aspect
menu-item
HTTP status
200
Load time
0.439 s
Memory usage
4.02 MiB
JS errors
None
Resource errors
None
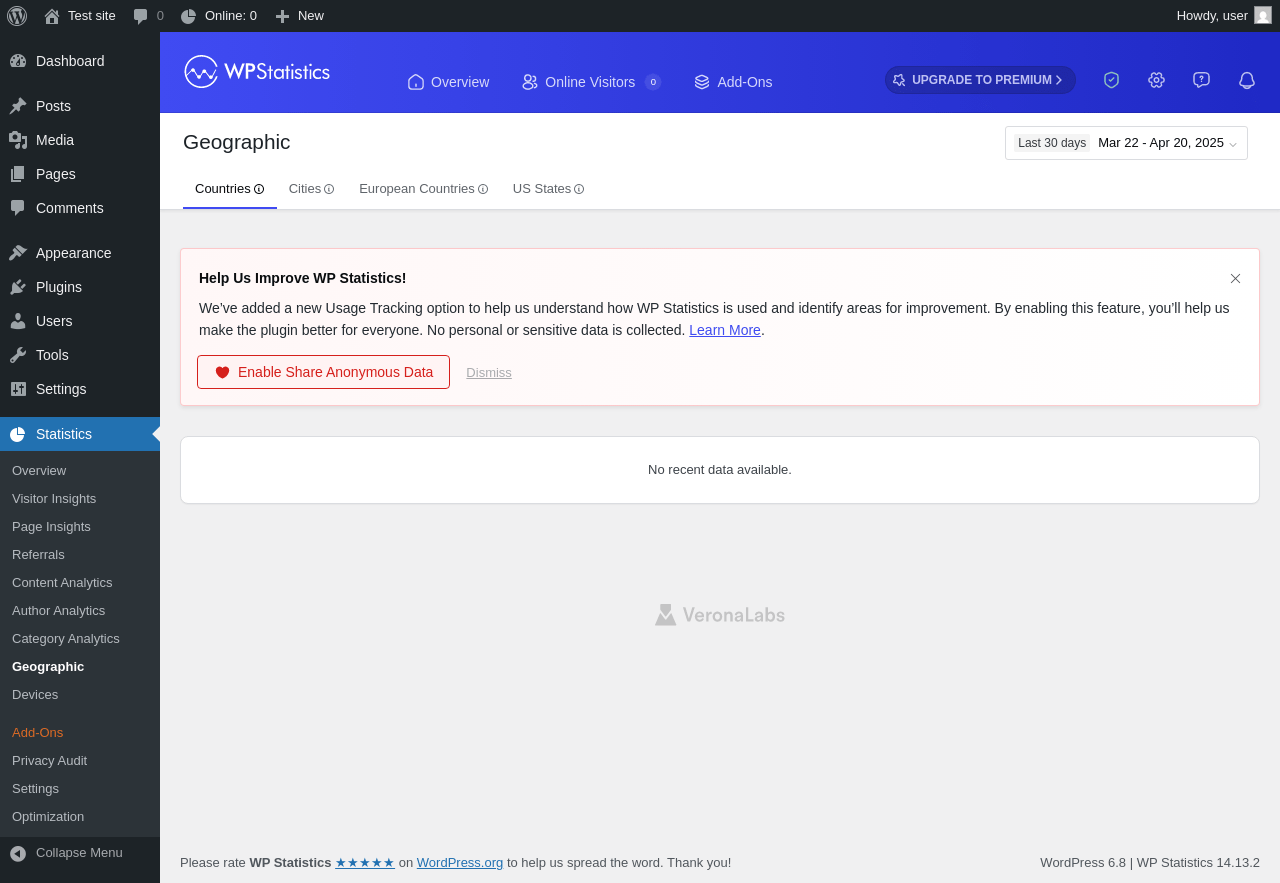
Statistics → Geographic
URL
/wp-admin/admin.php?page=wps_geographic_page
Aspect
menu-item
HTTP status
200
Load time
0.357 s
Memory usage
3.98 MiB
JS errors
None
Resource errors
None
Statistics → Devices
URL
/wp-admin/admin.php?page=wps_devices_page
Aspect
menu-item
HTTP status
200
Load time
0.337 s
Memory usage
3.95 MiB
JS errors
None
Resource errors
None
Statistics →
URL
/wp-admin/admin.php?page=wps_break_menu
Aspect
menu-item
HTTP status
200
Load time
3.464 s
Memory usage
4.19 MiB
JS errors
None
Resource errors
None
Statistics → Add-Ons
URL
/wp-admin/admin.php?page=wps_plugins_page
Aspect
menu-item
HTTP status
200
Load time
0.339 s
Memory usage
4.02 MiB
JS errors
None
Resource errors
None
Statistics → Privacy Audit
URL
/wp-admin/admin.php?page=wps_privacy-audit_page
Aspect
menu-item
HTTP status
200
Load time
0.376 s
Memory usage
3.95 MiB
JS errors
None
Resource errors
None
Statistics → Settings
URL
/wp-admin/admin.php?page=wps_settings_page
Aspect
menu-item
HTTP status
200
Load time
1.804 s
Memory usage
4.28 MiB
JS errors
None
Resource errors
None
Statistics → Optimization
URL
/wp-admin/admin.php?page=wps_optimization_page
Aspect
menu-item
HTTP status
200
Load time
0.407 s
Memory usage
3.97 MiB
JS errors
None
Resource errors
None
Test site – Just another WordPress site
URL
/
Aspect
front-page
HTTP status
200
Load time
0.319 s
Memory usage
3.59 MiB
JS errors
None
Resource errors
None
Widgets ‹ Test site — WordPress
URL
/wp-admin/widgets.php
Aspect
new-sidebar-widgets
HTTP status
200
Load time
1.950 s
Memory usage
6.28 MiB
JS errors
None
Resource errors
None
Benchmark
URL
Load time
Memory usage
Inactive
Active
Change
Inactive
Active
Change
/wp-admin/index.php 0.331 s 0.452 s +0.121 s 3.51 MiB 4.04 MiB + 550.17 KiB /wp-admin/edit.php 0.199 s 0.431 s +0.232 s 3.57 MiB 4.09 MiB + 535.19 KiB /wp-admin/post-new.php 0.776 s 0.922 s +0.146 s 6.06 MiB 6.6 MiB + 553.19 KiB /wp-admin/upload.php 0.723 s 0.383 s -0.340 s 3.52 MiB 3.96 MiB + 442.56 KiB /wp-admin/options-writing.php 0.195 s 0.499 s +0.304 s 3.5 MiB 3.94 MiB + 446.06 KiB /wp-admin/media-new.php 0.269 s 0.215 s -0.054 s 3.49 MiB 3.93 MiB + 454.16 KiB /wp-admin/edit-tags.php?taxonomy=category 0.259 s 0.233 s -0.026 s 3.5 MiB 3.97 MiB + 481.13 KiB /wp-admin/post-new.php?post_type=page 0.683 s 0.683 s +0.000 s 6.05 MiB 6.59 MiB + 549.12 KiB /wp-admin/options-discussion.php 0.330 s 0.344 s +0.014 s 3.5 MiB 3.93 MiB + 442.68 KiB /wp-admin/edit-comments.php 0.197 s 0.339 s +0.142 s 3.52 MiB 3.95 MiB + 442 KiB / 0.290 s 0.242 s -0.048 s 3.43 MiB 3.58 MiB + 150.91 KiB
Average
0.387 s 0.431 s +0.045 s 3.97 MiB 4.42 MiB + 458.83 KiB
Code Statistics
Note: Third-party libraries and minified JS/CSS files are excluded from these statistics where
possible, so the numbers you see here may be lower than those reported by other tools.
Language
%
Lines of code
Comment lines
Files
YAML 30.7% 50,465 3,532 20 PHP 30.7% 50,458 15,122 600 SVG 15.8% 25,885 4 371 JavaScript 12.5% 20,543 2,073 61 Sass 9.7% 15,922 93 76 CSS 0.5% 788 47 4 HTML 0.1% 187 0 2 XML 0.0% 79 13 1 JSON 0.0% 1 0 1
Total
164,328
20,884
1,136
Lines of code
39,069
Total complexity
6,723
Median class complexity
7.0
Median method complexity
2.0
Most complex class
WP_STATISTICS\Helper
Most complex function
WP_Statistics\Service\Admin\SiteHealthInfo::getPluginSettings()
Classes
378
Methods
2,277
Functions
25
Additions
Things that the plugin adds to the site. This section is not intended to be comprehensive.
The test tool only looks for a few specific types of added content.
Database Tables 8 wp_statistics_events wp_statistics_exclusions wp_statistics_historical wp_statistics_pages wp_statistics_useronline wp_statistics_visit wp_statistics_visitor wp_statistics_visitor_relationships Options wp_options 10 widget_wp_statistics_widget wp_statistics wp_statistics_ajax_background_process wp_statistics_check_user_online wp_statistics_db wp_statistics_is_fresh wp_statistics_jobs wp_statistics_plugin_version wp_statistics_privacy_status wp_statistics_user_modals Sidebar Widgets 1
ID
Name
wp_statistics_widget Statistics
Meta Boxes {
"toplevel_page_wps_overview_page" : {
"wp-statistics-traffic-summary-widget" : {
"title" : "Traffic Summary" ,
"context" : "side"
},
"wp-statistics-browsers-widget" : {
"title" : "Browser Usage" ,
"context" : "side"
},
"wp-statistics-platforms-widget" : {
"title" : "Most Used Operating Systems" ,
"context" : "side"
},
"wp-statistics-devices-widget" : {
"title" : "Device Usage Breakdown" ,
"context" : "side"
},
"wp-statistics-models-widget" : {
"title" : "Top Device Model" ,
"context" : "side"
},
"wp-statistics-countries-widget" : {
"title" : "Top Countries" ,
"context" : "side"
},
"wp-statistics-referring-widget" : {
"title" : "Top Referring" ,
"context" : "side"
},
"wp-statistics-about-metabox" : {
"title" : "WP Statistics" ,
"context" : "side"
},
"wp-statistics-go-premium-widget" : {
"title" : "Go Premium" ,
"context" : "side"
},
"wp-statistics-hits-widget" : {
"title" : "Daily Traffic Trend" ,
"context" : "normal"
},
"wp-statistics-search-widget" : {
"title" : "Referrals from Search Engines" ,
"context" : "normal"
},
"wp-statistics-pages-widget" : {
"title" : "Most Visited Pages" ,
"context" : "normal"
},
"wp-statistics-top-visitors-widget" : {
"title" : "Most Active Visitors" ,
"context" : "normal"
},
"wp-statistics-recent-widget" : {
"title" : "Latest Visitor Breakdown" ,
"context" : "normal"
},
"wp-statistics-useronline-widget" : {
"title" : "Currently Online" ,
"context" : "normal"
},
"wp-statistics-hitsmap-widget" : {
"title" : "Global Visitor Distribution" ,
"context" : "normal"
}
},
"dashboard" : {
"wp-statistics-quickstats-widget" : {
"title" : "Traffic Overview" ,
"context" : "normal"
},
"wp-statistics-hits-widget" : {
"title" : "Daily Traffic Trend" ,
"context" : "normal"
},
"wp-statistics-search-widget" : {
"title" : "Referrals from Search Engines" ,
"context" : "normal"
},
"wp-statistics-pages-widget" : {
"title" : "Most Visited Pages" ,
"context" : "normal"
},
"wp-statistics-top-visitors-widget" : {
"title" : "Most Active Visitors" ,
"context" : "normal"
},
"wp-statistics-recent-widget" : {
"title" : "Latest Visitor Breakdown" ,
"context" : "normal"
},
"wp-statistics-useronline-widget" : {
"title" : "Currently Online" ,
"context" : "normal"
},
"wp-statistics-hitsmap-widget" : {
"title" : "Global Visitor Distribution" ,
"context" : "normal"
},
"wp-statistics-browsers-widget" : {
"title" : "Browser Usage" ,
"context" : "side"
},
"wp-statistics-platforms-widget" : {
"title" : "Most Used Operating Systems" ,
"context" : "side"
},
"wp-statistics-devices-widget" : {
"title" : "Device Usage Breakdown" ,
"context" : "side"
},
"wp-statistics-models-widget" : {
"title" : "Top Device Model" ,
"context" : "side"
},
"wp-statistics-countries-widget" : {
"title" : "Top Countries" ,
"context" : "side"
},
"wp-statistics-referring-widget" : {
"title" : "Top Referring" ,
"context" : "side"
}
}
}PHP Error Log 3 lines [20-Apr-2025 09:33:04 UTC] PHP Notice: Function _load_textdomain_just_in_time was called <strong>incorrectly</strong>. Translation loading for the <code>wp-statistics</code> domain was triggered too early. This is usually an indicator for some code in the plugin or theme running too early. Translations should be loaded at the <code>init</code> action or later. Please see <a href="https://developer.wordpress.org/advanced-administration/debug/debug-wordpress/">Debugging in WordPress</a> for more information. (This message was added in version 6.7.0.) in /wp-includes/functions.php on line 6121
[20-Apr-2025 09:33:28 UTC] [WP STATISTICS] [INFO]: Failed to initialize GeoIP reader: GeoIP database not found. Attempting to download...
[20-Apr-2025 09:33:31 UTC] PHP Notice: Function _load_textdomain_just_in_time was called <strong>incorrectly</strong>. Translation loading for the <code>wp-statistics</code> domain was triggered too early. This is usually an indicator for some code in the plugin or theme running too early. Translations should be loaded at the <code>init</code> action or later. Please see <a href="https://developer.wordpress.org/advanced-administration/debug/debug-wordpress/">Debugging in WordPress</a> for more information. (This message was added in version 6.7.0.) in /wp-includes/functions.php on line 6121