WP Maintenance Mode 2.4.1
Does WP Maintenance Mode work with WordPress 5.8.3 and PHP 7.4.8? A smoke test was performed on .
Summary
| 10 | PHP notices |
| No JavaScript exceptions | |
| All test pages loaded successfully | |
| No resource errors |
Memory usage: 54.78 KiB
The average PHP memory usage increased by this amount after activating by the plugin.
Page speed impact:
insignificant.
The plugin didn't make the site noticeably slower.
| WordPress version | 5.8.3 |
|---|---|
| PHP version | 7.4.8 |
| MySQL version | 8.0.21 |
| PHP memory limit | 256M |
| Last updated | |
|---|---|
| Active installs | 700,000+ |
| WordPress.org page | https://wordpress.org/plugins/wp-maintenance-mode/ |
| Badges |
|
Pages 7
Plugins ‹ Test site — WordPress
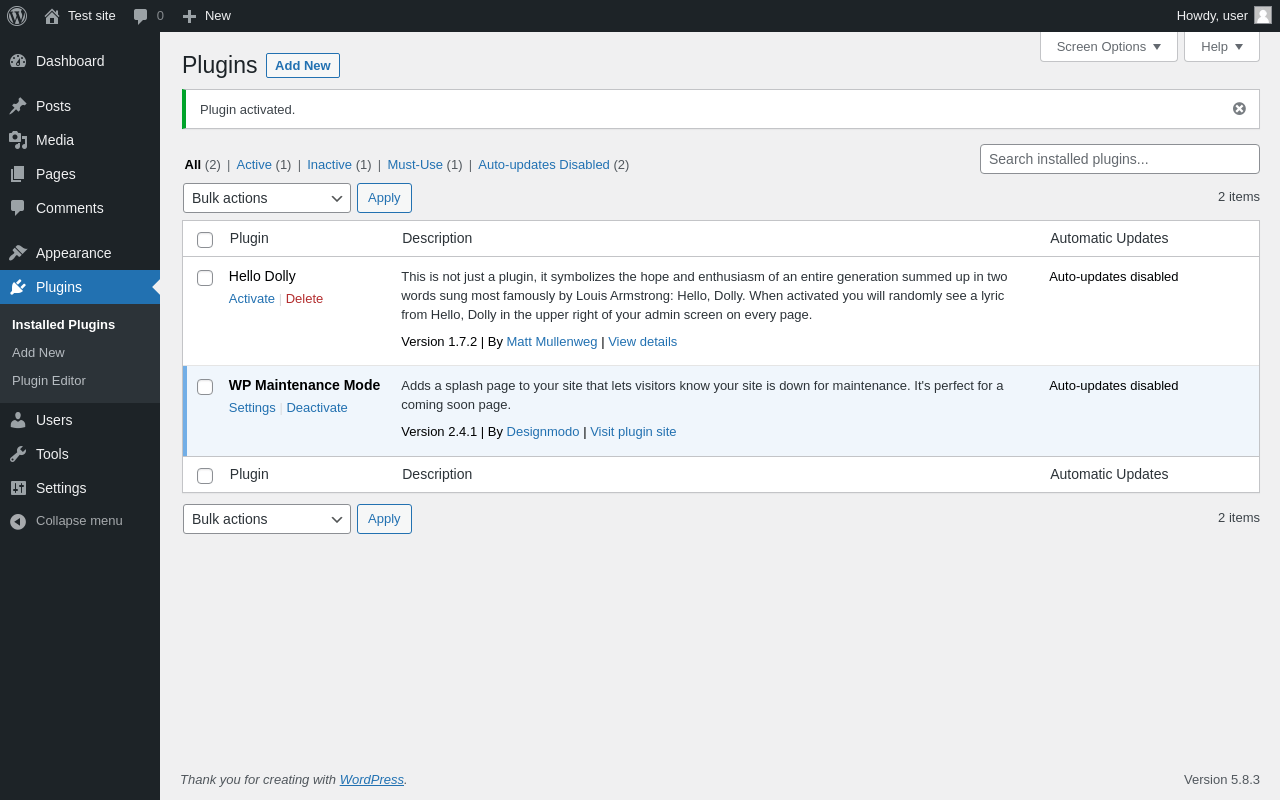
| URL | /wp-admin/plugins.php?plugin_status=all&paged=1&s |
|---|---|
| Requested URL | /wp-admin/plugins.php?action=activate&plugin=wp-maintenance-mode%2Fwp-maintenance-mode.php&plugin_status=all&paged=1&s&_wpnonce=089180214d |
| Aspect | after-activation |
| HTTP status | 200 |
| Load time | 0.409 s |
| Memory usage | 3.11 MiB |
| JS errors | None |
| Resource errors | None |
Settings → WP Maintenance Mode

| URL | /wp-admin/options-general.php?page=wp-maintenance-mode |
|---|---|
| Aspect | menu-item |
| HTTP status | 200 |
| Load time | 1.457 s |
| Memory usage | 3.46 MiB |
| JS errors | None |
| Resource errors | None |
Settings → WP Maintenance Mode → Design

| URL | /wp-admin/options-general.php?page=wp-maintenance-mode |
|---|---|
| Aspect | menu-item-tab |
| HTTP status | 200 |
| Load time | 0.704 s |
| Memory usage | 3.14 MiB |
| JS errors | None |
| Resource errors | None |
Settings → WP Maintenance Mode → Modules
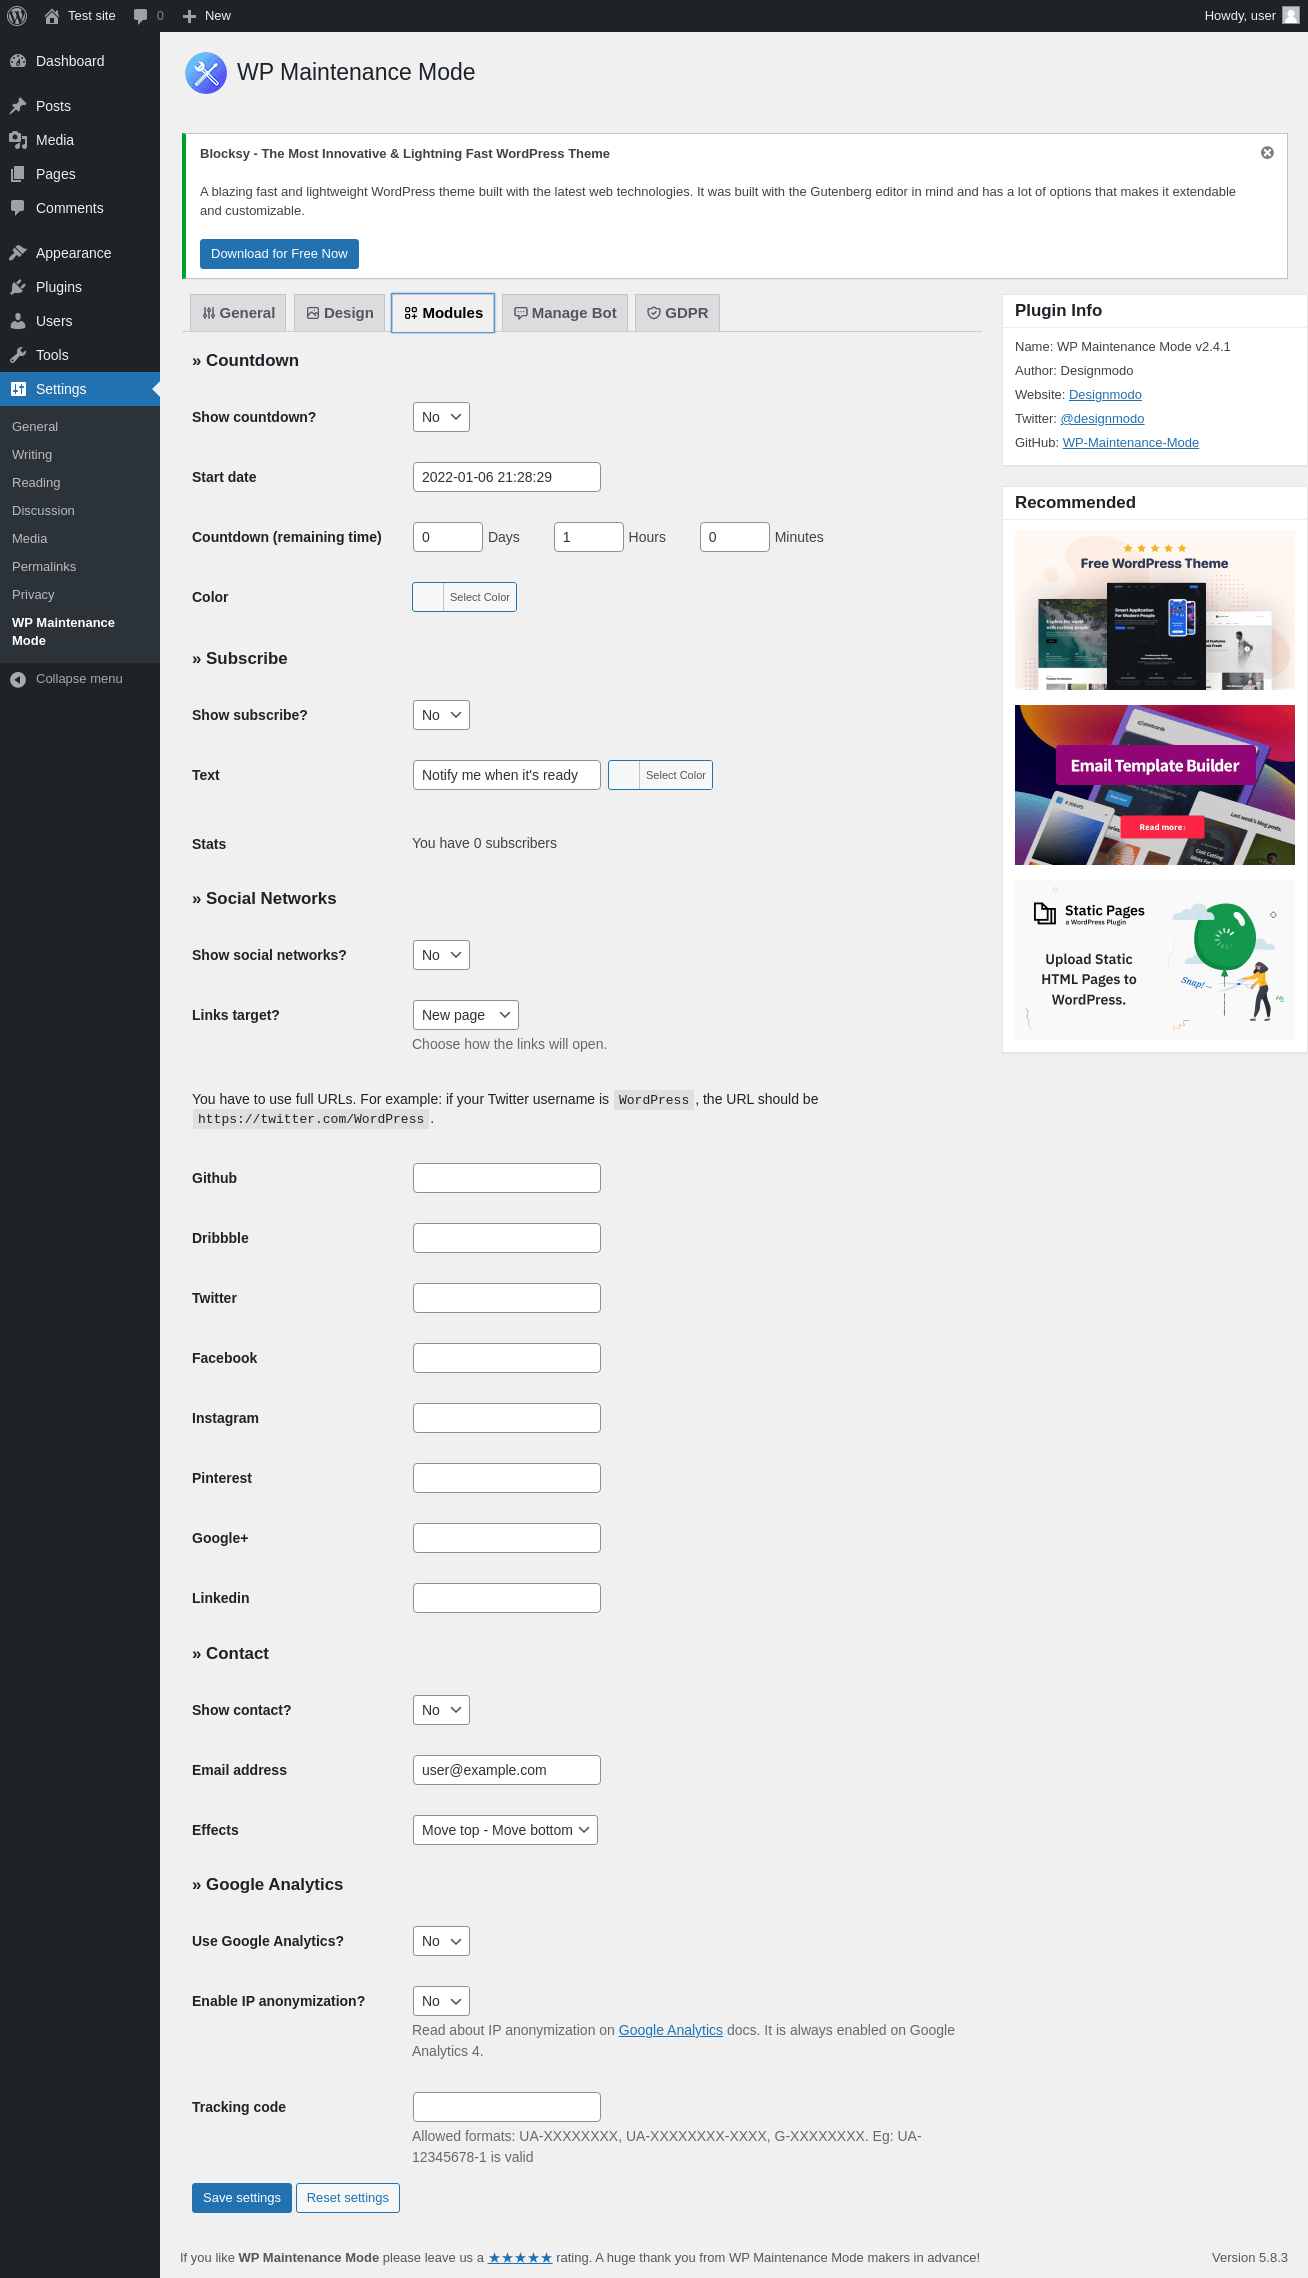
| URL | /wp-admin/options-general.php?page=wp-maintenance-mode |
|---|---|
| Aspect | menu-item-tab |
| HTTP status | 200 |
| Load time | 0.744 s |
| Memory usage | 3.14 MiB |
| JS errors | None |
| Resource errors | None |
Settings → WP Maintenance Mode → Manage Bot
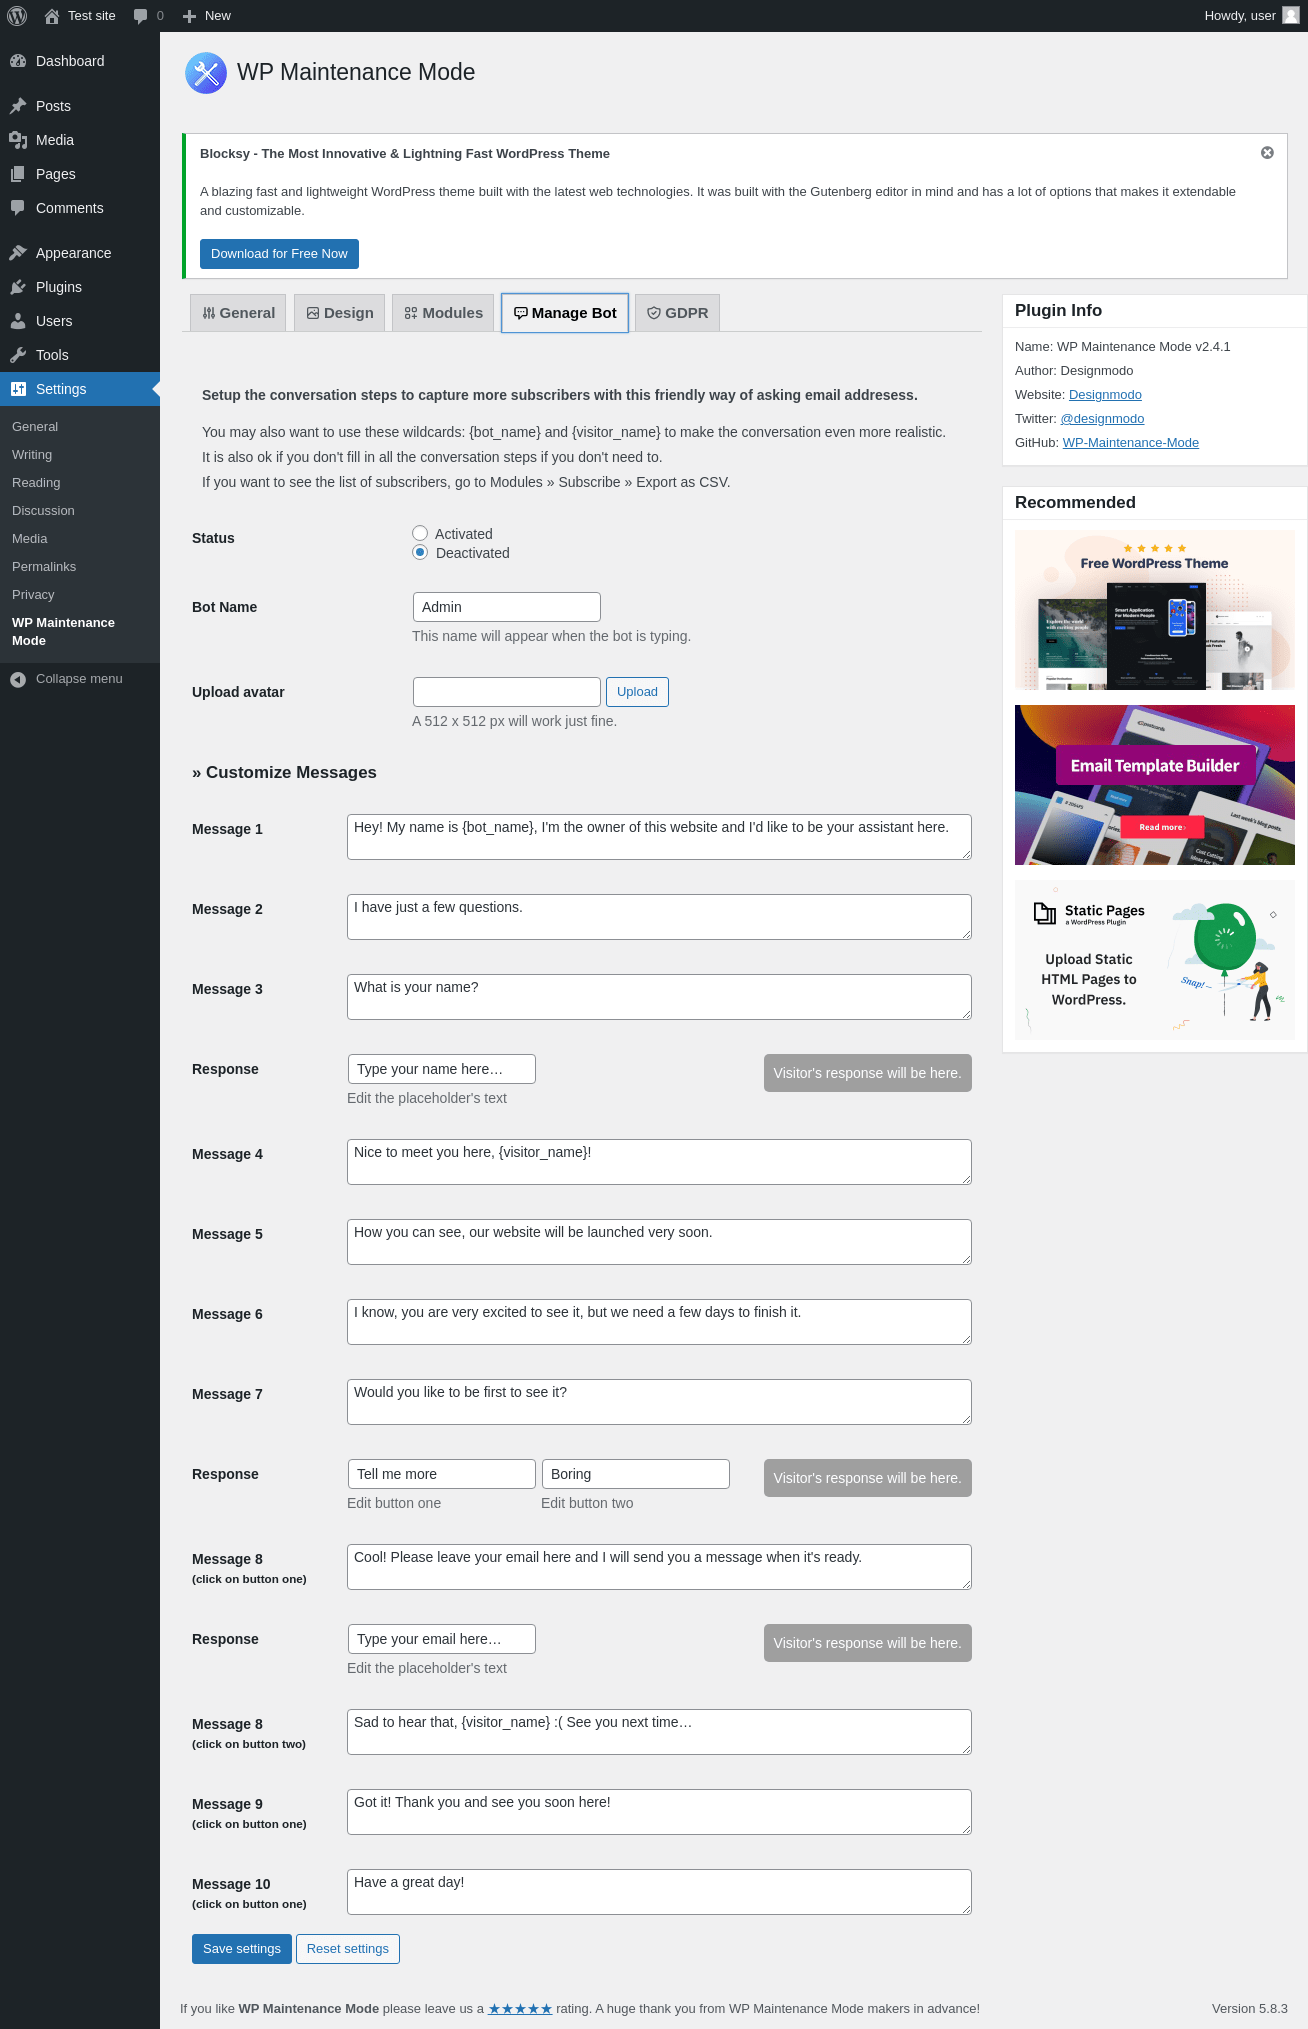
| URL | /wp-admin/options-general.php?page=wp-maintenance-mode |
|---|---|
| Aspect | menu-item-tab |
| HTTP status | 200 |
| Load time | 0.643 s |
| Memory usage | 3.14 MiB |
| JS errors | None |
| Resource errors | None |
Settings → WP Maintenance Mode → GDPR
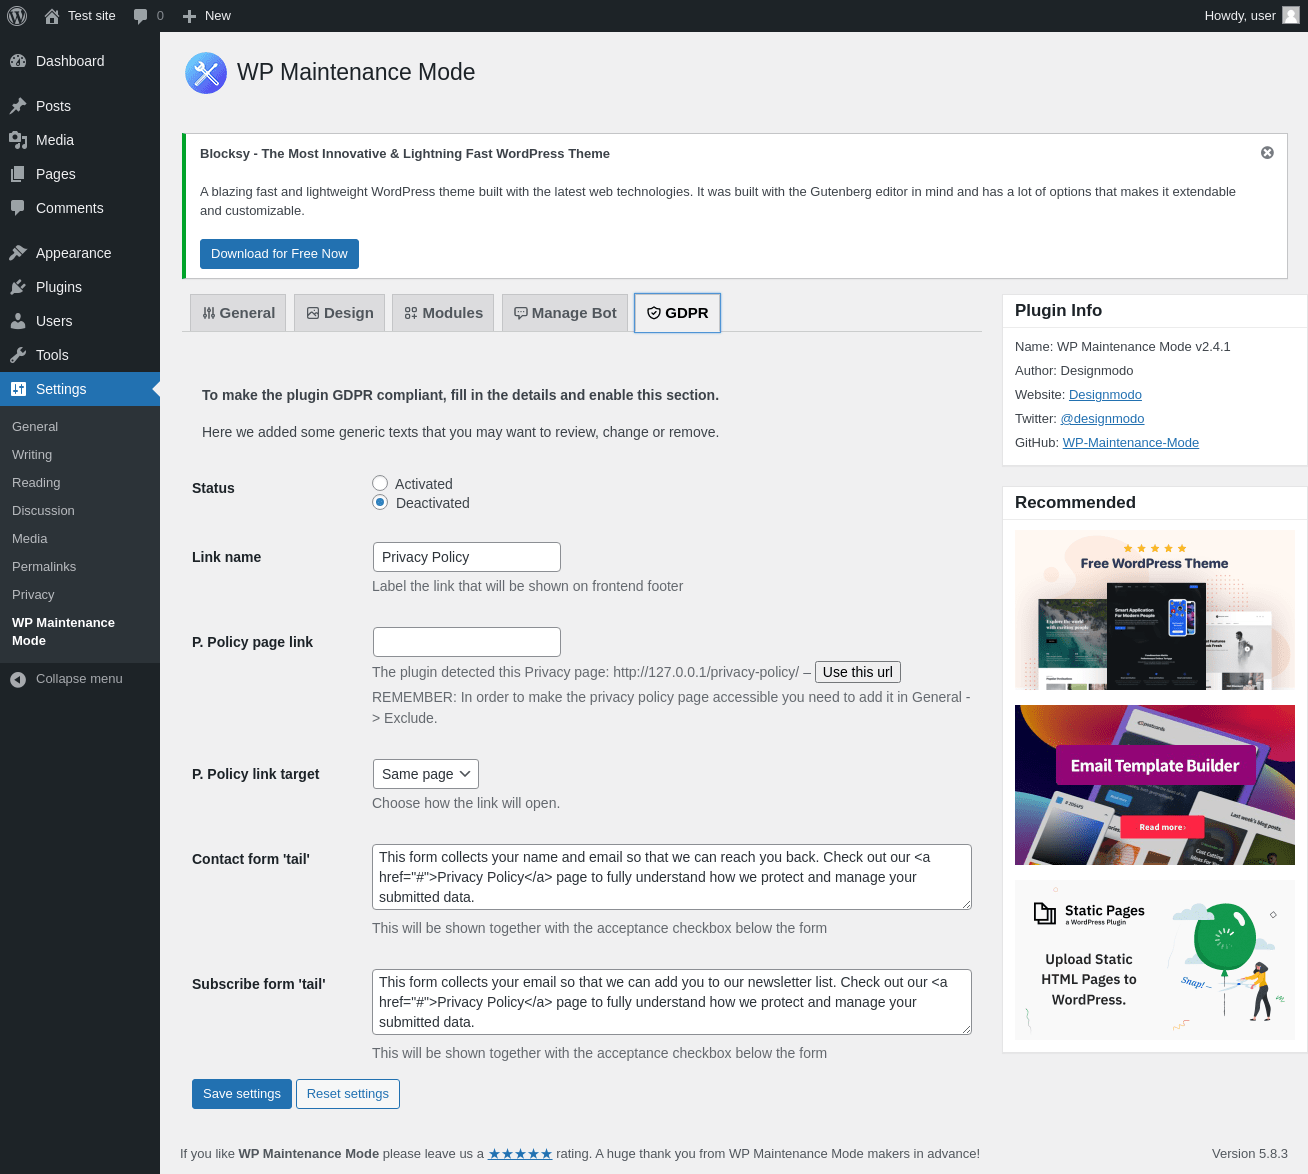
| URL | /wp-admin/options-general.php?page=wp-maintenance-mode |
|---|---|
| Aspect | menu-item-tab |
| HTTP status | 200 |
| Load time | 0.716 s |
| Memory usage | 3.14 MiB |
| JS errors | None |
| Resource errors | None |
Test site – Just another WordPress site
| URL | / |
|---|---|
| Aspect | front-page |
| HTTP status | 200 |
| Load time | 0.216 s |
| Memory usage | 2.94 MiB |
| JS errors | None |
| Resource errors | None |
Benchmark
| URL | Load time | Memory usage | ||||
|---|---|---|---|---|---|---|
| Inactive | Active | Change | Inactive | Active | Change | |
| /wp-admin/index.php | 0.307 s | 0.327 s | +0.020 s | 3.08 MiB | 3.16 MiB | + 81.2 KiB |
| /wp-admin/edit.php | 0.191 s | 0.205 s | +0.014 s | 3.11 MiB | 3.23 MiB | + 119.01 KiB |
| /wp-admin/post-new.php | 0.743 s | 0.913 s | +0.170 s | 5.27 MiB | 5.32 MiB | + 58.27 KiB |
| /wp-admin/upload.php | 0.375 s | 0.451 s | +0.076 s | 3.03 MiB | 3.08 MiB | + 53.43 KiB |
| /wp-admin/options-writing.php | 0.146 s | 0.161 s | +0.015 s | 3.02 MiB | 3.06 MiB | + 36.78 KiB |
| /wp-admin/media-new.php | 0.453 s | 0.206 s | -0.247 s | 3.01 MiB | 3.06 MiB | + 53.6 KiB |
| /wp-admin/edit-tags.php?taxonomy=category | 0.203 s | 0.184 s | -0.019 s | 3.04 MiB | 3.09 MiB | + 55.13 KiB |
| /wp-admin/post-new.php?post_type=page | 0.991 s | 0.642 s | -0.349 s | 5.26 MiB | 5.31 MiB | + 58.27 KiB |
| /wp-admin/options-discussion.php | 0.241 s | 0.224 s | -0.017 s | 3 MiB | 3.05 MiB | + 53.23 KiB |
| /wp-admin/edit-comments.php | 0.205 s | 0.184 s | -0.021 s | 3.04 MiB | 3.09 MiB | + 52.76 KiB |
| / | 0.352 s | 0.190 s | -0.162 s | 2.96 MiB | 2.94 MiB | - 19.1 KiB |
| Average | 0.382 s | 0.335 s | -0.047 s | 3.44 MiB | 3.49 MiB | + 54.78 KiB |
Code Statistics
Note: Third-party libraries and minified JS/CSS files are excluded from these statistics where possible, so the numbers you see here may be lower than those reported by other tools.
| Language | % | Lines of code | Comment lines | Files | |
|---|---|---|---|---|---|
| PO File | 52.1% | 8,442 | 3,938 | 15 | |
| JavaScript | 22.0% | 3,557 | 647 | 9 | |
| PHP | 17.1% | 2,770 | 769 | 17 | |
| CSS | 8.8% | 1,430 | 118 | 5 | |
| SVG | 0.0% | 1 | 0 | 1 | |
| Total | 16,200 | 5,472 | 47 | ||
PHP Code Analysis | More results »
| Lines of code | 1,511 |
|---|---|
| Total complexity | 380 |
| Median class complexity | 58.5 |
| Median method complexity | 3.0 |
| Most complex class | WP_Maintenance_Mode |
| Most complex function | WP_Maintenance_Mode::single_activate() |
| Classes | 4 |
|---|---|
| Methods | 52 |
| Functions | 24 |
Additions
Things that the plugin adds to the site. This section is not intended to be comprehensive. The test tool only looks for a few specific types of added content.
Database Tables 1
- wp_wpmm_subscribers
Options wp_options 2
- wpmm_settings
- wpmm_version
PHP Error Log 10 lines
[06-Jan-2022 21:28:41 UTC] PHP Notice:  Undefined index: host in /wp-includes/canonical.php on line 687
[06-Jan-2022 21:28:41 UTC] PHP Notice:  Undefined index: host in /wp-includes/canonical.php on line 688
[06-Jan-2022 21:28:41 UTC] PHP Notice:  Undefined index: host in /wp-includes/canonical.php on line 696
[06-Jan-2022 21:28:41 UTC] PHP Notice:  Undefined index: host in /wp-includes/canonical.php on line 699
[06-Jan-2022 21:28:41 UTC] PHP Notice:  Undefined index: scheme in /wp-includes/canonical.php on line 720