wp Hosting Performance Check 2.18.2
Does wp Hosting Performance Check work with WordPress 4.9.8 and PHP 7.0.16? A smoke test was performed on .
Summary
Errors
| 1 | PHP warnings |
| 1 | PHP notices |
| 1 | JavaScript exceptions |
| All test pages loaded successfully | |
| No resource errors |
Performance
Memory usage: 49.1 KiB
The average PHP memory usage increased by this amount after activating by the plugin.
Page speed impact:
insignificant.
The plugin didn't make the site noticeably slower.
Environment
| WordPress version | 4.9.8 |
|---|---|
| PHP version | 7.0.16 |
| MySQL version | 5.7.17 |
| PHP memory limit | 256M |
Plugin Info
| Last updated | |
|---|---|
| Active installs | 1,000+ |
| WordPress.org page | https://wordpress.org/plugins/wp-hosting-performance-check/ |
| Badges |
|
Pages 12
Plugins ‹ Test site — WordPress
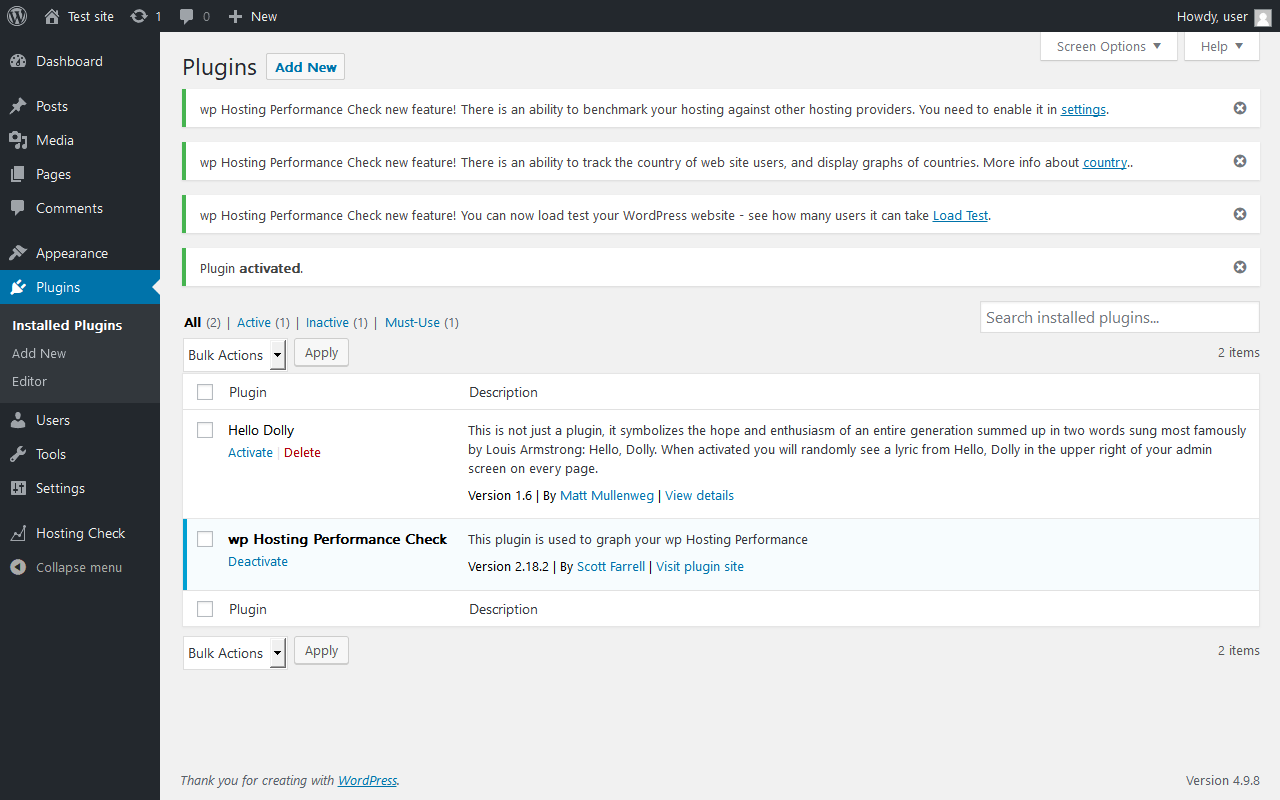
| URL | /wp-admin/plugins.php?activate=true&plugin_status=all&paged=1&s= |
|---|---|
| Requested URL | /wp-admin/plugins.php?action=activate&plugin=wp-hosting-performance-check%2Fwp_host_check.php&plugin_status=all&paged=1&s&_wpnonce=45bdb009e8 |
| Aspect | after-activation |
| HTTP status | 200 OK |
| Load time | 0.109 s |
| Memory usage | 3.11 MiB |
| JS errors | None |
| Resource errors | None |
Hosting Check
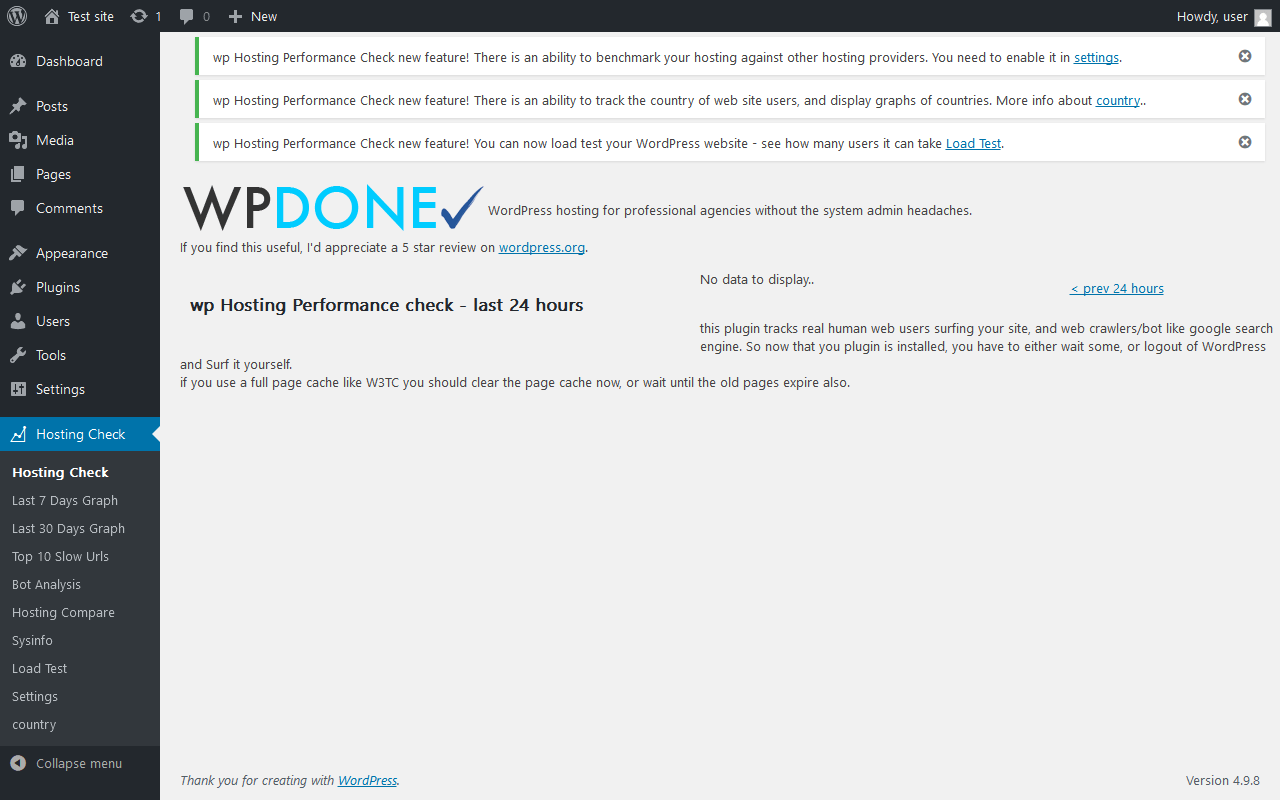
| URL | /wp-admin/admin.php?page=wphpc_graphs |
|---|---|
| Aspect | menu-item |
| HTTP status | 200 OK |
| Load time | 0.040 s |
| Memory usage | 3.13 MiB |
| JS errors | None |
| Resource errors | None |
Hosting Check → Last 7 Days Graph
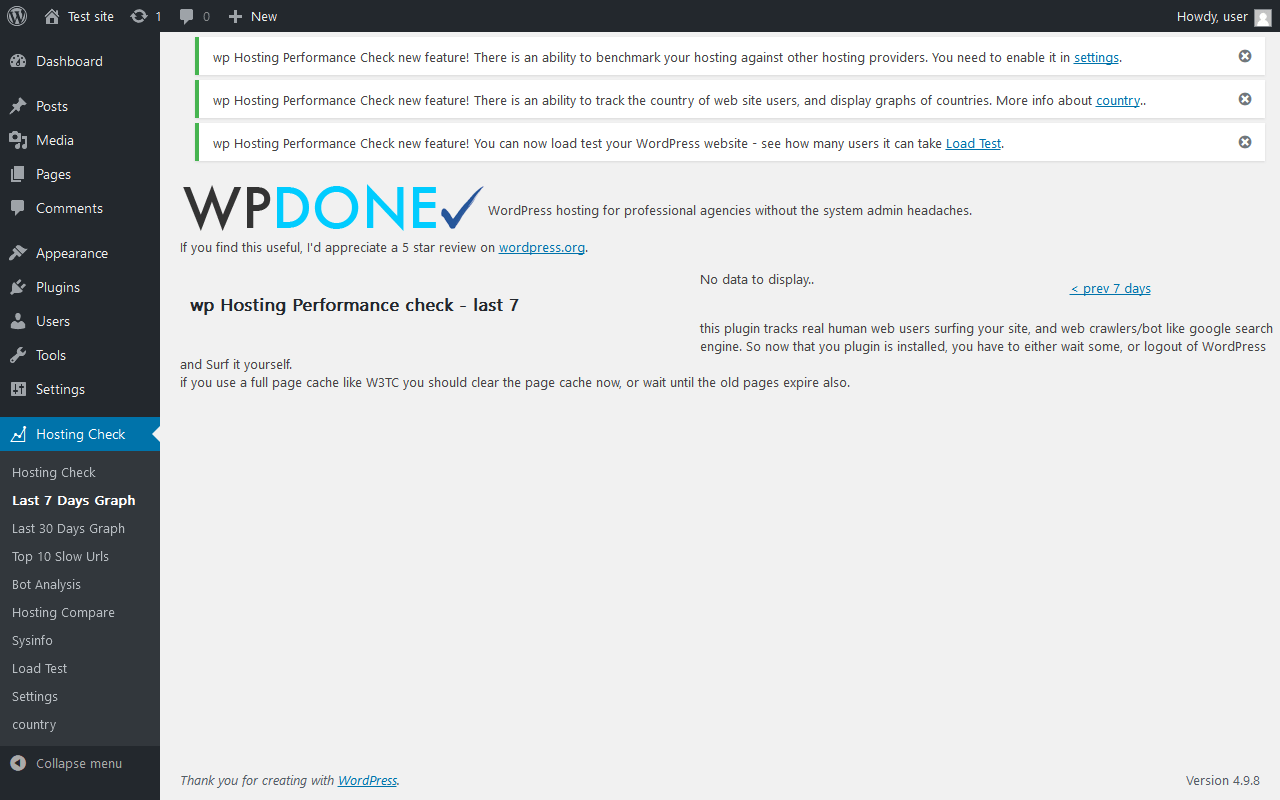
| URL | /wp-admin/admin.php?page=7daysgraph |
|---|---|
| Aspect | menu-item |
| HTTP status | 200 OK |
| Load time | 0.044 s |
| Memory usage | 3.01 MiB |
| JS errors | None |
| Resource errors | None |
Hosting Check → Last 30 Days Graph

| URL | /wp-admin/admin.php?page=30daysgraph |
|---|---|
| Aspect | menu-item |
| HTTP status | 200 OK |
| Load time | 0.070 s |
| Memory usage | 3.01 MiB |
| JS errors | None |
| Resource errors | None |
Hosting Check → Top 10 Slow Urls
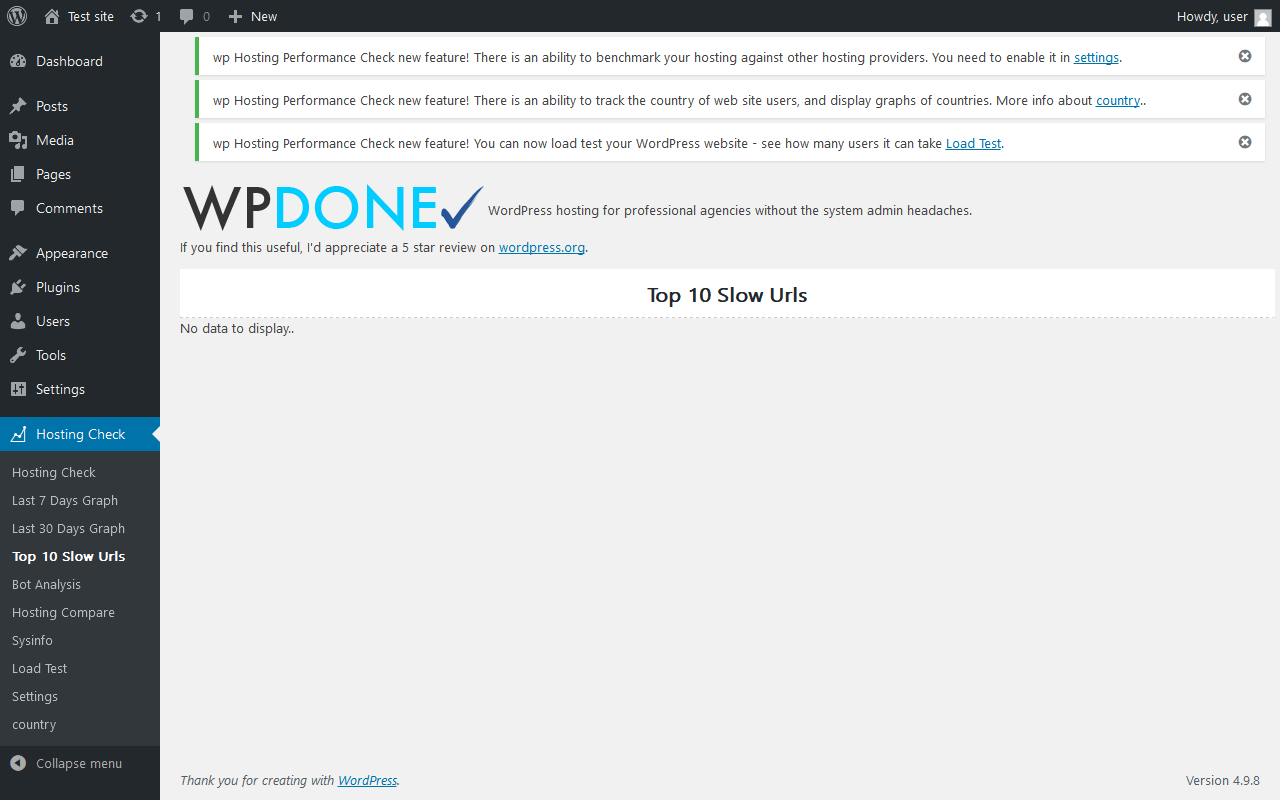
| URL | /wp-admin/admin.php?page=wphpc_slowurls |
|---|---|
| Aspect | menu-item |
| HTTP status | 200 OK |
| Load time | 0.043 s |
| Memory usage | 3.13 MiB |
| JS errors | None |
| Resource errors | None |
Hosting Check → Bot Analysis
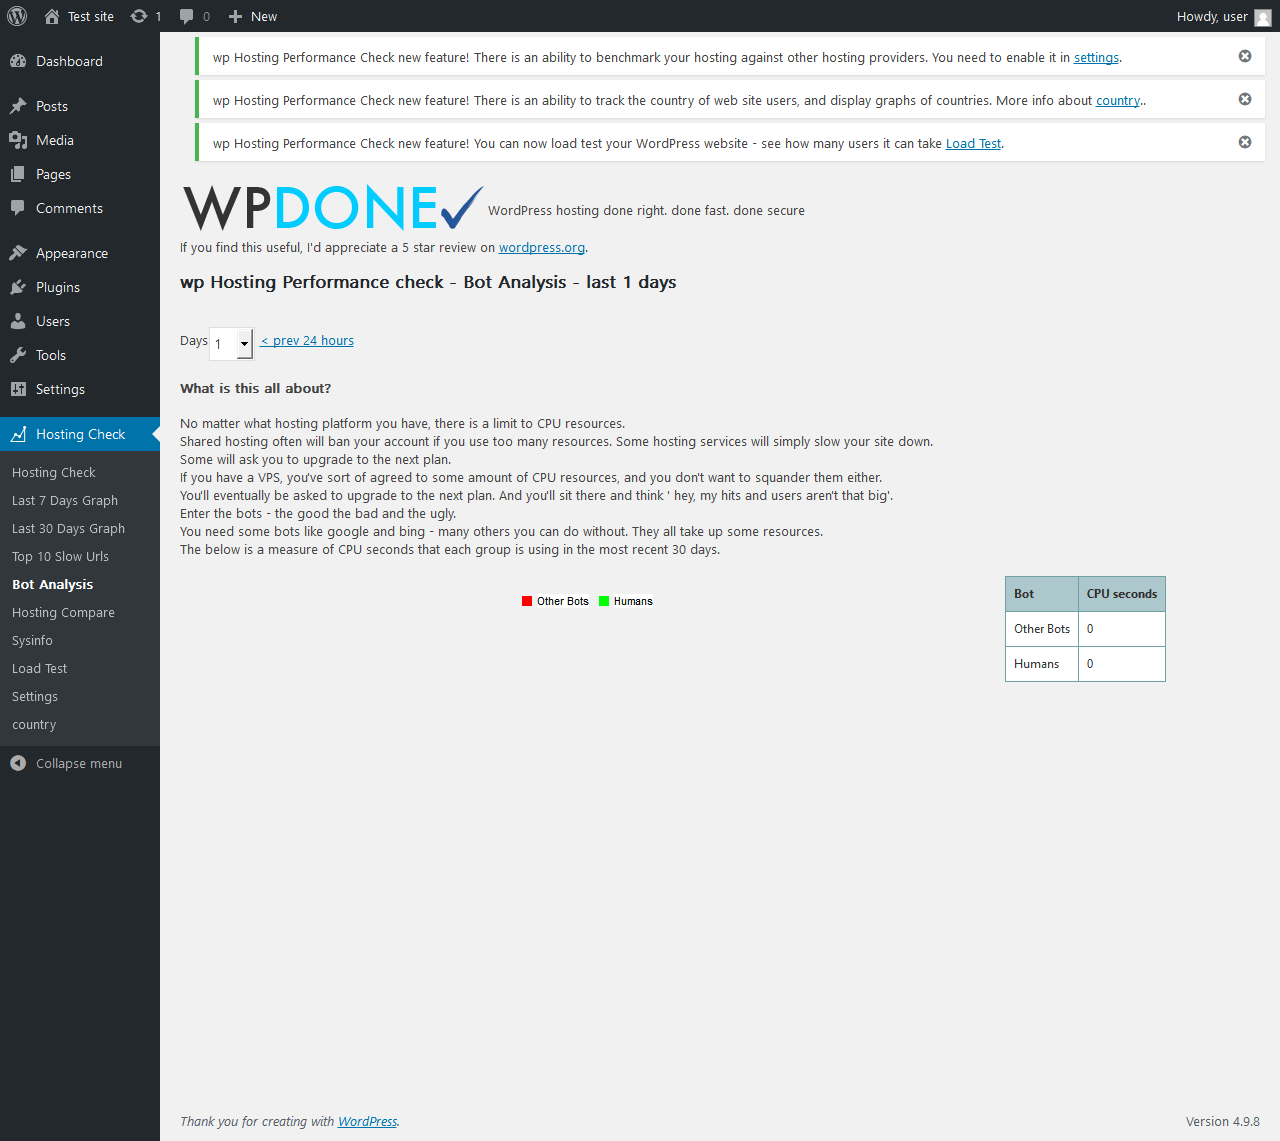
| URL | /wp-admin/admin.php?page=wphpc_page_bots |
|---|---|
| Aspect | menu-item |
| HTTP status | 200 OK |
| Load time | 0.048 s |
| Memory usage | 3.14 MiB |
| JS errors | None |
| Resource errors | None |
Hosting Check → Hosting Compare
| URL | /wp-admin/admin.php?page=wphpc_compare |
|---|---|
| Aspect | menu-item |
| HTTP status | 200 OK |
| Load time | 0.075 s |
| Memory usage | 3.14 MiB |
| JS errors | None |
| Resource errors | None |
Hosting Check → Sysinfo
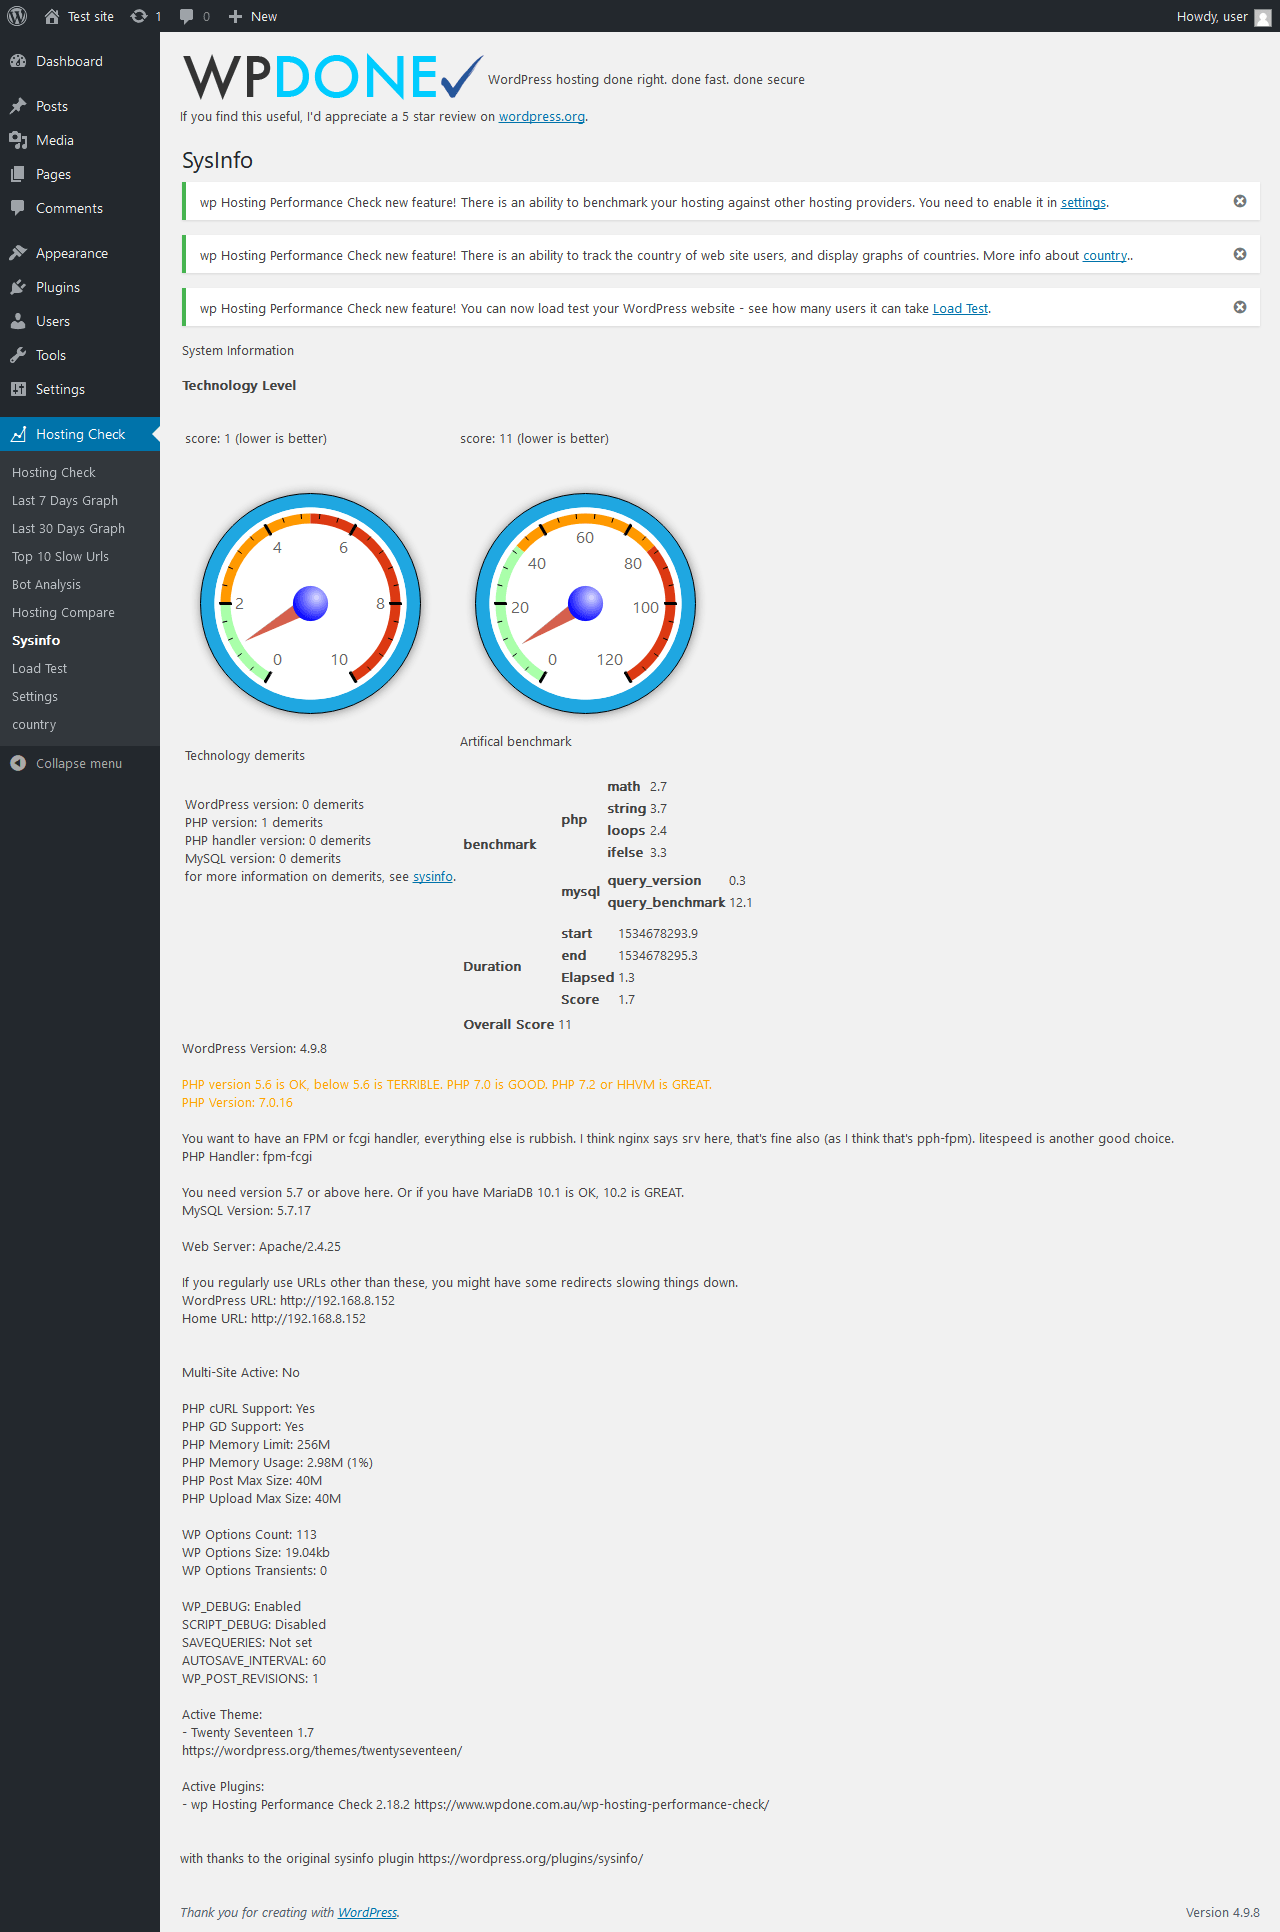
| URL | /wp-admin/admin.php?page=wphpc_sysinfo |
|---|---|
| Aspect | menu-item |
| HTTP status | 200 OK |
| Load time | 1.349 s |
| Memory usage | 3.28 MiB |
| JS errors | None |
| Resource errors | None |
Hosting Check → Load Test
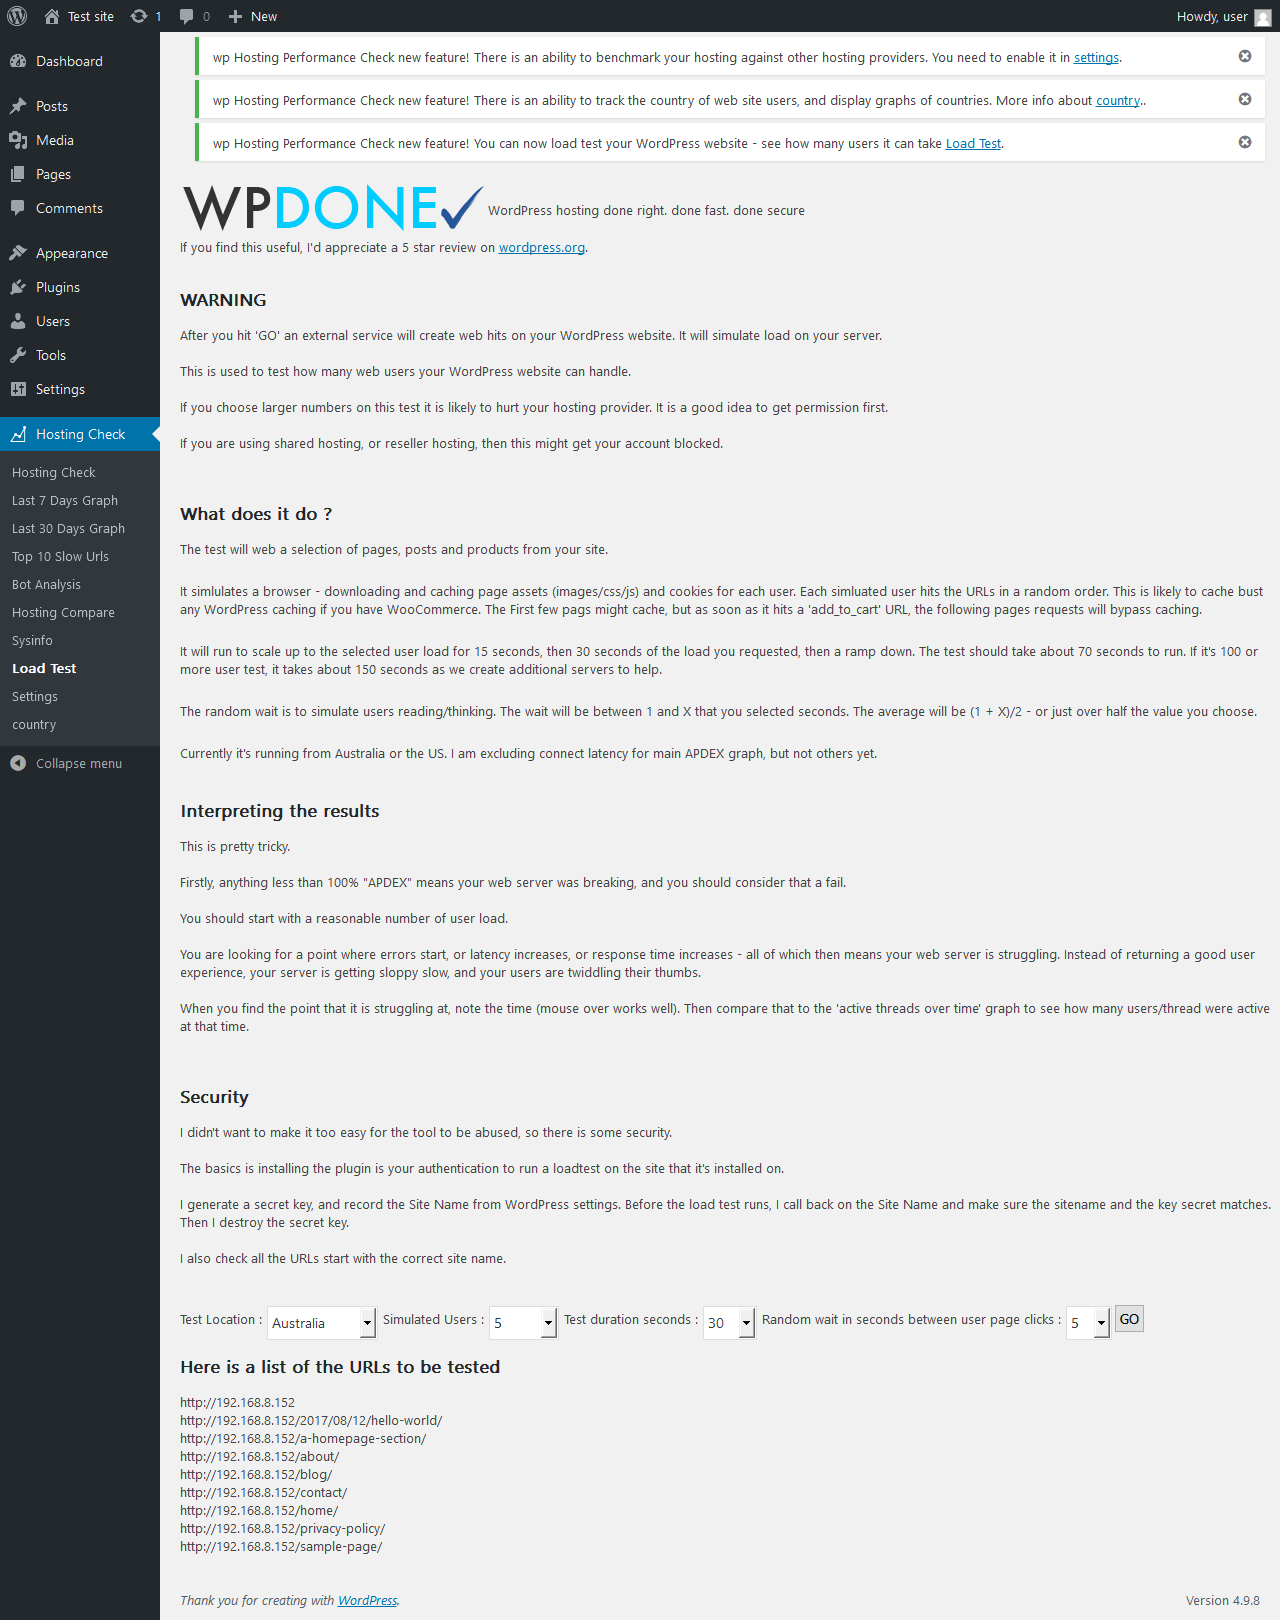
| URL | /wp-admin/admin.php?page=wphpc_loadtest_page |
|---|---|
| Aspect | menu-item |
| HTTP status | 200 OK |
| Load time | 0.095 s |
| Memory usage | 3.16 MiB |
| JS errors | None |
| Resource errors | None |
Hosting Check → Settings
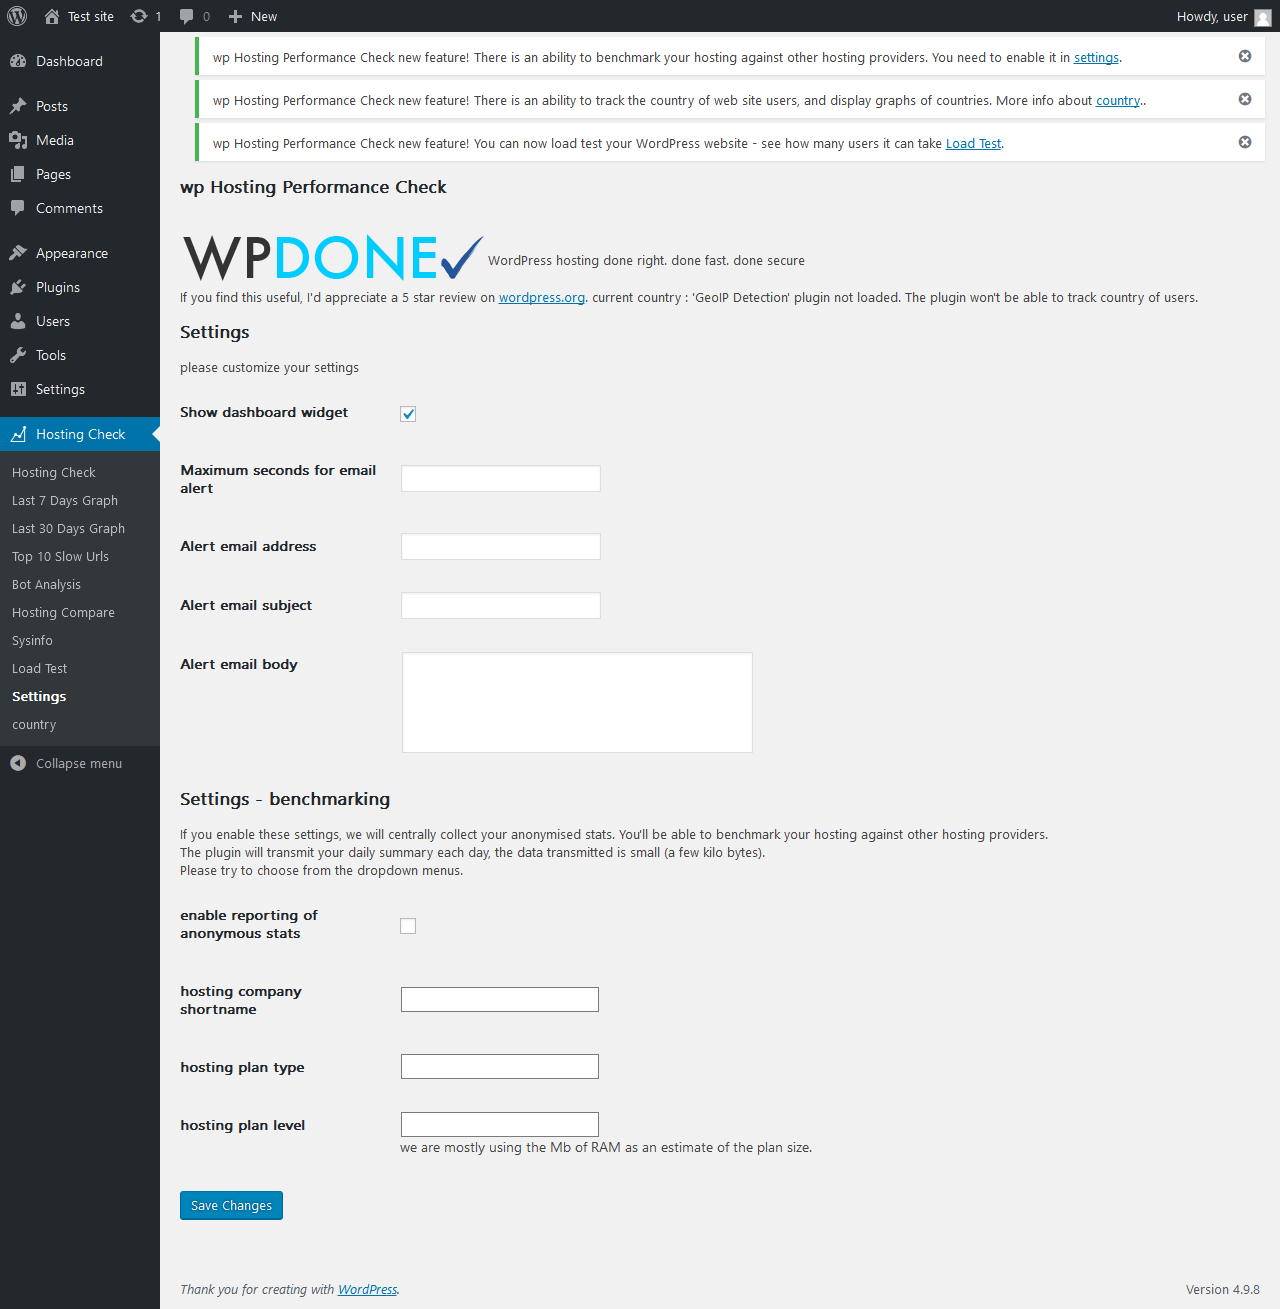
| URL | /wp-admin/admin.php?page=wphpc_settings |
|---|---|
| Aspect | menu-item |
| HTTP status | 200 OK |
| Load time | 0.039 s |
| Memory usage | 3.01 MiB |
| JS errors | None |
| Resource errors | None |
Hosting Check → country
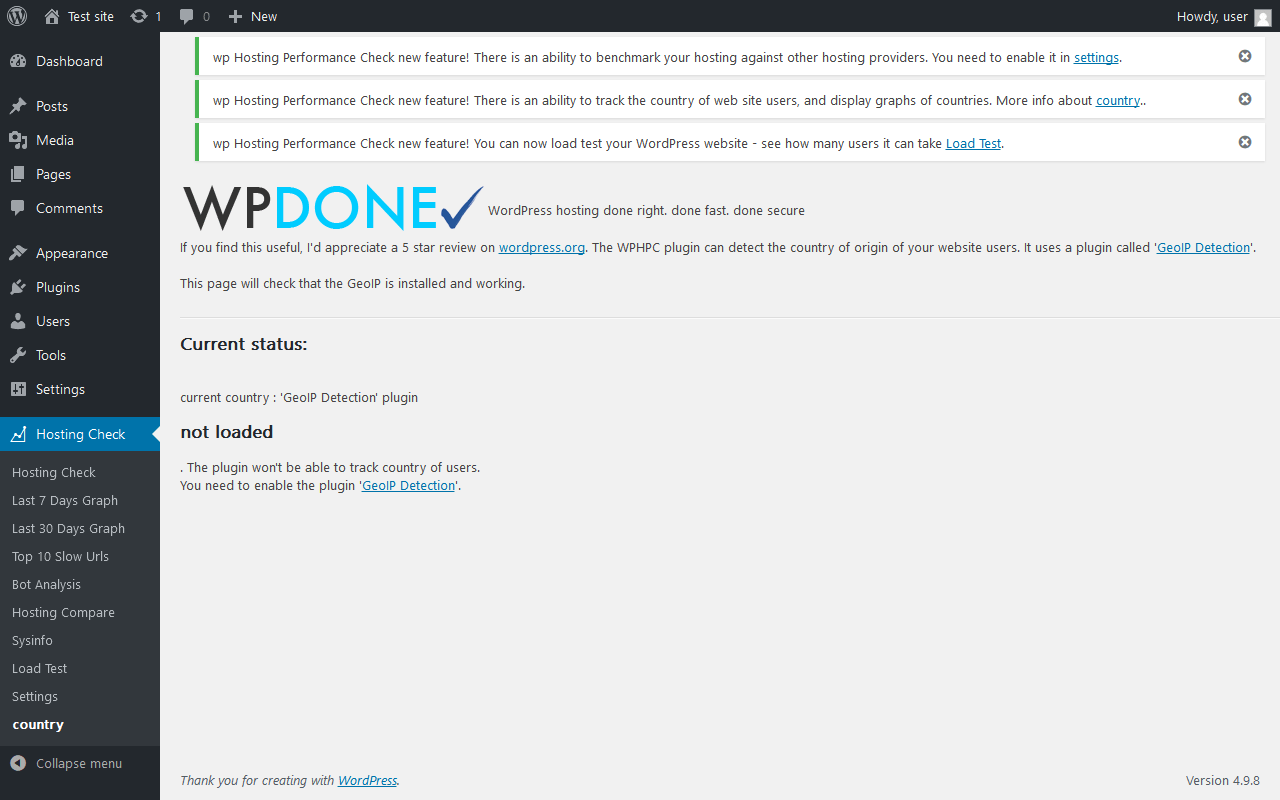
| URL | /wp-admin/admin.php?page=wphpc_country |
|---|---|
| Aspect | menu-item |
| HTTP status | 200 OK |
| Load time | 0.070 s |
| Memory usage | 3.11 MiB |
| JS errors | None |
| Resource errors | None |
Test site – Just another WordPress site
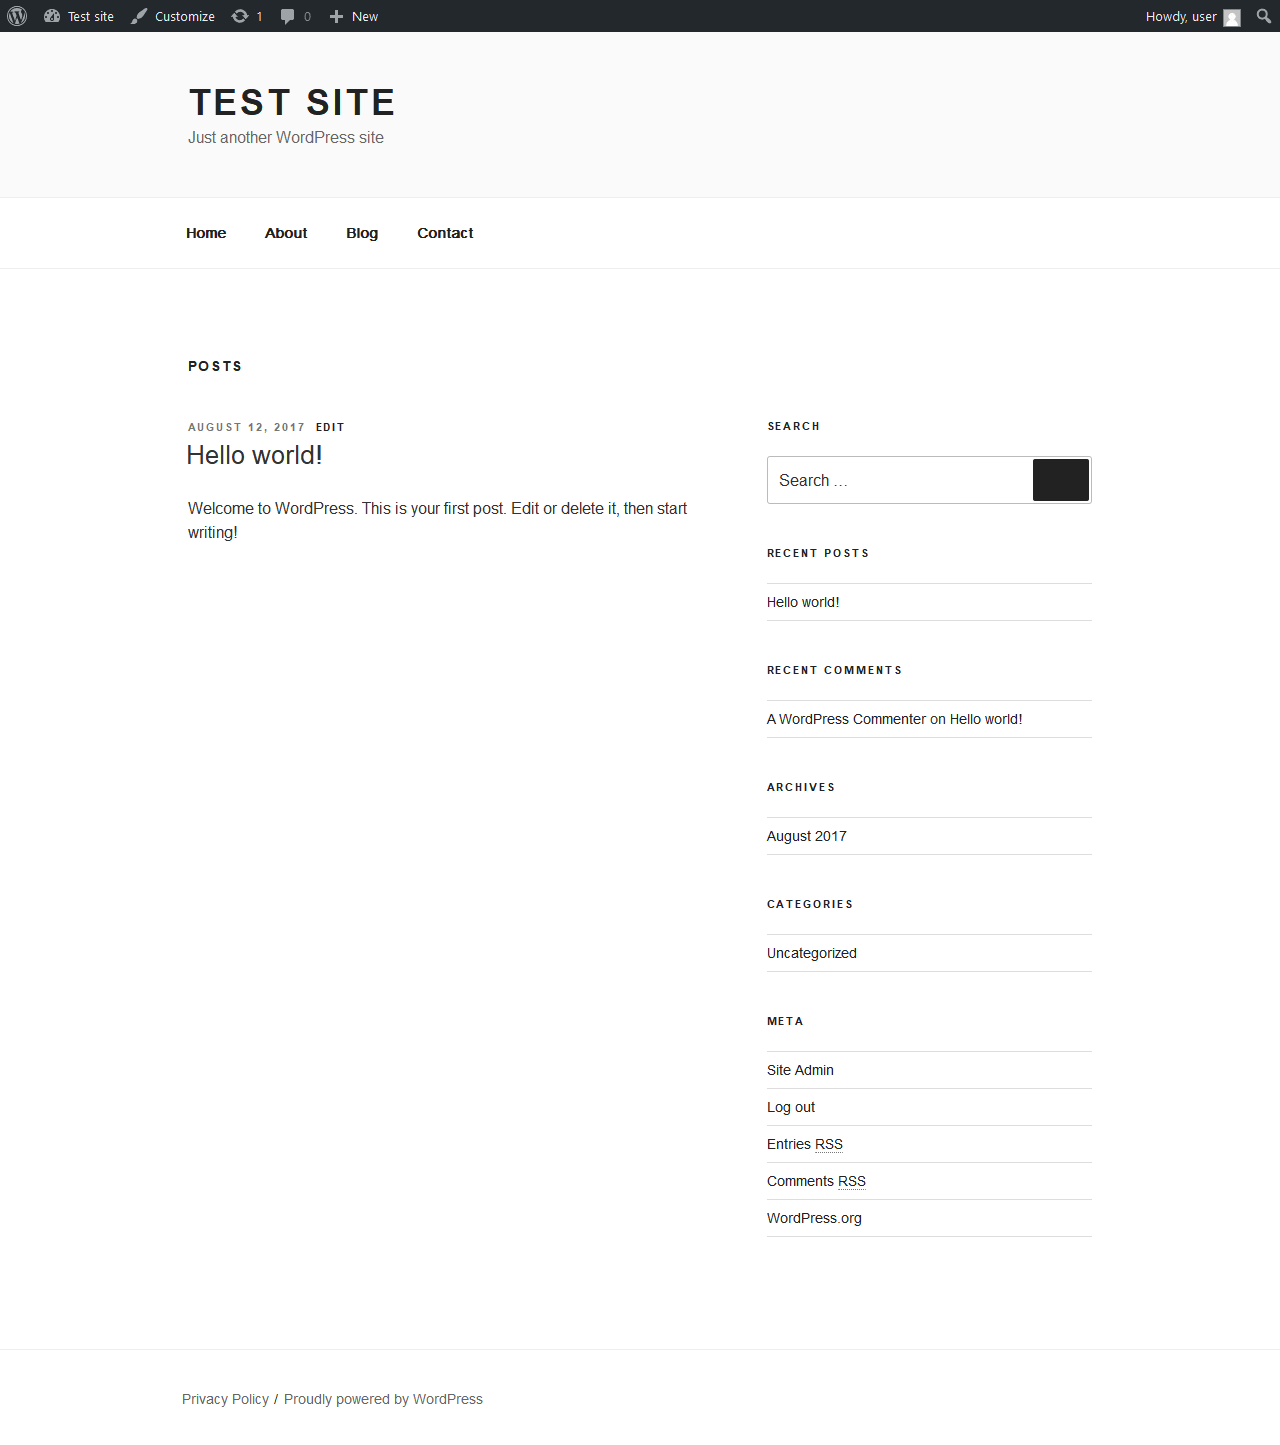
| URL | / |
|---|---|
| Aspect | front-page |
| HTTP status | 200 OK |
| Load time | 0.079 s |
| Memory usage | 2.82 MiB |
| JS errors | |
| Resource errors | None |
Benchmark
| URL | Load time | Memory usage | ||||
|---|---|---|---|---|---|---|
| Inactive | Active | Change | Inactive | Active | Change | |
| /wp-admin/index.php | 0.229 s | 0.056 s | -0.173 s | 3.12 MiB | 3.17 MiB | + 50.73 KiB |
| /wp-admin/edit.php | 0.095 s | 0.095 s | +0.000 s | 3.14 MiB | 3.19 MiB | + 48.21 KiB |
| /wp-admin/post-new.php | 0.230 s | 0.196 s | -0.034 s | 3.21 MiB | 3.27 MiB | + 65.06 KiB |
| /wp-admin/upload.php | 0.103 s | 0.048 s | -0.055 s | 2.98 MiB | 3.02 MiB | + 46.66 KiB |
| /wp-admin/options-writing.php | 0.110 s | 0.109 s | -0.001 s | 3.06 MiB | 3.02 MiB | - 42.8 KiB |
| /wp-admin/media-new.php | 0.048 s | 0.103 s | +0.055 s | 2.96 MiB | 3.01 MiB | + 49.08 KiB |
| /wp-admin/edit-tags.php?taxonomy=category | 0.092 s | 0.090 s | -0.002 s | 3 MiB | 3.11 MiB | + 113.36 KiB |
| /wp-admin/post-new.php?post_type=page | 0.192 s | 0.154 s | -0.038 s | 3.21 MiB | 3.27 MiB | + 57.8 KiB |
| /wp-admin/options-discussion.php | 0.090 s | 0.036 s | -0.054 s | 2.97 MiB | 3.01 MiB | + 49.03 KiB |
| /wp-admin/edit-comments.php | 0.098 s | 0.105 s | +0.007 s | 3.01 MiB | 3.12 MiB | + 112.3 KiB |
| / | 0.102 s | 0.126 s | +0.024 s | 2.83 MiB | 2.82 MiB | - 9.33 KiB |
| Average | 0.126 s | 0.102 s | -0.025 s | 3.04 MiB | 3.09 MiB | + 49.1 KiB |
Additions
Things that the plugin adds to the site. This section is not intended to be comprehensive. The test tool only looks for a few specific types of added content.
Database Tables 1
- wp_webpages_data
Options wp_options 1
- wphpc_loadtest_key
PHP Error Log 2 lines
[19-Aug-2018 11:31:32 UTC] PHP Notice:  Undefined variable: country in /wp-content/plugins/wp-hosting-performance-check/top10.php on line 25
[19-Aug-2018 11:31:37 UTC] PHP Warning:  call_user_func_array() expects parameter 1 to be a valid callback, class 'wphpc_PAnD' not found in /wp-includes/class-wp-hook.php on line 286
See also: All tests for this plugin