Analytify Dashboard 7.1.3
Does Analytify Dashboard work with WordPress 6.9 and PHP 8.1.12? A smoke test was performed on .
Summary
| 4 | PHP deprecation warnings |
| No JavaScript exceptions | |
| All test pages loaded successfully | |
| No resource errors |
Memory usage: 255.35 KiB
The average PHP memory usage increased by this amount after activating by the plugin.
Page speed impact:
insignificant.
The plugin didn't make the site noticeably slower.
| WordPress version | 6.9 |
|---|---|
| PHP version | 8.1.12 |
| MySQL version | 10.6.10 |
| PHP memory limit | 512M |
| Last updated | |
|---|---|
| Active installs | 30,000+ |
| WordPress.org page | https://wordpress.org/plugins/wp-analytify/ |
| Badges |
|
Pages 13
Plugins ‹ Test site — WordPress
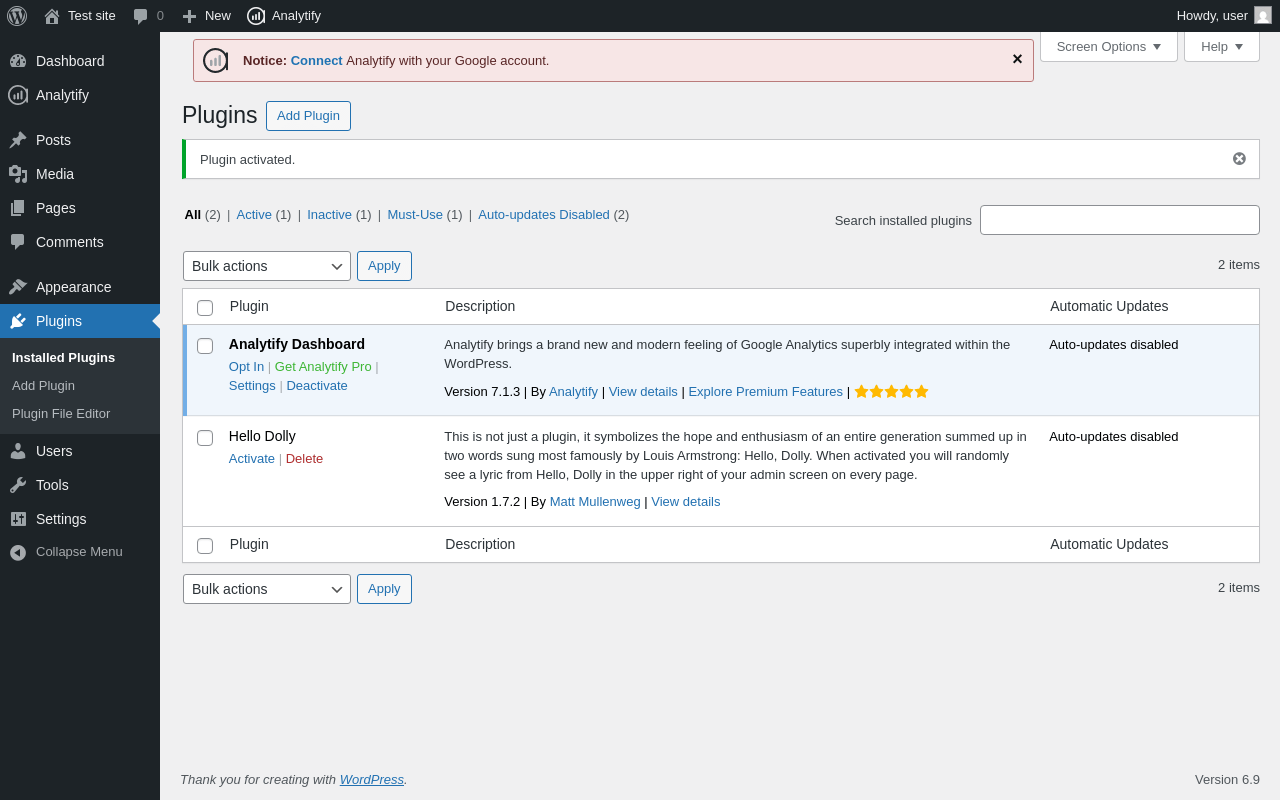
| URL | /wp-admin/plugins.php?plugin_status=all&paged=1&s |
|---|---|
| Requested URL | /wp-admin/plugins.php?action=activate&plugin=wp-analytify%2Fwp-analytify.php&plugin_status=all&paged=1&s&_wpnonce=072d23b139 |
| Aspect | after-activation |
| HTTP status | 200 |
| Load time | 0.396 s |
| Memory usage | 4.09 MiB |
| JS errors | None |
| Resource errors | None |
Analytify
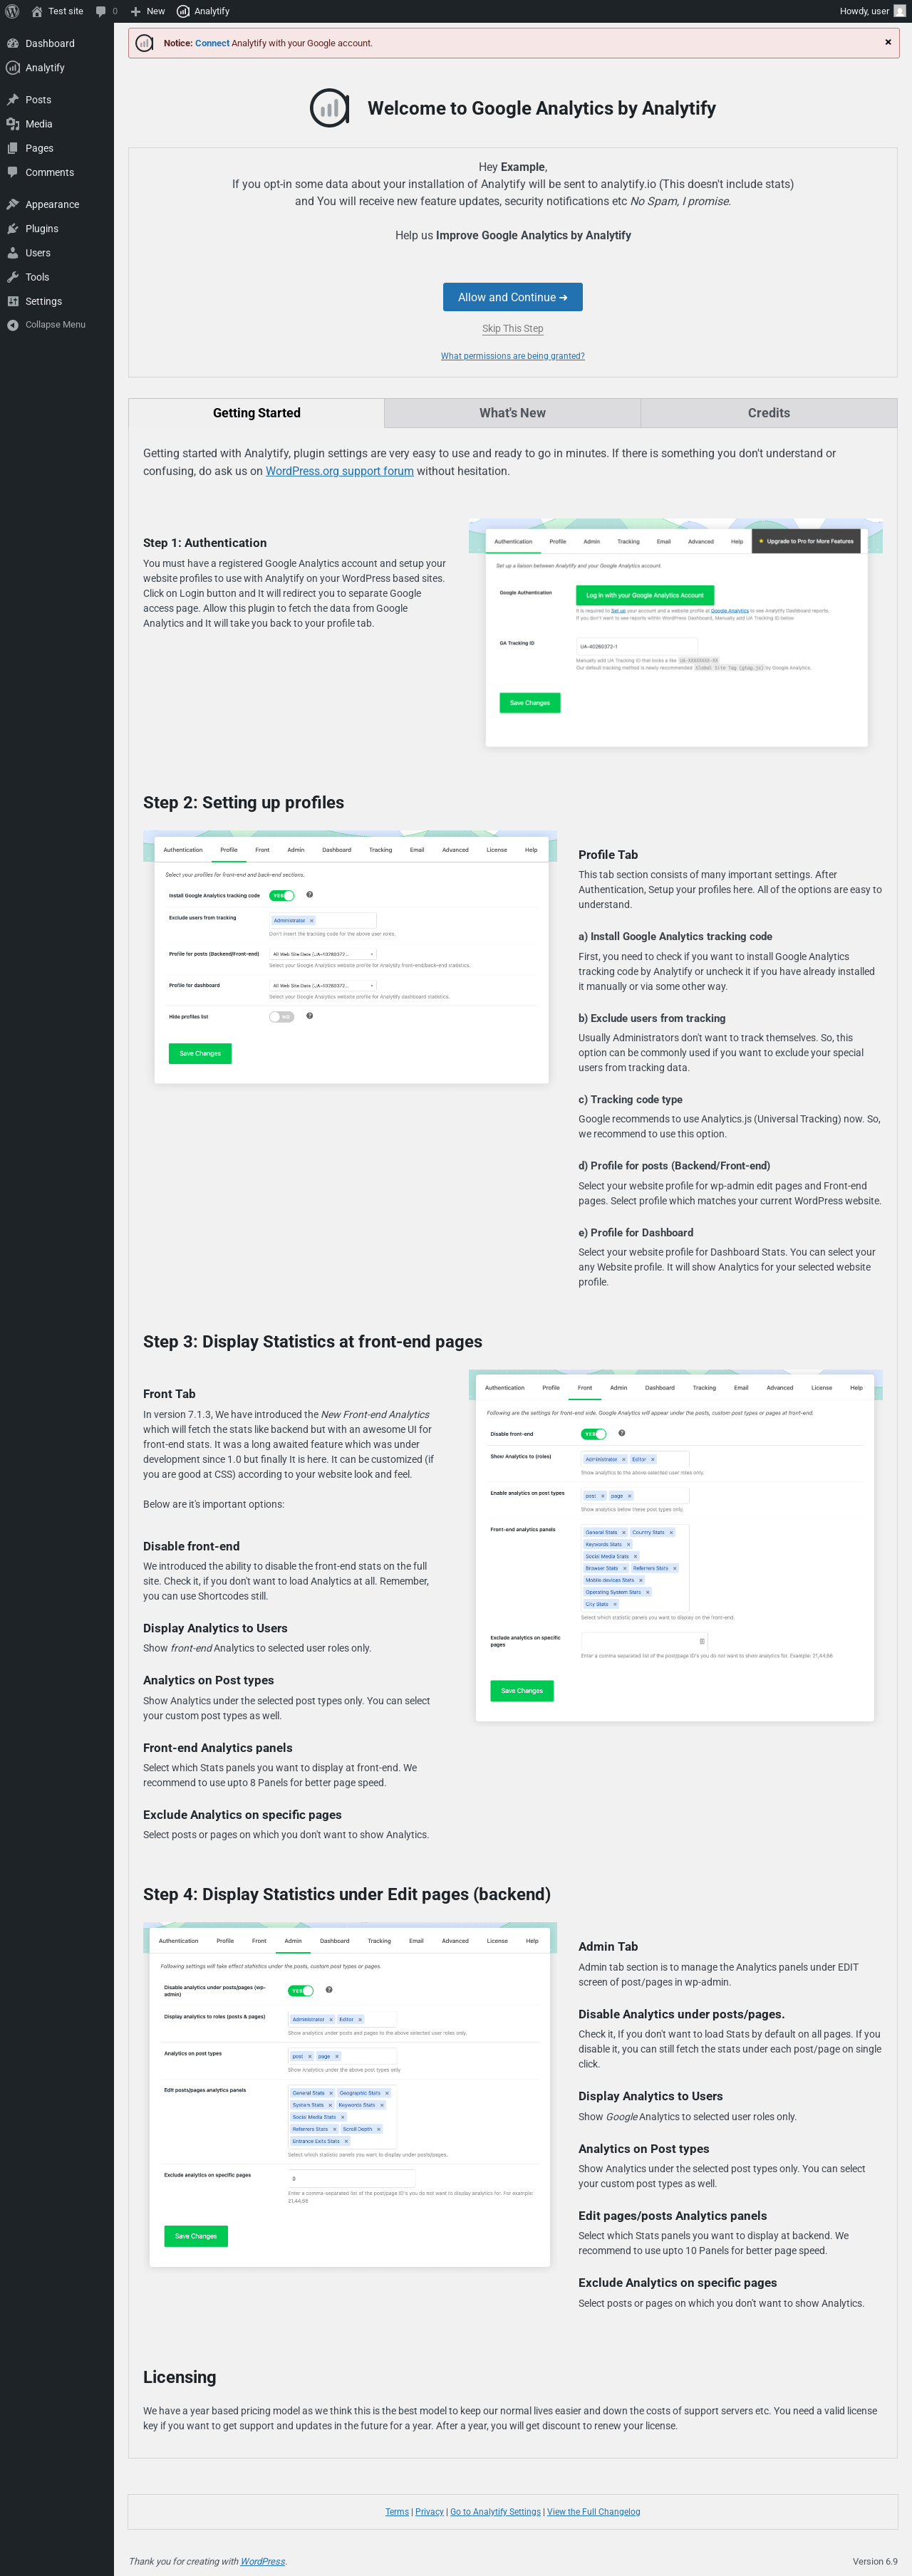
| URL | /wp-admin/admin.php?page=analytify-optin |
|---|---|
| Requested URL | /wp-admin/admin.php?page=analytify-dashboard |
| Aspect | menu-item |
| HTTP status | 200 |
| Load time | 0.356 s |
| Memory usage | 4.07 MiB |
| JS errors | None |
| Resource errors | None |
Analytify → What's New
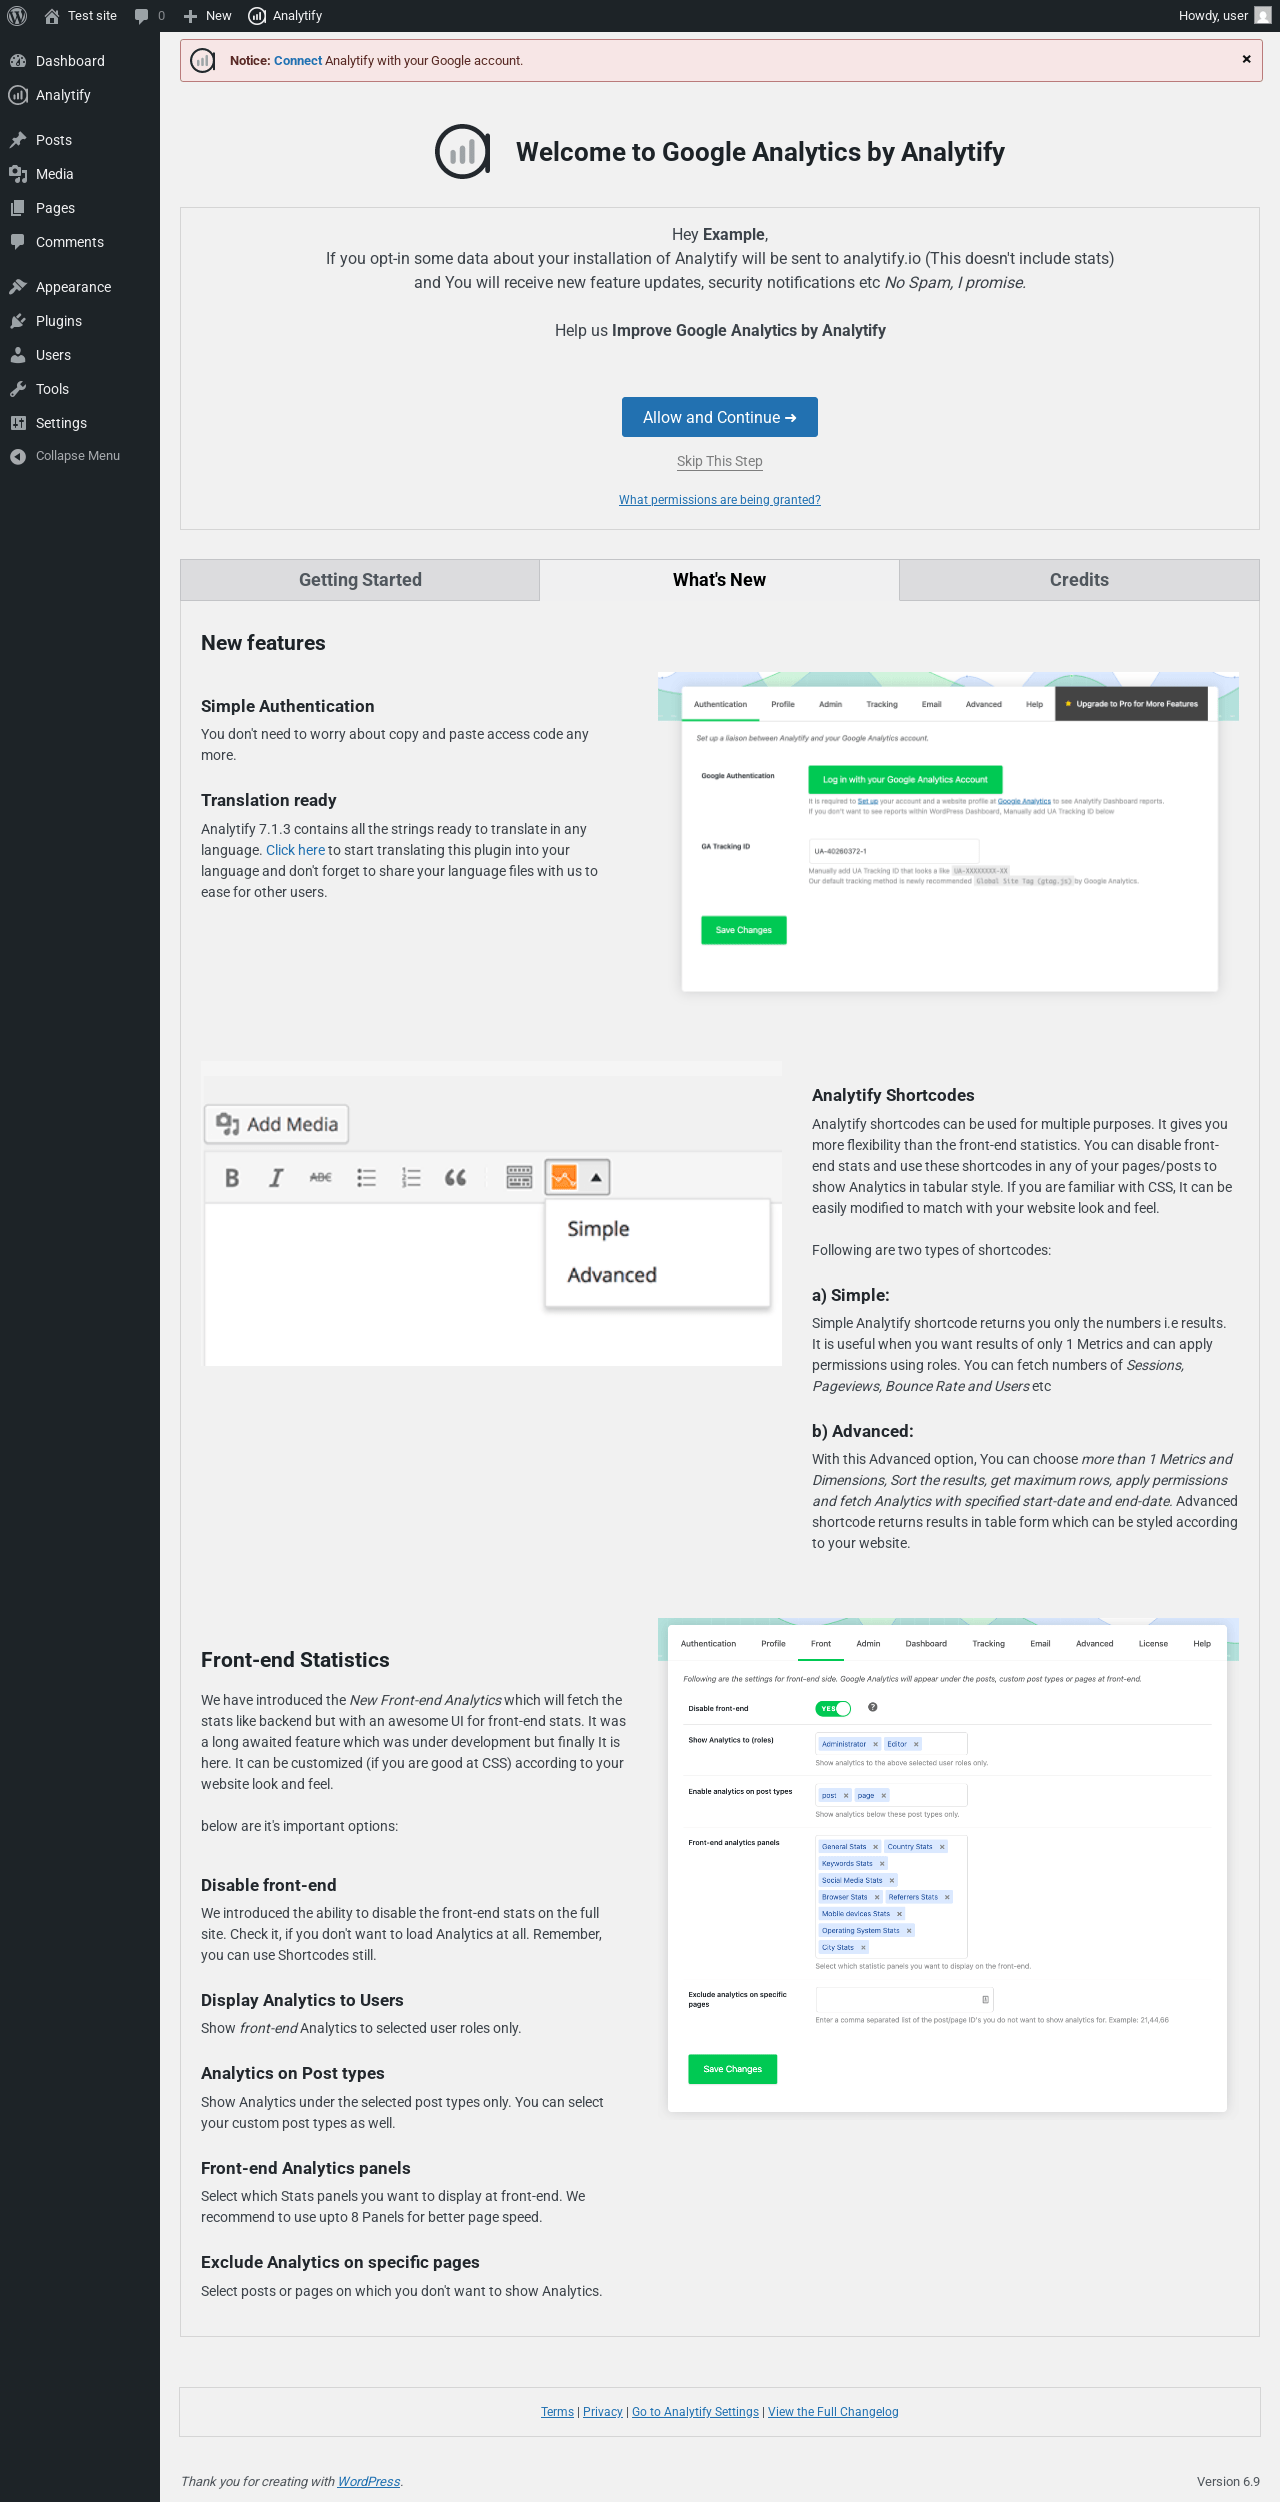
| URL | /wp-admin/admin.php?page=analytify-optin |
|---|---|
| Requested URL | /wp-admin/admin.php?page=analytify-dashboard |
| Aspect | menu-item-tab |
| HTTP status | 200 |
| Load time | 0.293 s |
| Memory usage | 3.94 MiB |
| JS errors | None |
| Resource errors | None |
Analytify → Credits
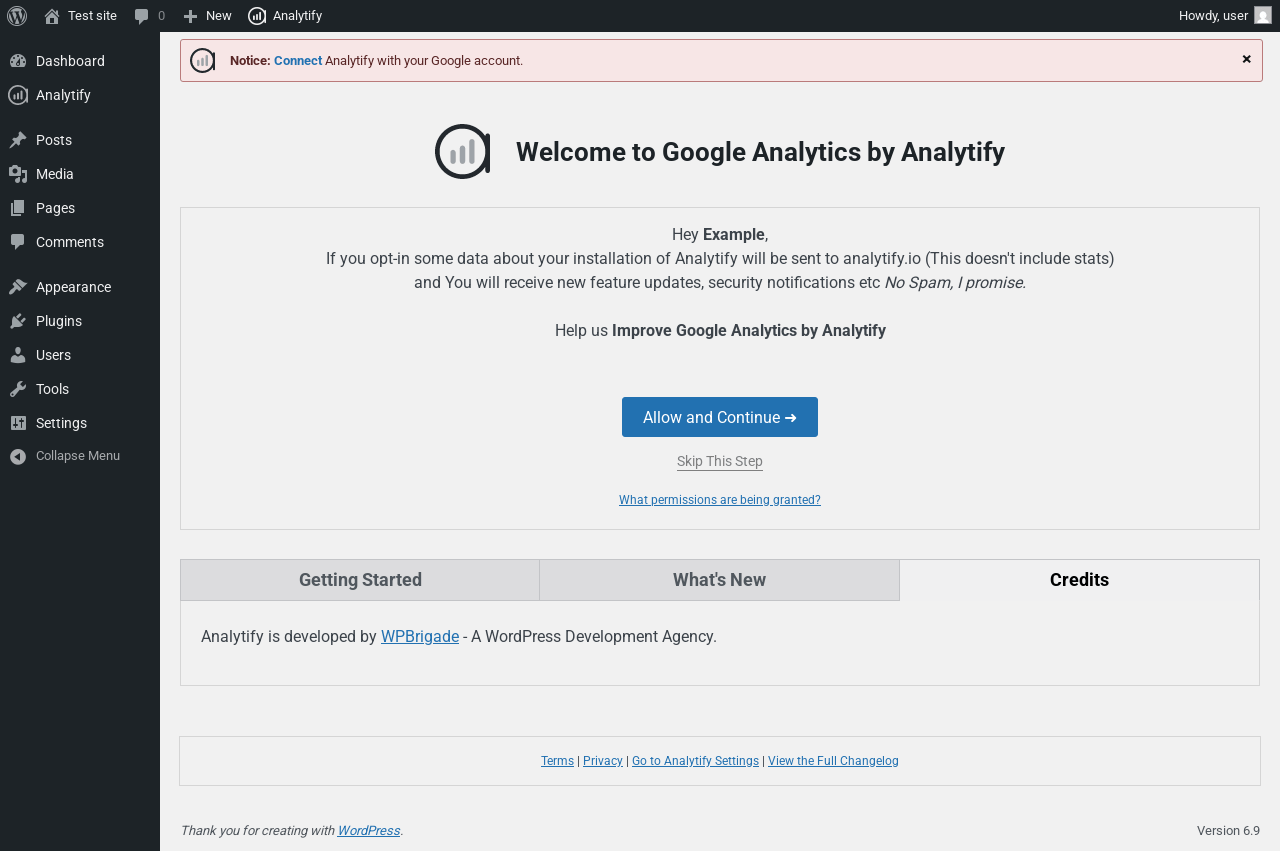
| URL | /wp-admin/admin.php?page=analytify-optin |
|---|---|
| Requested URL | /wp-admin/admin.php?page=analytify-dashboard |
| Aspect | menu-item-tab |
| HTTP status | 200 |
| Load time | 0.312 s |
| Memory usage | 3.94 MiB |
| JS errors | None |
| Resource errors | None |
Analytify → Settings

| URL | /wp-admin/admin.php?page=analytify-optin |
|---|---|
| Requested URL | /wp-admin/admin.php?page=analytify-settings |
| Aspect | menu-item |
| HTTP status | 200 |
| Load time | 0.282 s |
| Memory usage | 3.94 MiB |
| JS errors | None |
| Resource errors | None |
Analytify → Settings → What's New

| URL | /wp-admin/admin.php?page=analytify-optin |
|---|---|
| Requested URL | /wp-admin/admin.php?page=analytify-settings |
| Aspect | menu-item-tab |
| HTTP status | 200 |
| Load time | 0.281 s |
| Memory usage | 3.94 MiB |
| JS errors | None |
| Resource errors | None |
Analytify → Settings → Credits

| URL | /wp-admin/admin.php?page=analytify-optin |
|---|---|
| Requested URL | /wp-admin/admin.php?page=analytify-settings |
| Aspect | menu-item-tab |
| HTTP status | 200 |
| Load time | 0.287 s |
| Memory usage | 3.94 MiB |
| JS errors | None |
| Resource errors | None |
Analytify → Add-ons

| URL | /wp-admin/admin.php?page=analytify-optin |
|---|---|
| Requested URL | /wp-admin/admin.php?page=analytify-addons |
| Aspect | menu-item |
| HTTP status | 200 |
| Load time | 0.280 s |
| Memory usage | 3.94 MiB |
| JS errors | None |
| Resource errors | None |
Analytify → Add-ons → What's New

| URL | /wp-admin/admin.php?page=analytify-optin |
|---|---|
| Requested URL | /wp-admin/admin.php?page=analytify-addons |
| Aspect | menu-item-tab |
| HTTP status | 200 |
| Load time | 0.269 s |
| Memory usage | 3.94 MiB |
| JS errors | None |
| Resource errors | None |
Analytify → Add-ons → Credits

| URL | /wp-admin/admin.php?page=analytify-optin |
|---|---|
| Requested URL | /wp-admin/admin.php?page=analytify-addons |
| Aspect | menu-item-tab |
| HTTP status | 200 |
| Load time | 0.286 s |
| Memory usage | 3.94 MiB |
| JS errors | None |
| Resource errors | None |
Analytify → PRO vs FREE
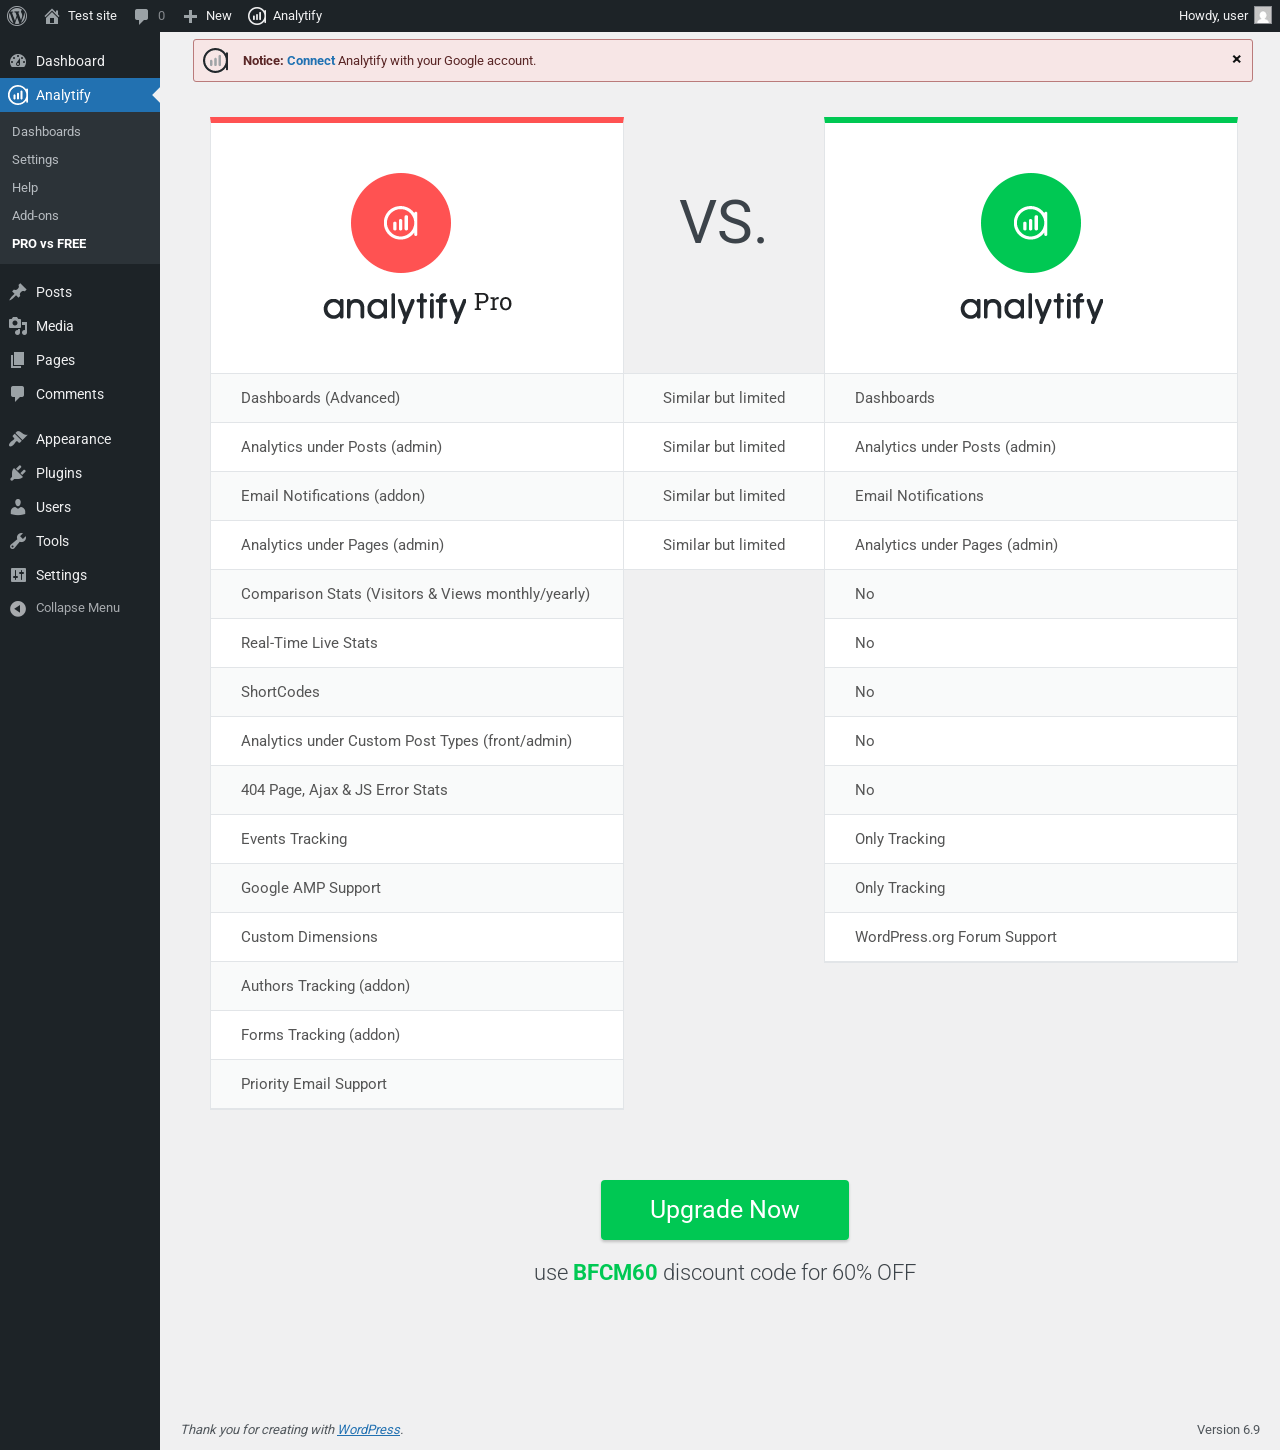
| URL | /wp-admin/admin.php?page=analytify-go-pro |
|---|---|
| Aspect | menu-item |
| HTTP status | 200 |
| Load time | 0.266 s |
| Memory usage | 3.94 MiB |
| JS errors | None |
| Resource errors | None |
Test site – Just another WordPress site
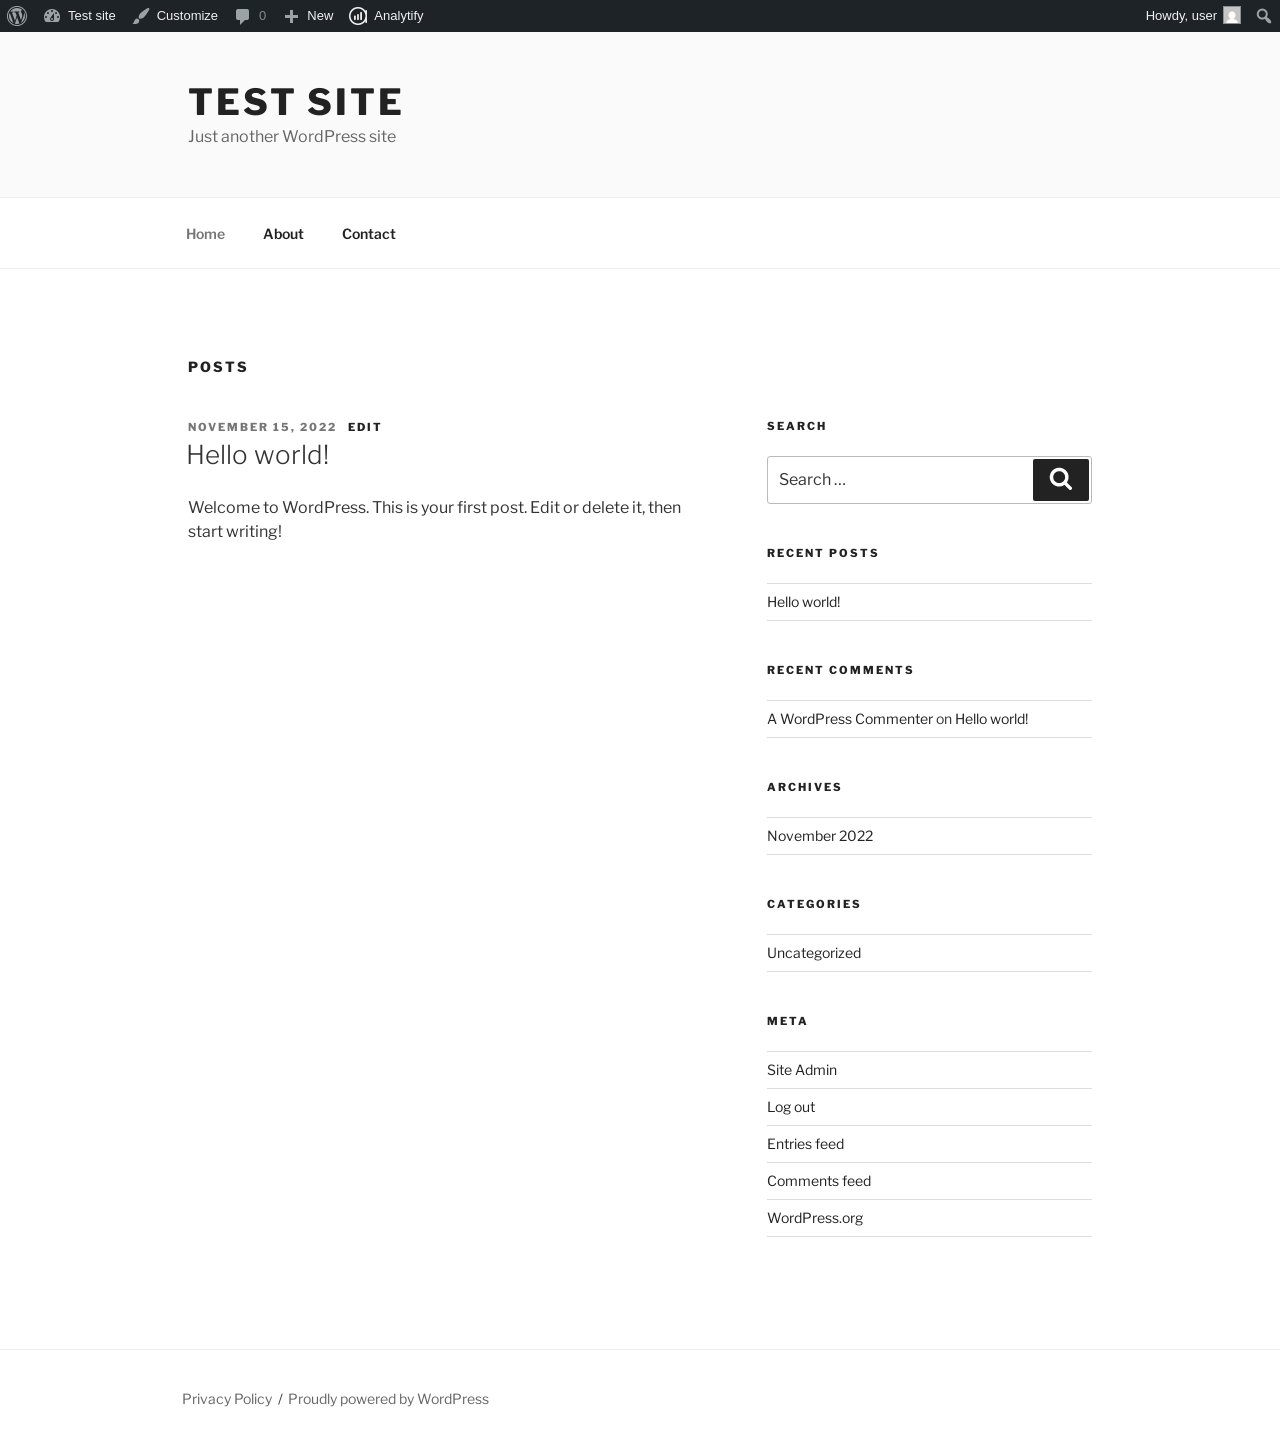
| URL | / |
|---|---|
| Aspect | front-page |
| HTTP status | 200 |
| Load time | 0.207 s |
| Memory usage | 4.32 MiB |
| JS errors | None |
| Resource errors | None |
Dashboard ‹ Test site — WordPress
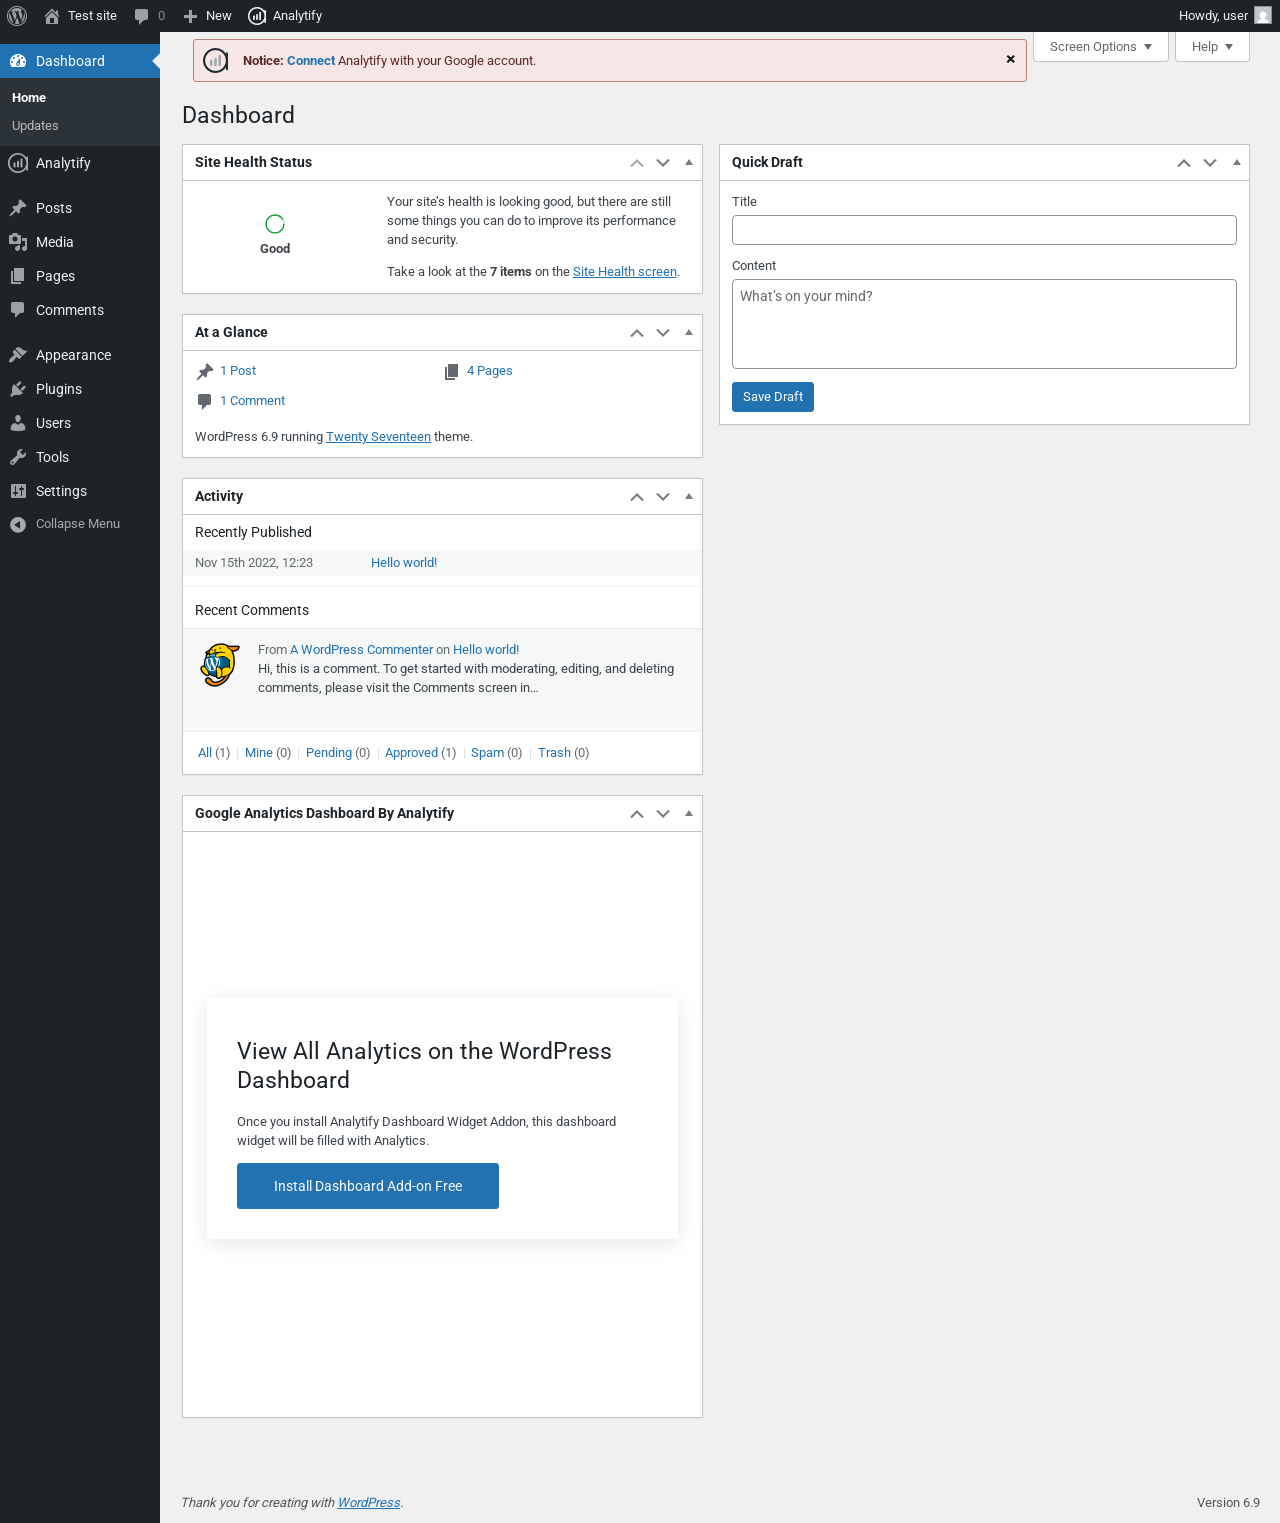
| URL | /wp-admin/index.php |
|---|---|
| Aspect | new-meta-boxes |
| HTTP status | 200 |
| Load time | 0.405 s |
| Memory usage | 4.03 MiB |
| JS errors | None |
| Resource errors | None |
Benchmark
| URL | Load time | Memory usage | ||||
|---|---|---|---|---|---|---|
| Inactive | Active | Change | Inactive | Active | Change | |
| /wp-admin/index.php | 0.457 s | 0.438 s | -0.019 s | 3.78 MiB | 4.03 MiB | + 259.7 KiB |
| /wp-admin/edit.php | 0.302 s | 0.272 s | -0.030 s | 3.78 MiB | 4.07 MiB | + 291 KiB |
| /wp-admin/post-new.php | 0.659 s | 0.736 s | +0.077 s | 6.31 MiB | 6.64 MiB | + 342.09 KiB |
| /wp-admin/upload.php | 0.365 s | 0.410 s | +0.045 s | 3.74 MiB | 3.96 MiB | + 227.52 KiB |
| /wp-admin/options-writing.php | 0.287 s | 0.279 s | -0.008 s | 3.71 MiB | 3.94 MiB | + 232.86 KiB |
| /wp-admin/media-new.php | 0.419 s | 0.287 s | -0.132 s | 3.7 MiB | 3.94 MiB | + 241.05 KiB |
| /wp-admin/edit-tags.php?taxonomy=category | 0.278 s | 0.264 s | -0.014 s | 3.72 MiB | 3.96 MiB | + 252.86 KiB |
| /wp-admin/post-new.php?post_type=page | 0.568 s | 0.595 s | +0.027 s | 6.3 MiB | 6.59 MiB | + 297.8 KiB |
| /wp-admin/options-discussion.php | 0.308 s | 0.331 s | +0.023 s | 3.71 MiB | 3.94 MiB | + 229.36 KiB |
| /wp-admin/edit-comments.php | 0.264 s | 0.291 s | +0.027 s | 3.73 MiB | 3.96 MiB | + 228.95 KiB |
| / | 0.227 s | 0.164 s | -0.063 s | 4.12 MiB | 4.32 MiB | + 205.66 KiB |
| Average | 0.376 s | 0.370 s | -0.006 s | 4.24 MiB | 4.48 MiB | + 255.35 KiB |
Code Statistics
Note: Third-party libraries and minified JS/CSS files are excluded from these statistics where possible, so the numbers you see here may be lower than those reported by other tools.
| Language | % | Lines of code | Comment lines | Files | |
|---|---|---|---|---|---|
| PHP | 41.8% | 16,467 | 4,331 | 59 | |
| PO File | 29.6% | 11,664 | 7,178 | 8 | |
| CSS | 17.1% | 6,719 | 233 | 7 | |
| JavaScript | 9.4% | 3,709 | 462 | 11 | |
| SVG | 1.5% | 591 | 10 | 18 | |
| JSON | 0.6% | 245 | 0 | 1 | |
| Total | 39,395 | 12,214 | 104 | ||
PHP Code Analysis | More results »
| Lines of code | 13,667 |
|---|---|
| Total complexity | 2,493 |
| Median class complexity | 25.0 |
| Median method complexity | 3.0 |
| Most complex class | WP_Analytify |
| Most complex function | WPBRIGADE_Logger::get_logs_data() |
| Classes | 34 |
|---|---|
| Methods | 475 |
| Functions | 60 |
Additions
Things that the plugin adds to the site. This section is not intended to be comprehensive. The test tool only looks for a few specific types of added content.
Options wp_options 14
- analytify_active_date
- analytify_current_version
- analytify_default_settings
- analytify_free_upgrade_routine
- analytify_gtag_move_to_notice
- analytify_logs_setup
- wp_analytify_active_time
- wp_analytify_modules
- WP_ANALYTIFY_PLUGIN_VERSION
- wp-analytify-admin
- wp-analytify-advanced
- wp-analytify-dashboard
- wp-analytify-profile
- wpa_current_version
Meta Boxes
{
    "dashboard": {
        "analytify-dashboard-addon": {
            "title": "Google Analytics Dashboard By Analytify",
            "context": "normal"
        }
    }
}
PHP Error Log 4 lines
[03-Dec-2025 06:06:49 UTC] PHP Deprecated: Function WP_Dependencies->add_data() was called with an argument that is <strong>deprecated</strong> since version 6.9.0! IE conditional comments are ignored by all supported browsers. in /wp-includes/functions.php on line 6131
[03-Dec-2025 06:06:49 UTC] PHP Deprecated: Function WP_Dependencies->add_data() was called with an argument that is <strong>deprecated</strong> since version 6.9.0! IE conditional comments are ignored by all supported browsers. in /wp-includes/functions.php on line 6131
[03-Dec-2025 06:06:57 UTC] PHP Deprecated: Function WP_Dependencies->add_data() was called with an argument that is <strong>deprecated</strong> since version 6.9.0! IE conditional comments are ignored by all supported browsers. in /wp-includes/functions.php on line 6131
[03-Dec-2025 06:06:57 UTC] PHP Deprecated: Function WP_Dependencies->add_data() was called with an argument that is <strong>deprecated</strong> since version 6.9.0! IE conditional comments are ignored by all supported browsers. in /wp-includes/functions.php on line 6131