Analytify Dashboard 7.1.2
Does Analytify Dashboard work with WordPress 6.8.3 and PHP 8.1.12? A smoke test was performed on .
Summary
| No PHP errors, warnings or notices | |
| No JavaScript exceptions | |
| All test pages loaded successfully | |
| No resource errors | |
| Looks good! No problems were detected. |
Memory usage: 247.96 KiB
The average PHP memory usage increased by this amount after activating by the plugin.
Page speed impact:
insignificant.
The plugin didn't make the site noticeably slower.
| WordPress version | 6.8.3 |
|---|---|
| PHP version | 8.1.12 |
| MySQL version | 10.6.10 |
| PHP memory limit | 512M |
| Last updated | |
|---|---|
| Active installs | 30,000+ |
| WordPress.org page | https://wordpress.org/plugins/wp-analytify/ |
| Badges |
|
Pages 13
Plugins ‹ Test site — WordPress
| URL | /wp-admin/plugins.php?plugin_status=all&paged=1&s |
|---|---|
| Requested URL | /wp-admin/plugins.php?action=activate&plugin=wp-analytify%2Fwp-analytify.php&plugin_status=all&paged=1&s&_wpnonce=1c51046e88 |
| Aspect | after-activation |
| HTTP status | 200 |
| Load time | 0.517 s |
| Memory usage | 3.89 MiB |
| JS errors | None |
| Resource errors | None |
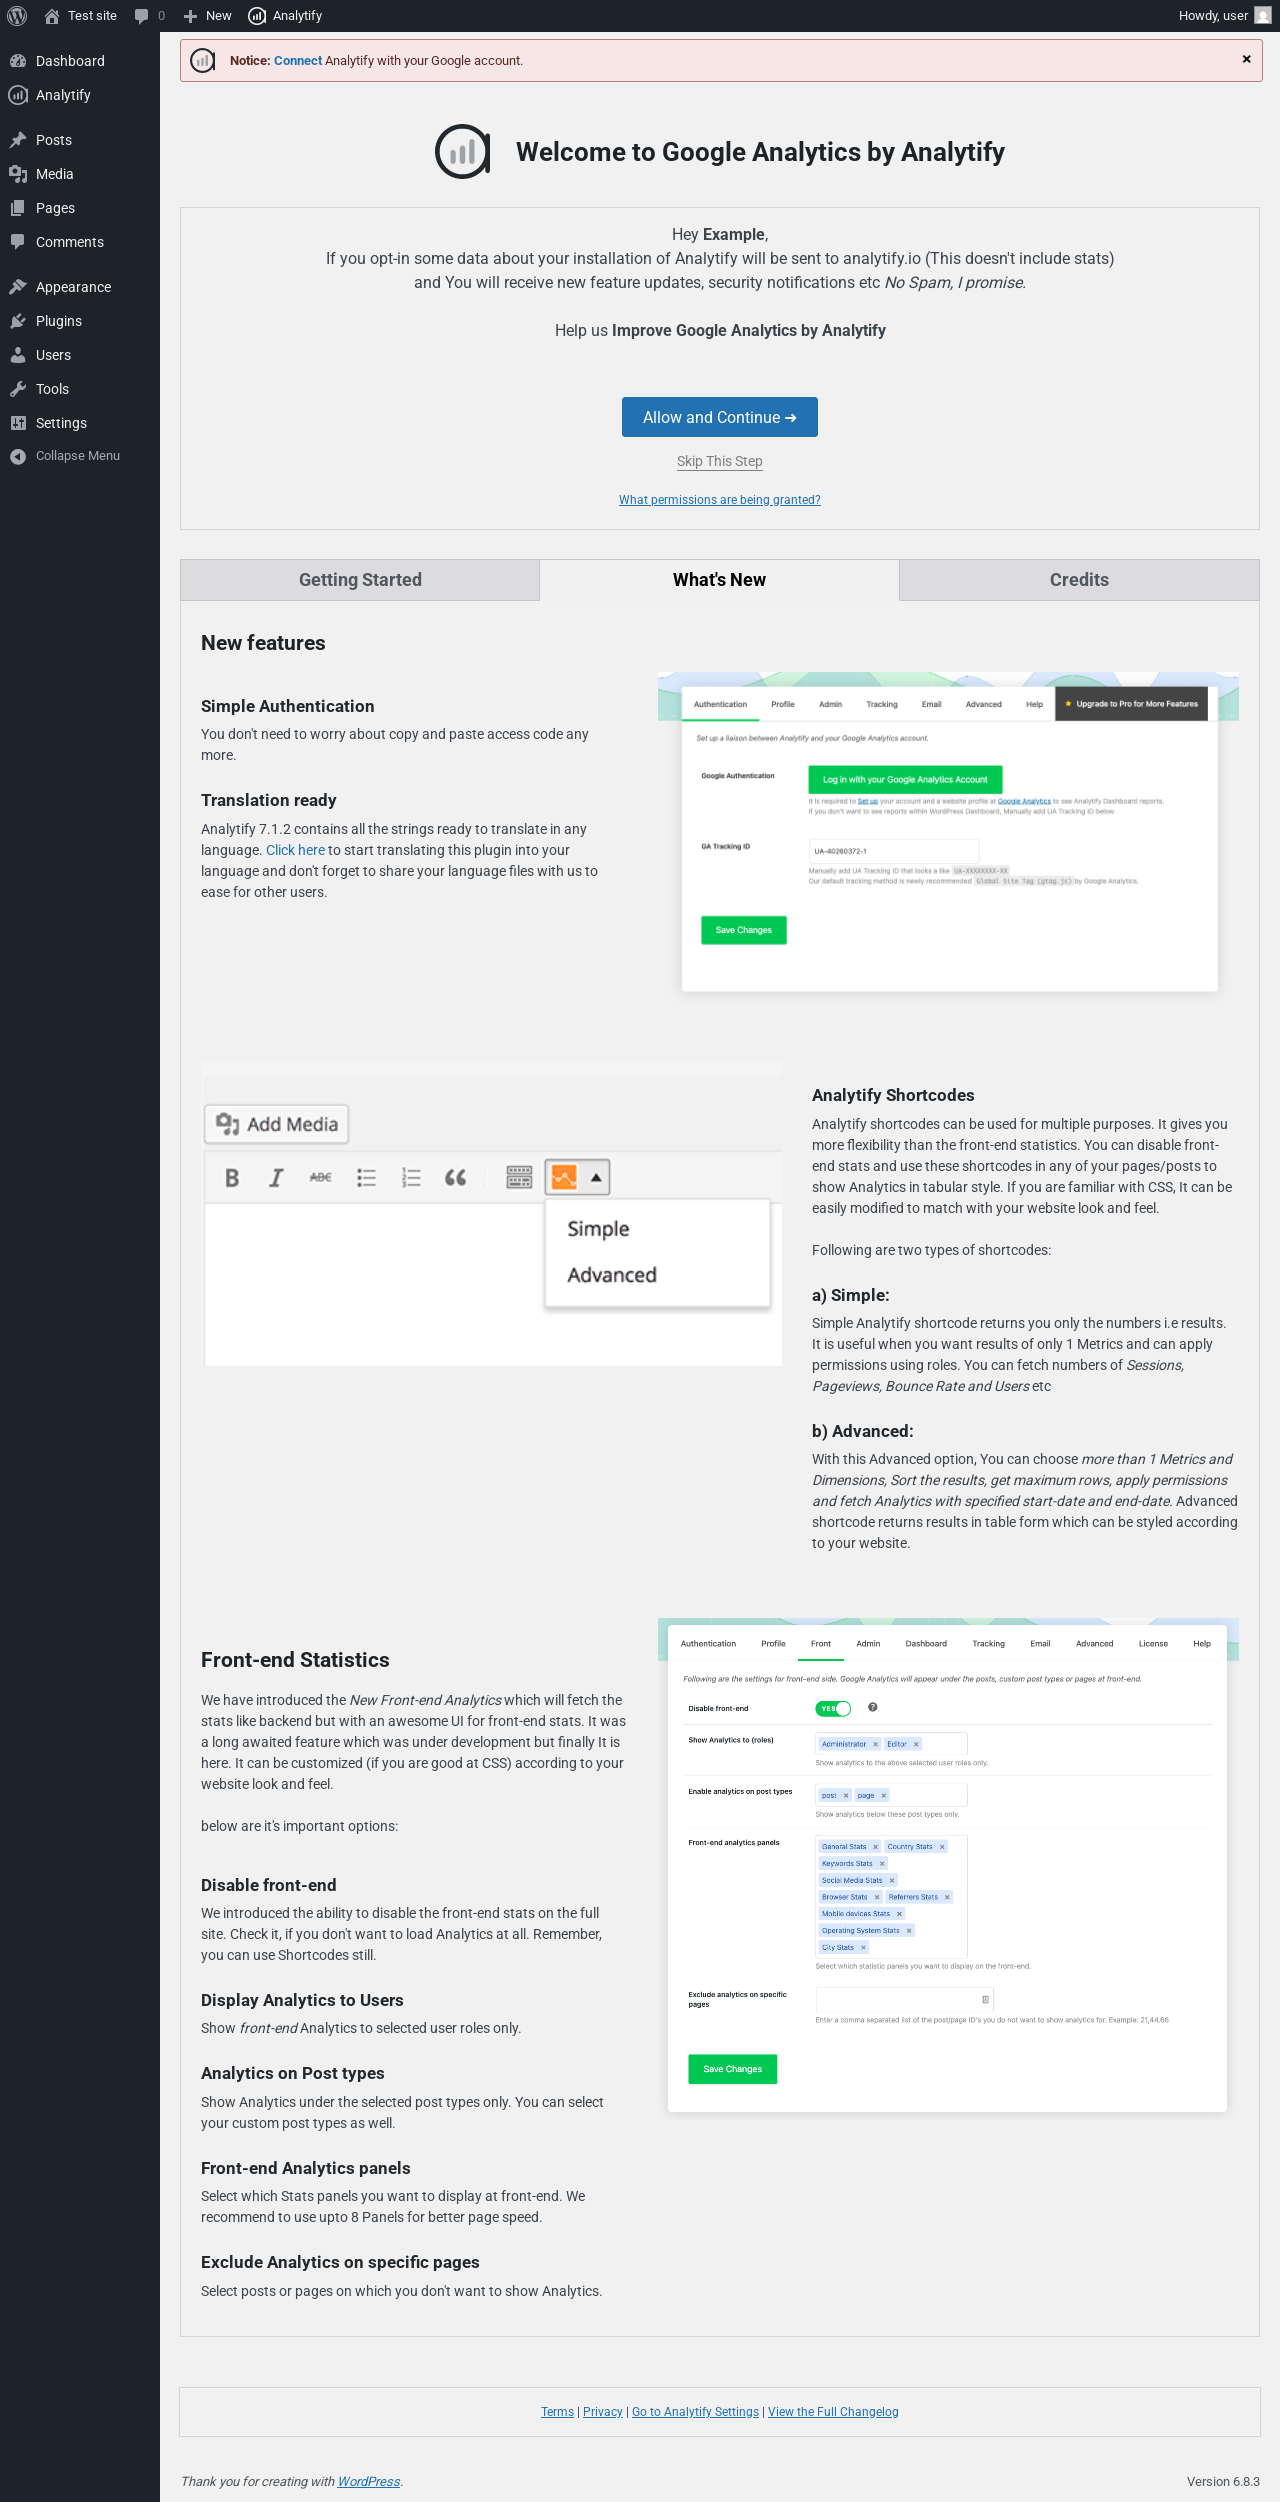
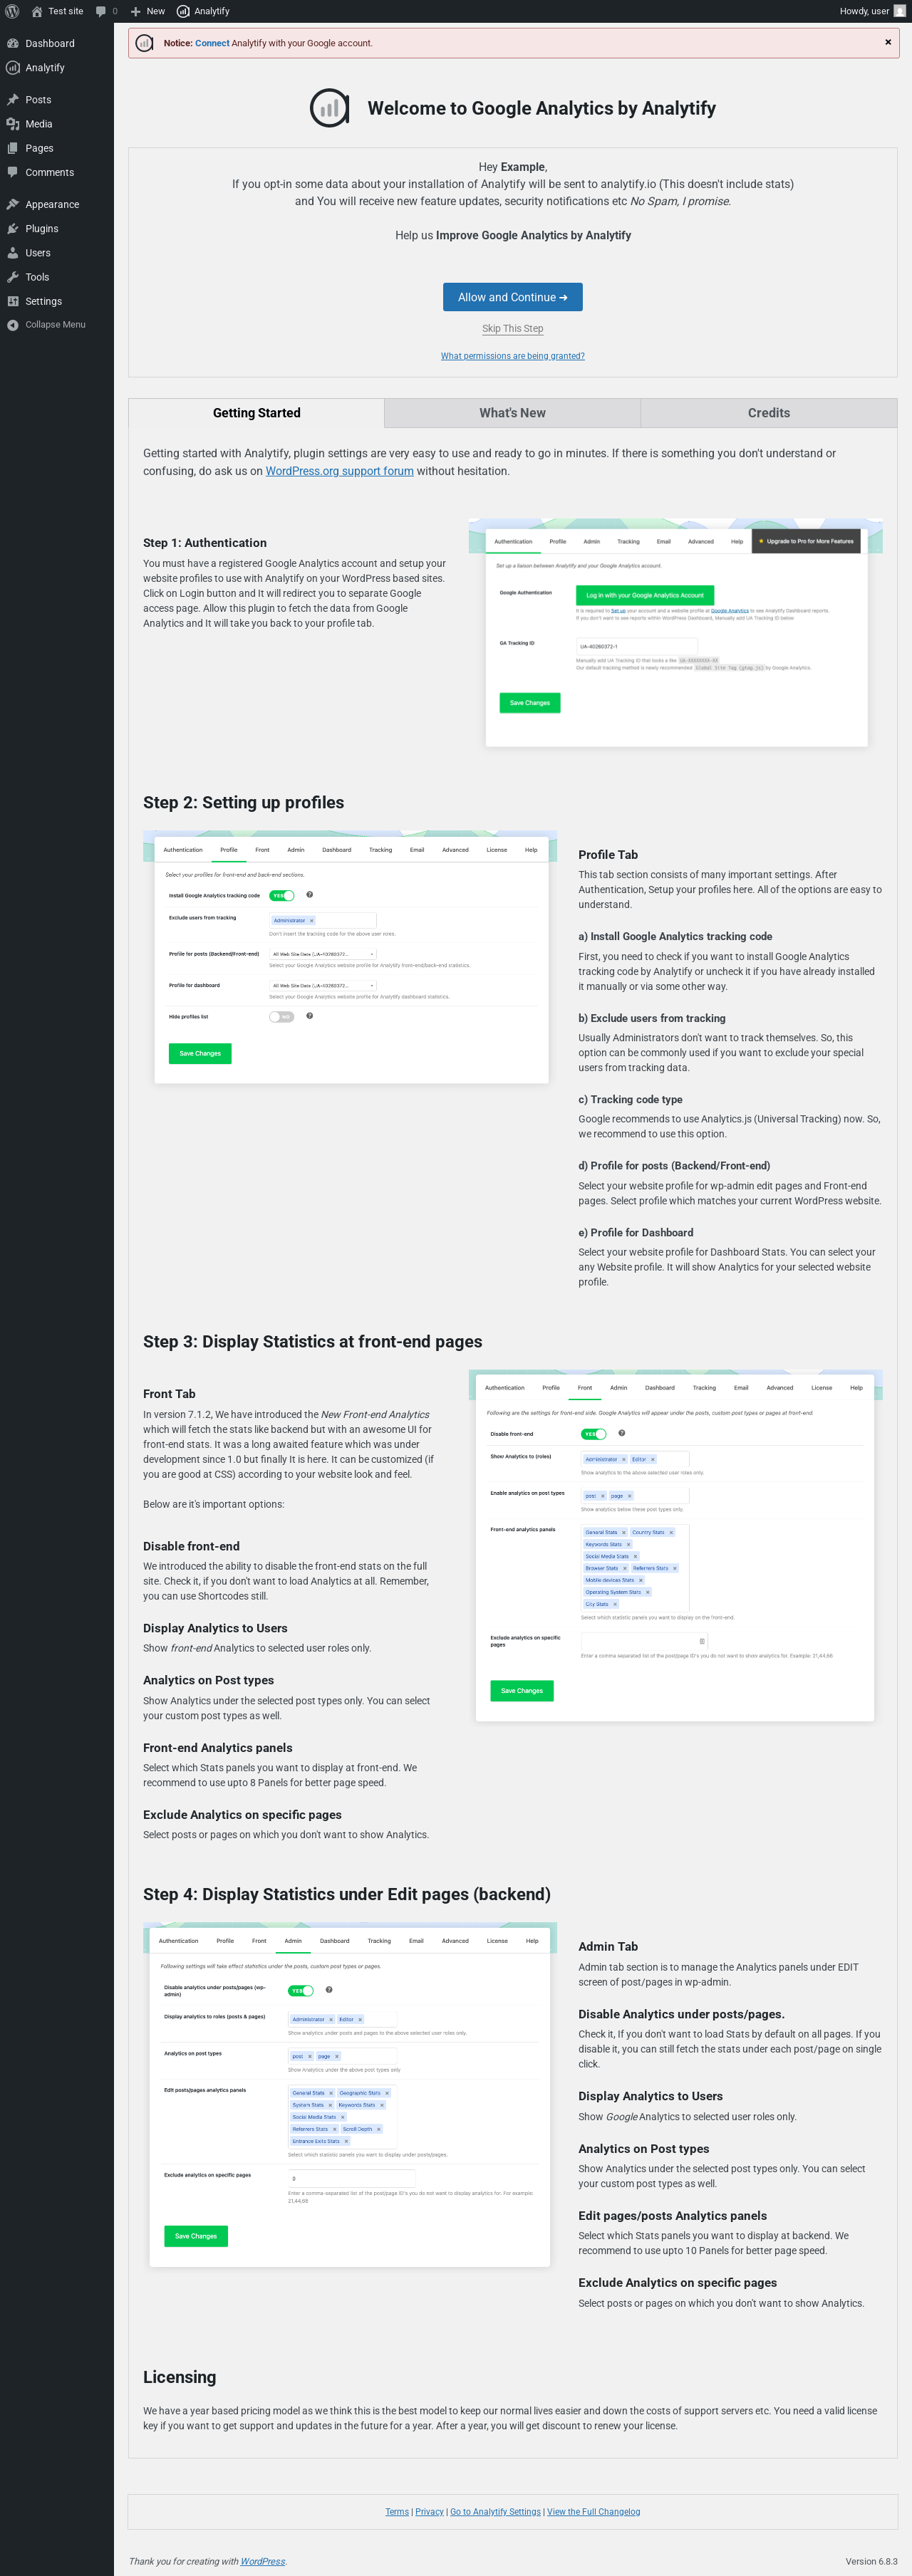
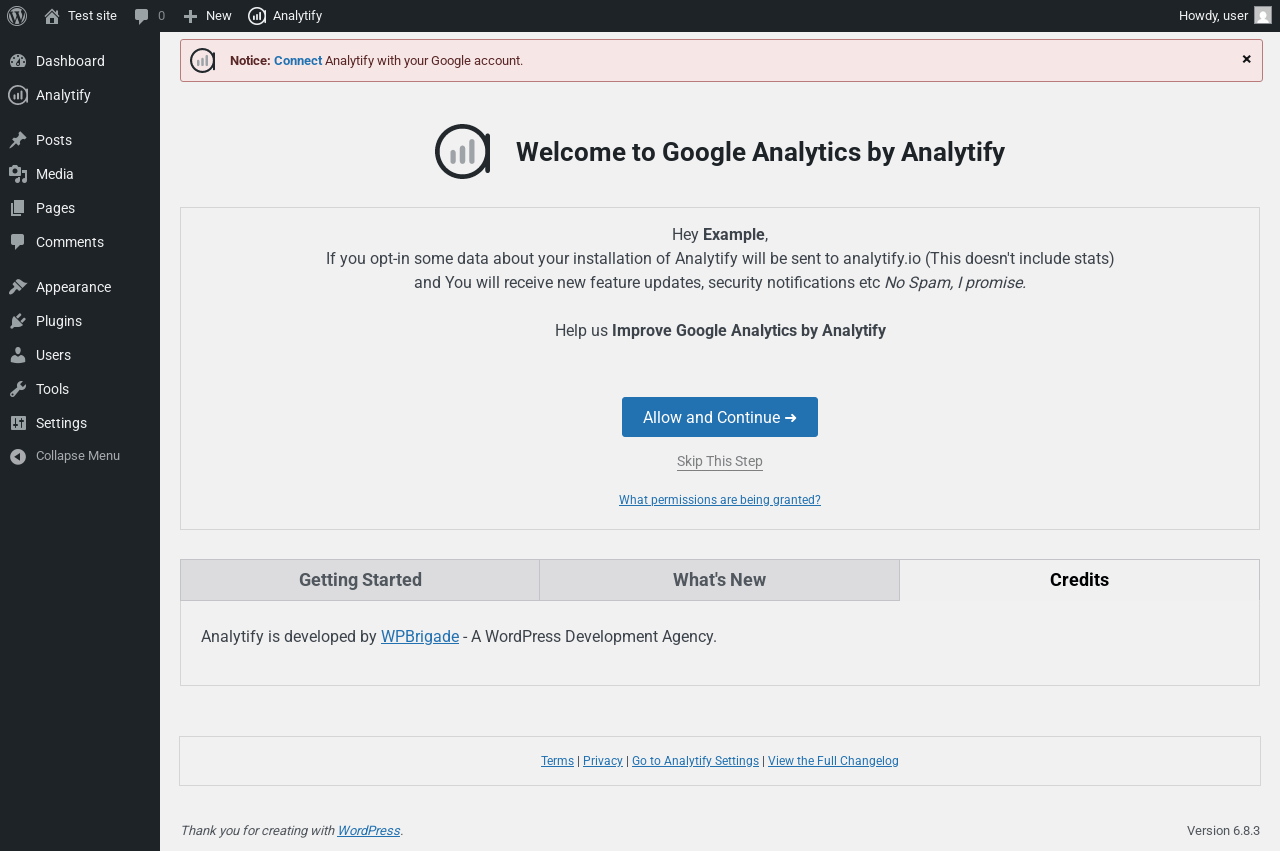
Analytify

| URL | /wp-admin/admin.php?page=analytify-optin |
|---|---|
| Requested URL | /wp-admin/admin.php?page=analytify-dashboard |
| Aspect | menu-item |
| HTTP status | 200 |
| Load time | 0.379 s |
| Memory usage | 3.87 MiB |
| JS errors | None |
| Resource errors | None |
Analytify → What's New

| URL | /wp-admin/admin.php?page=analytify-optin |
|---|---|
| Requested URL | /wp-admin/admin.php?page=analytify-dashboard |
| Aspect | menu-item-tab |
| HTTP status | 200 |
| Load time | 0.237 s |
| Memory usage | 3.73 MiB |
| JS errors | None |
| Resource errors | None |
Analytify → Credits

| URL | /wp-admin/admin.php?page=analytify-optin |
|---|---|
| Requested URL | /wp-admin/admin.php?page=analytify-dashboard |
| Aspect | menu-item-tab |
| HTTP status | 200 |
| Load time | 0.283 s |
| Memory usage | 3.73 MiB |
| JS errors | None |
| Resource errors | None |
Analytify → Settings

| URL | /wp-admin/admin.php?page=analytify-optin |
|---|---|
| Requested URL | /wp-admin/admin.php?page=analytify-settings |
| Aspect | menu-item |
| HTTP status | 200 |
| Load time | 0.250 s |
| Memory usage | 3.73 MiB |
| JS errors | None |
| Resource errors | None |
Analytify → Settings → What's New
| URL | /wp-admin/admin.php?page=analytify-optin |
|---|---|
| Requested URL | /wp-admin/admin.php?page=analytify-settings |
| Aspect | menu-item-tab |
| HTTP status | 200 |
| Load time | 0.253 s |
| Memory usage | 3.73 MiB |
| JS errors | None |
| Resource errors | None |
Analytify → Settings → Credits

| URL | /wp-admin/admin.php?page=analytify-optin |
|---|---|
| Requested URL | /wp-admin/admin.php?page=analytify-settings |
| Aspect | menu-item-tab |
| HTTP status | 200 |
| Load time | 0.266 s |
| Memory usage | 3.73 MiB |
| JS errors | None |
| Resource errors | None |
Analytify → Add-ons
| URL | /wp-admin/admin.php?page=analytify-optin |
|---|---|
| Requested URL | /wp-admin/admin.php?page=analytify-addons |
| Aspect | menu-item |
| HTTP status | 200 |
| Load time | 0.281 s |
| Memory usage | 3.73 MiB |
| JS errors | None |
| Resource errors | None |
Analytify → Add-ons → What's New

| URL | /wp-admin/admin.php?page=analytify-optin |
|---|---|
| Requested URL | /wp-admin/admin.php?page=analytify-addons |
| Aspect | menu-item-tab |
| HTTP status | 200 |
| Load time | 0.250 s |
| Memory usage | 3.73 MiB |
| JS errors | None |
| Resource errors | None |
Analytify → Add-ons → Credits
| URL | /wp-admin/admin.php?page=analytify-optin |
|---|---|
| Requested URL | /wp-admin/admin.php?page=analytify-addons |
| Aspect | menu-item-tab |
| HTTP status | 200 |
| Load time | 0.257 s |
| Memory usage | 3.73 MiB |
| JS errors | None |
| Resource errors | None |
Analytify → PRO vs FREE
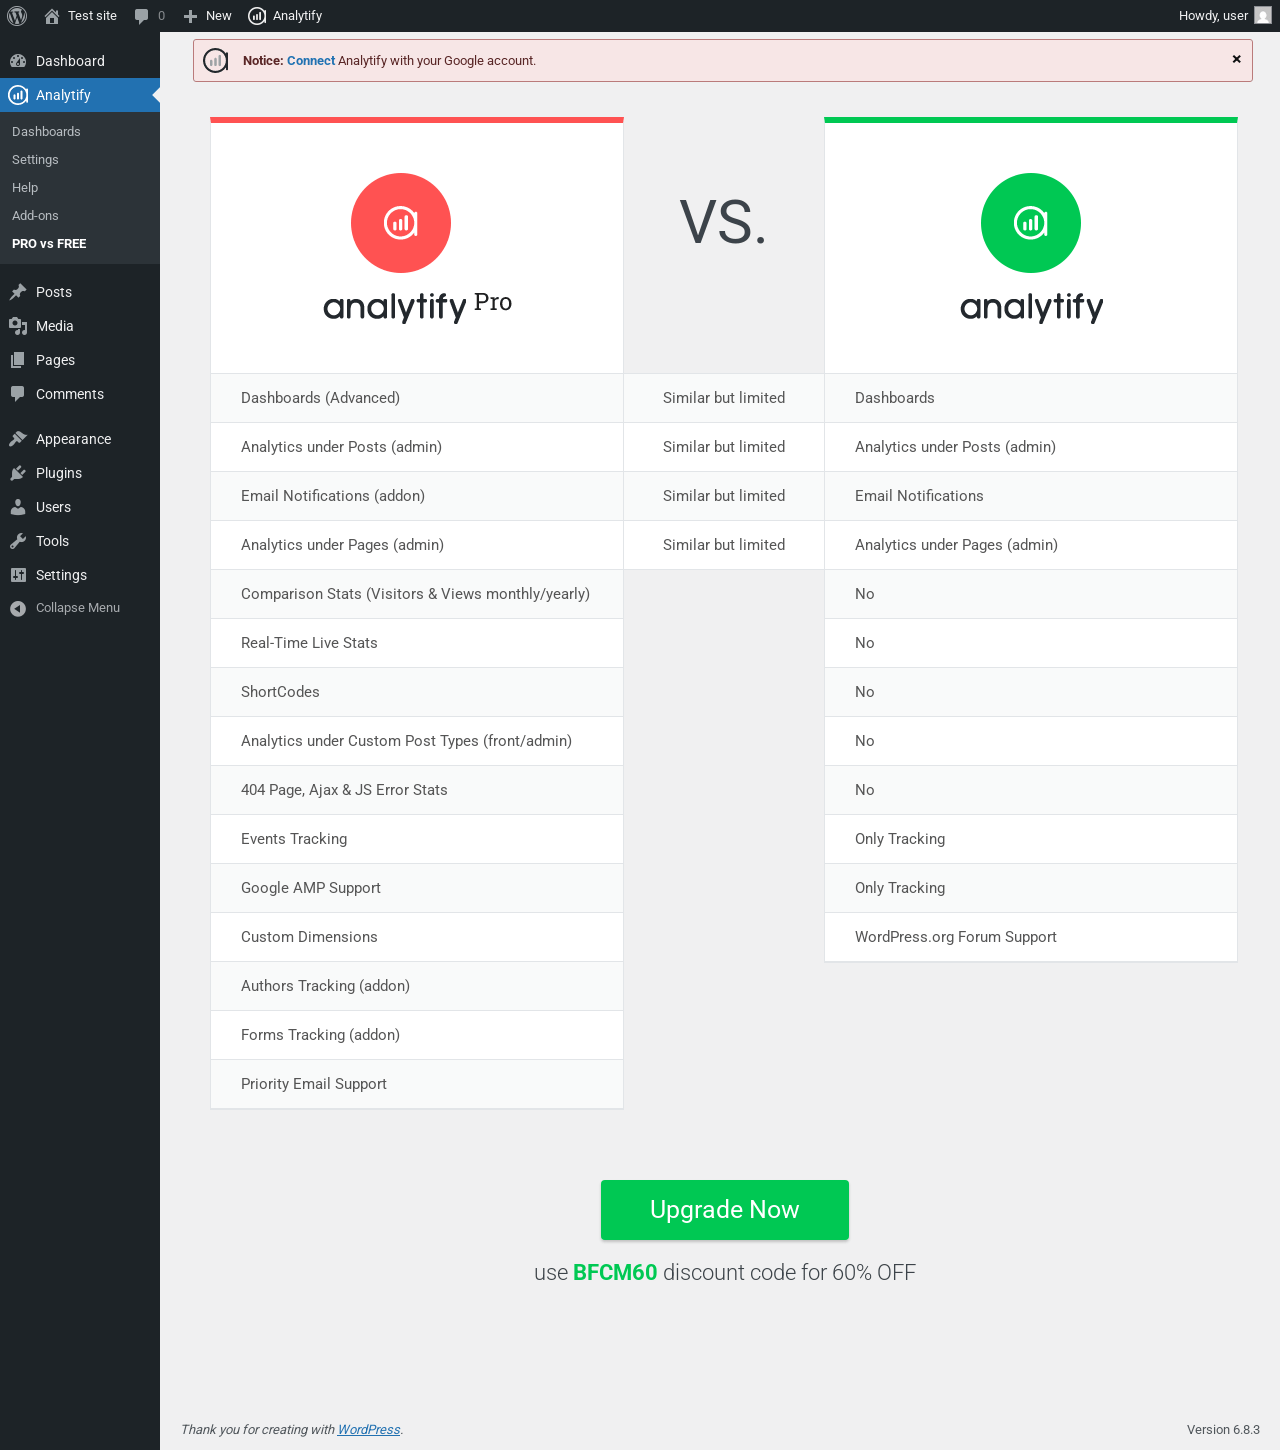
| URL | /wp-admin/admin.php?page=analytify-go-pro |
|---|---|
| Aspect | menu-item |
| HTTP status | 200 |
| Load time | 0.247 s |
| Memory usage | 3.73 MiB |
| JS errors | None |
| Resource errors | None |
Test site – Just another WordPress site
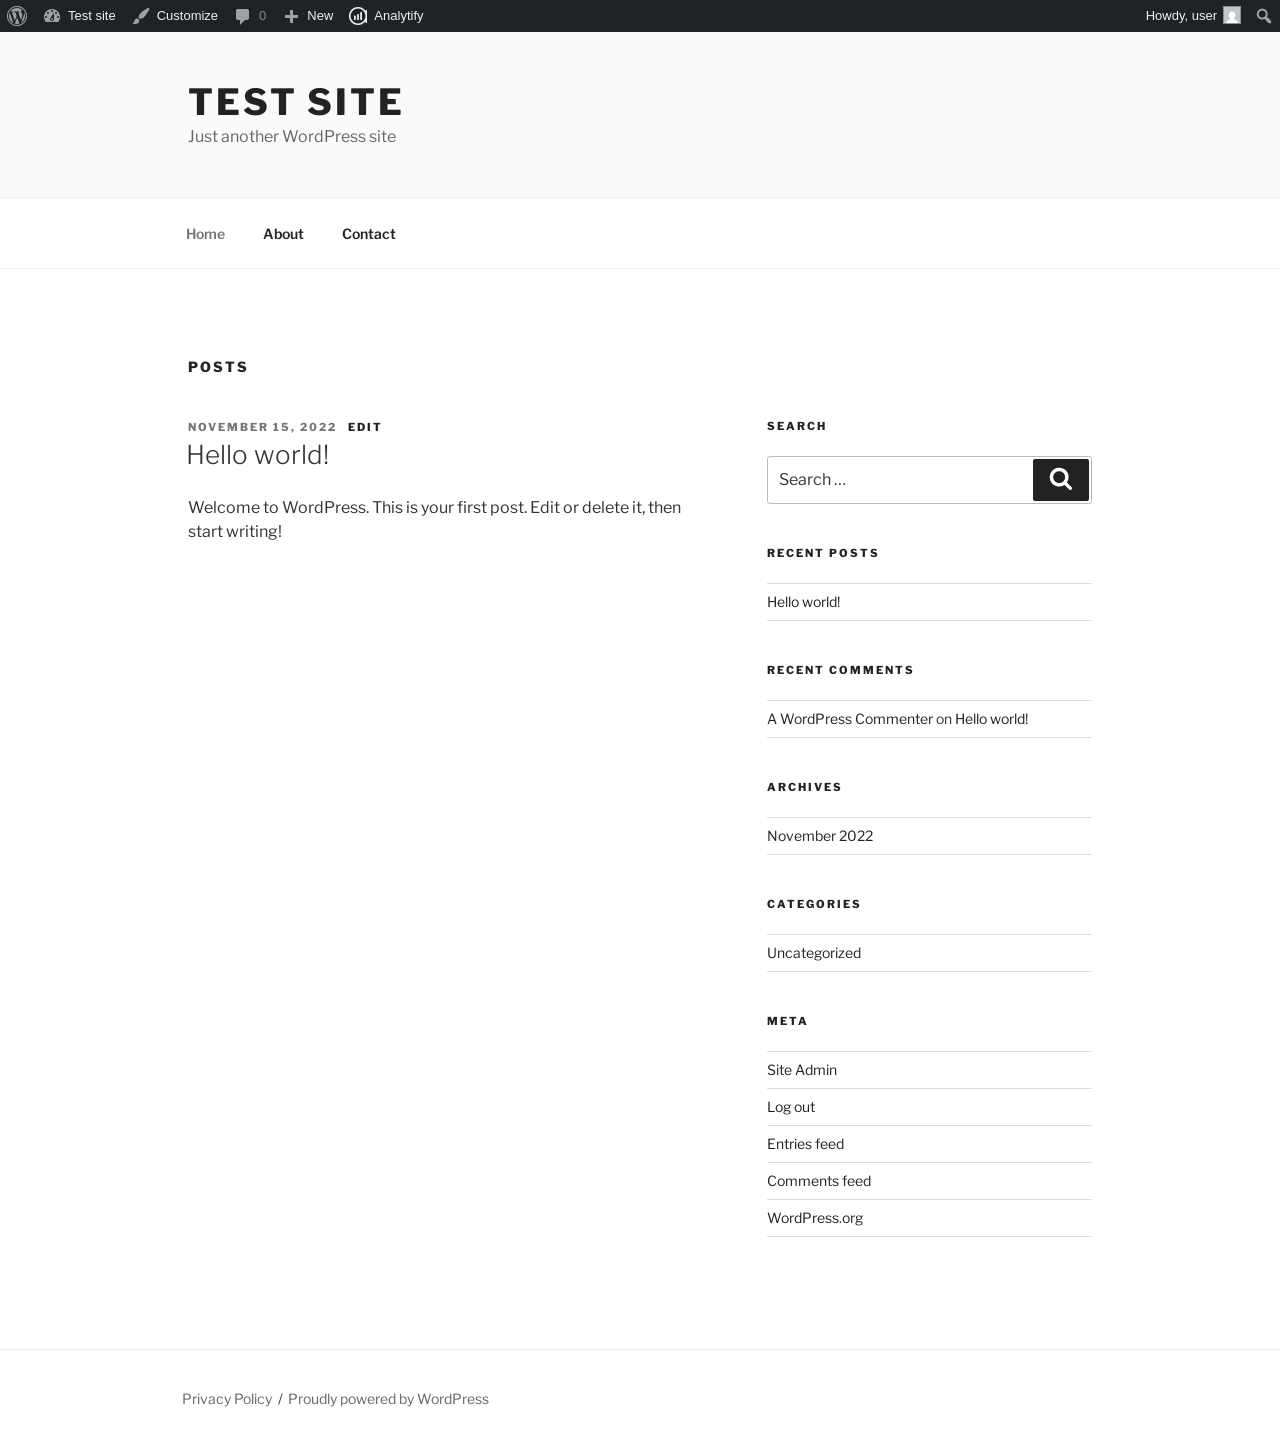
| URL | / |
|---|---|
| Aspect | front-page |
| HTTP status | 200 |
| Load time | 0.264 s |
| Memory usage | 3.64 MiB |
| JS errors | None |
| Resource errors | None |
Dashboard ‹ Test site — WordPress

| URL | /wp-admin/index.php |
|---|---|
| Aspect | new-meta-boxes |
| HTTP status | 200 |
| Load time | 0.504 s |
| Memory usage | 3.76 MiB |
| JS errors | None |
| Resource errors | None |
Benchmark
| URL | Load time | Memory usage | ||||
|---|---|---|---|---|---|---|
| Inactive | Active | Change | Inactive | Active | Change | |
| /wp-admin/index.php | 0.337 s | 0.523 s | +0.186 s | 3.51 MiB | 3.76 MiB | + 258.69 KiB |
| /wp-admin/edit.php | 0.185 s | 0.219 s | +0.034 s | 3.57 MiB | 3.84 MiB | + 276.36 KiB |
| /wp-admin/post-new.php | 0.761 s | 1.018 s | +0.257 s | 6.06 MiB | 6.38 MiB | + 323.36 KiB |
| /wp-admin/upload.php | 0.577 s | 0.355 s | -0.222 s | 3.52 MiB | 3.74 MiB | + 226.2 KiB |
| /wp-admin/options-writing.php | 0.219 s | 0.371 s | +0.152 s | 3.5 MiB | 3.73 MiB | + 231.86 KiB |
| /wp-admin/media-new.php | 0.263 s | 0.249 s | -0.014 s | 3.49 MiB | 3.73 MiB | + 240.05 KiB |
| /wp-admin/edit-tags.php?taxonomy=category | 0.248 s | 0.210 s | -0.038 s | 3.5 MiB | 3.75 MiB | + 252.17 KiB |
| /wp-admin/post-new.php?post_type=page | 0.611 s | 0.688 s | +0.077 s | 6.05 MiB | 6.3 MiB | + 254.88 KiB |
| /wp-admin/options-discussion.php | 0.461 s | 0.274 s | -0.187 s | 3.5 MiB | 3.73 MiB | + 228.98 KiB |
| /wp-admin/edit-comments.php | 0.265 s | 0.323 s | +0.058 s | 3.52 MiB | 3.75 MiB | + 228.02 KiB |
| / | 0.300 s | 0.208 s | -0.092 s | 3.43 MiB | 3.64 MiB | + 207 KiB |
| Average | 0.384 s | 0.403 s | +0.019 s | 3.97 MiB | 4.21 MiB | + 247.96 KiB |
Code Statistics
Note: Third-party libraries and minified JS/CSS files are excluded from these statistics where possible, so the numbers you see here may be lower than those reported by other tools.
| Language | % | Lines of code | Comment lines | Files | |
|---|---|---|---|---|---|
| PHP | 41.8% | 16,461 | 4,328 | 59 | |
| PO File | 29.6% | 11,664 | 7,178 | 8 | |
| CSS | 17.1% | 6,716 | 233 | 7 | |
| JavaScript | 9.4% | 3,709 | 462 | 11 | |
| SVG | 1.5% | 591 | 10 | 18 | |
| JSON | 0.6% | 245 | 0 | 1 | |
| Total | 39,386 | 12,211 | 104 | ||
PHP Code Analysis | More results »
| Lines of code | 13,661 |
|---|---|
| Total complexity | 2,483 |
| Median class complexity | 25.0 |
| Median method complexity | 3.0 |
| Most complex class | WP_Analytify |
| Most complex function | WPBRIGADE_Logger::get_logs_data() |
| Classes | 34 |
|---|---|
| Methods | 475 |
| Functions | 60 |
Additions
Things that the plugin adds to the site. This section is not intended to be comprehensive. The test tool only looks for a few specific types of added content.
Options wp_options 14
- analytify_active_date
- analytify_current_version
- analytify_default_settings
- analytify_free_upgrade_routine
- analytify_gtag_move_to_notice
- analytify_logs_setup
- wp_analytify_active_time
- wp_analytify_modules
- WP_ANALYTIFY_PLUGIN_VERSION
- wp-analytify-admin
- wp-analytify-advanced
- wp-analytify-dashboard
- wp-analytify-profile
- wpa_current_version
Meta Boxes
{
    "dashboard": {
        "analytify-dashboard-addon": {
            "title": "Google Analytics Dashboard By Analytify",
            "context": "normal"
        }
    }
}
PHP Error Log
The log file is empty.