Melapress File Monitor 2.2.0
Does Melapress File Monitor work with WordPress 6.7.1 and PHP 8.1.12? A smoke test was performed on .
Summary
| No PHP errors, warnings or notices | |
| No JavaScript exceptions | |
| All test pages loaded successfully | |
| No resource errors | |
| Looks good! No problems were detected. |
Memory usage: 152.82 KiB
The average PHP memory usage increased by this amount after activating by the plugin.
Page speed impact:
0.031 seconds
The average page load time increased by this amount after activating the plugin.
| WordPress version | 6.7.1 |
|---|---|
| PHP version | 8.1.12 |
| MySQL version | 10.6.10 |
| PHP memory limit | 512M |
| Last updated | |
|---|---|
| Active installs | 5,000+ |
| WordPress.org page | https://wordpress.org/plugins/website-file-changes-monitor/ |
| Badges |
|
Pages 14
File Monitoring ‹ Test site — WordPress

| URL | /wp-admin/admin.php?page=file-monitor-admin |
|---|---|
| Requested URL | /wp-admin/plugins.php?action=activate&plugin=website-file-changes-monitor%2Fwebsite-file-changes-monitor.php&plugin_status=all&paged=1&s&_wpnonce=4916eb3814 |
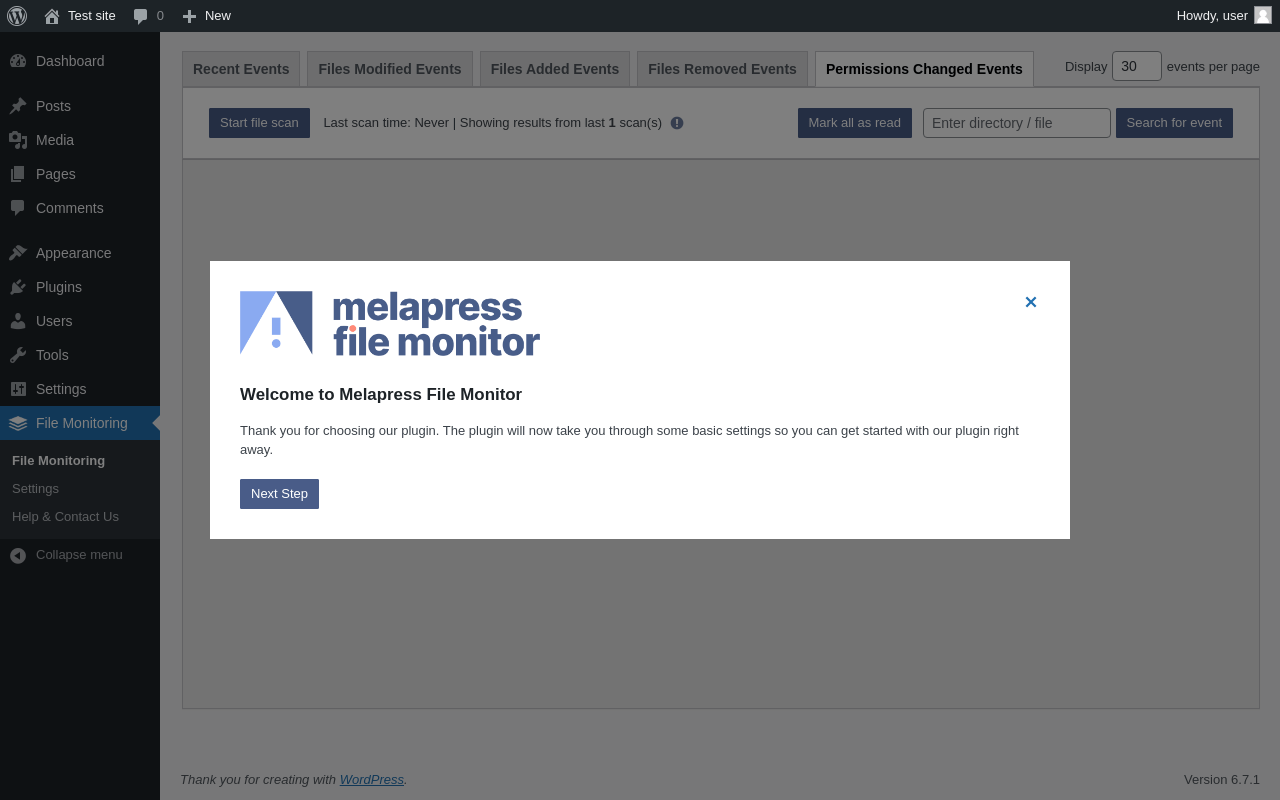
| Aspect | after-activation |
| HTTP status | 200 |
| Load time | 0.567 s |
| Memory usage | 5.95 MiB |
| JS errors | None |
| Resource errors | None |
File Monitoring

| URL | /wp-admin/admin.php?page=file-monitor-admin |
|---|---|
| Aspect | menu-item |
| HTTP status | 200 |
| Load time | 0.180 s |
| Memory usage | 5.34 MiB |
| JS errors | None |
| Resource errors | None |
File Monitoring → Files Modified Events

| URL | /wp-admin/admin.php?page=file-monitor-admin&tab=modified-events |
|---|---|
| Aspect | menu-item-tab |
| HTTP status | 200 |
| Load time | 0.166 s |
| Memory usage | 5.34 MiB |
| JS errors | None |
| Resource errors | None |
File Monitoring → Files Added Events

| URL | /wp-admin/admin.php?page=file-monitor-admin&tab=added-events |
|---|---|
| Aspect | menu-item-tab |
| HTTP status | 200 |
| Load time | 0.170 s |
| Memory usage | 5.34 MiB |
| JS errors | None |
| Resource errors | None |
File Monitoring → Files Removed Events

| URL | /wp-admin/admin.php?page=file-monitor-admin&tab=removed-events |
|---|---|
| Aspect | menu-item-tab |
| HTTP status | 200 |
| Load time | 0.162 s |
| Memory usage | 5.34 MiB |
| JS errors | None |
| Resource errors | None |
File Monitoring → Permissions Changed Events
| URL | /wp-admin/admin.php?page=file-monitor-admin&tab=permissions-events |
|---|---|
| Aspect | menu-item-tab |
| HTTP status | 200 |
| Load time | 0.186 s |
| Memory usage | 5.34 MiB |
| JS errors | None |
| Resource errors | None |
File Monitoring → Settings

| URL | /wp-admin/admin.php?page=file-monitor-settings |
|---|---|
| Aspect | menu-item |
| HTTP status | 200 |
| Load time | 0.215 s |
| Memory usage | 3.64 MiB |
| JS errors | None |
| Resource errors | None |
File Monitoring → Settings → WordPress core

| URL | /wp-admin/admin.php?page=file-monitor-settings&tab=core-preferences |
|---|---|
| Aspect | menu-item-tab |
| HTTP status | 200 |
| Load time | 0.198 s |
| Memory usage | 3.64 MiB |
| JS errors | None |
| Resource errors | None |
File Monitoring → Settings → Notifications

| URL | /wp-admin/admin.php?page=file-monitor-settings&tab=notification-preferences |
|---|---|
| Aspect | menu-item-tab |
| HTTP status | 200 |
| Load time | 0.205 s |
| Memory usage | 3.64 MiB |
| JS errors | None |
| Resource errors | None |
File Monitoring → Settings → Logging & Debugging

| URL | /wp-admin/admin.php?page=file-monitor-settings&tab=debugging-preferences |
|---|---|
| Aspect | menu-item-tab |
| HTTP status | 200 |
| Load time | 0.224 s |
| Memory usage | 3.64 MiB |
| JS errors | None |
| Resource errors | None |
File Monitoring → Help & Contact Us

| URL | /wp-admin/admin.php?page=file-monitor-help |
|---|---|
| Aspect | menu-item |
| HTTP status | 200 |
| Load time | 0.230 s |
| Memory usage | 3.66 MiB |
| JS errors | None |
| Resource errors | None |
File Monitoring → Help & Contact Us → About Us

| URL | /wp-admin/admin.php?page=file-monitor-help&tab=about |
|---|---|
| Aspect | menu-item-tab |
| HTTP status | 200 |
| Load time | 0.201 s |
| Memory usage | 3.64 MiB |
| JS errors | None |
| Resource errors | None |
File Monitoring → Help & Contact Us → System Info

| URL | /wp-admin/admin.php?page=file-monitor-help&tab=system-info |
|---|---|
| Aspect | menu-item-tab |
| HTTP status | 200 |
| Load time | 0.168 s |
| Memory usage | 3.64 MiB |
| JS errors | None |
| Resource errors | None |
Test site – Just another WordPress site

| URL | / |
|---|---|
| Aspect | front-page |
| HTTP status | 200 |
| Load time | 0.225 s |
| Memory usage | 3.51 MiB |
| JS errors | None |
| Resource errors | None |
Benchmark
| URL | Load time | Memory usage | ||||
|---|---|---|---|---|---|---|
| Inactive | Active | Change | Inactive | Active | Change | |
| /wp-admin/index.php | 0.276 s | 0.423 s | +0.147 s | 3.48 MiB | 3.65 MiB | + 178.49 KiB |
| /wp-admin/edit.php | 0.189 s | 0.198 s | +0.009 s | 3.54 MiB | 3.72 MiB | + 177.88 KiB |
| /wp-admin/post-new.php | 0.736 s | 0.992 s | +0.256 s | 5.92 MiB | 6.07 MiB | + 147.3 KiB |
| /wp-admin/upload.php | 0.538 s | 0.503 s | -0.035 s | 3.5 MiB | 3.65 MiB | + 161.46 KiB |
| /wp-admin/options-writing.php | 0.212 s | 0.213 s | +0.001 s | 3.47 MiB | 3.63 MiB | + 164.83 KiB |
| /wp-admin/media-new.php | 0.254 s | 0.251 s | -0.003 s | 3.46 MiB | 3.63 MiB | + 173.02 KiB |
| /wp-admin/edit-tags.php?taxonomy=category | 0.180 s | 0.199 s | +0.019 s | 3.48 MiB | 3.65 MiB | + 183.7 KiB |
| /wp-admin/post-new.php?post_type=page | 0.539 s | 0.601 s | +0.062 s | 5.92 MiB | 6.06 MiB | + 142.49 KiB |
| /wp-admin/options-discussion.php | 0.253 s | 0.424 s | +0.171 s | 3.47 MiB | 3.63 MiB | + 161.33 KiB |
| /wp-admin/edit-comments.php | 0.396 s | 0.221 s | -0.175 s | 3.49 MiB | 3.65 MiB | + 160.83 KiB |
| / | 0.307 s | 0.199 s | -0.108 s | 3.48 MiB | 3.51 MiB | + 29.73 KiB |
| Average | 0.353 s | 0.384 s | +0.031 s | 3.93 MiB | 4.08 MiB | + 152.82 KiB |
Code Statistics
Note: Third-party libraries and minified JS/CSS files are excluded from these statistics where possible, so the numbers you see here may be lower than those reported by other tools.
| Language | % | Lines of code | Comment lines | Files | |
|---|---|---|---|---|---|
| PHP | 71.5% | 4,749 | 2,170 | 24 | |
| CSS | 16.8% | 1,115 | 0 | 2 | |
| JavaScript | 11.7% | 776 | 34 | 1 | |
| SVG | 0.1% | 4 | 0 | 2 | |
| Total | 6,644 | 2,204 | 29 | ||
PHP Code Analysis | More results »
| Lines of code | 3,951 |
|---|---|
| Total complexity | 832 |
| Median class complexity | 22.0 |
| Median method complexity | 3.0 |
| Most complex class | MFM\DB_Handler |
| Most complex function | MFM\DB_Handler::compare_and_report_directory_changes() |
| Classes | 21 |
|---|---|
| Methods | 164 |
| Functions | 0 |
Additions
Things that the plugin adds to the site. This section is not intended to be comprehensive. The test tool only looks for a few specific types of added content.
Database Tables 6
- wp_mfm_events
- wp_mfm_events_metadata
- wp_mfm_scanned_directories
- wp_mfm_scanned_files
- wp_mfm_stored_directories
- wp_mfm_stored_files
Options wp_options 3
- mfm_active_version
- mfm_initial_setup_needed
- mfm_permissions_column_created
PHP Error Log
The log file is empty.