Melapress File Monitor 2.0.2
Does Melapress File Monitor work with WordPress 6.6.2 and PHP 8.1.12? A smoke test was performed on .
Summary
| No PHP errors, warnings or notices | |
| No JavaScript exceptions | |
| All test pages loaded successfully | |
| No resource errors | |
| Looks good! No problems were detected. |
Memory usage: 149.93 KiB
The average PHP memory usage increased by this amount after activating by the plugin.
Page speed impact:
insignificant.
The plugin didn't make the site noticeably slower.
| WordPress version | 6.6.2 |
|---|---|
| PHP version | 8.1.12 |
| MySQL version | 10.6.10 |
| PHP memory limit | 512M |
| Last updated | |
|---|---|
| Active installs | 5,000+ |
| WordPress.org page | https://wordpress.org/plugins/website-file-changes-monitor/ |
| Badges |
|
Pages 13
File Monitoring ‹ Test site — WordPress

| URL | /wp-admin/admin.php?page=file-monitor-admin |
|---|---|
| Requested URL | /wp-admin/plugins.php?action=activate&plugin=website-file-changes-monitor%2Fwebsite-file-changes-monitor.php&plugin_status=all&paged=1&s&_wpnonce=5465b02c54 |
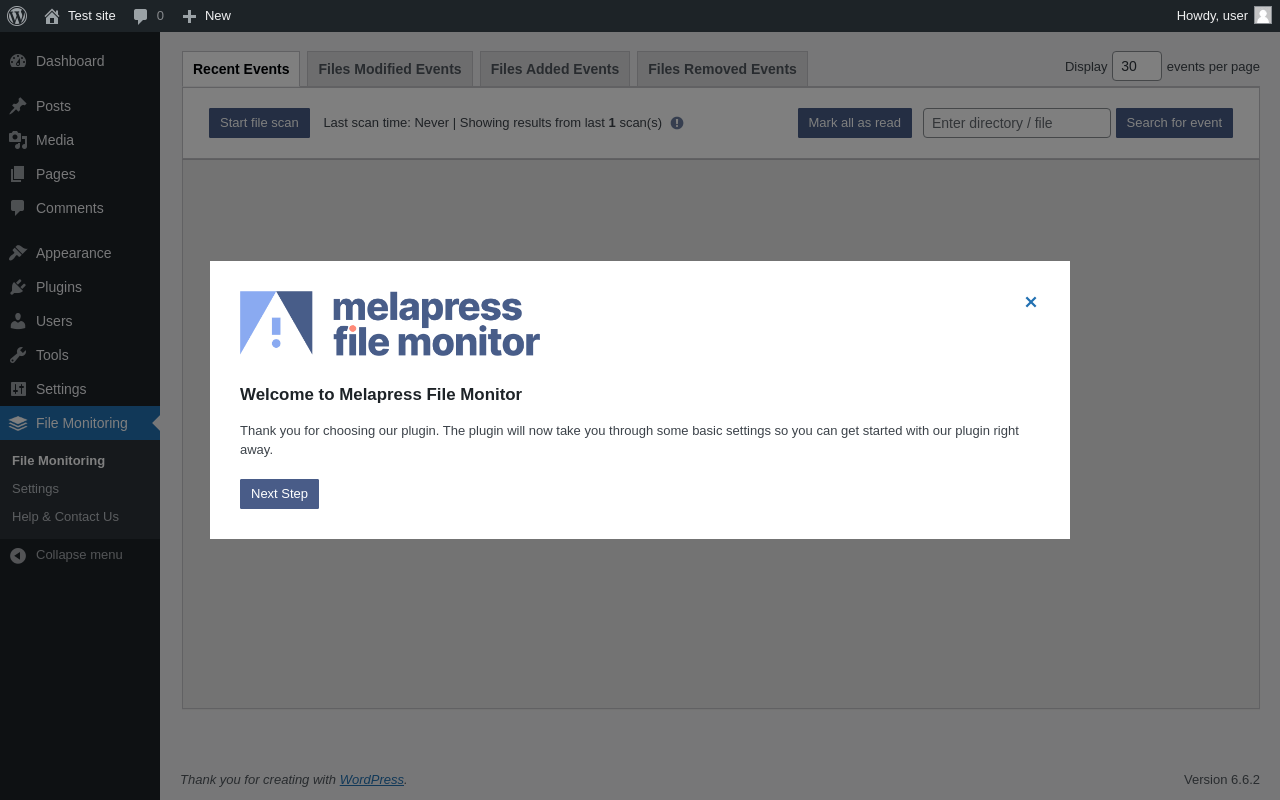
| Aspect | after-activation |
| HTTP status | 200 |
| Load time | 0.543 s |
| Memory usage | 5.79 MiB |
| JS errors | None |
| Resource errors | None |
File Monitoring
| URL | /wp-admin/admin.php?page=file-monitor-admin |
|---|---|
| Aspect | menu-item |
| HTTP status | 200 |
| Load time | 0.190 s |
| Memory usage | 5.21 MiB |
| JS errors | None |
| Resource errors | None |
File Monitoring → Files Modified Events

| URL | /wp-admin/admin.php?page=file-monitor-admin&tab=modified-events |
|---|---|
| Aspect | menu-item-tab |
| HTTP status | 200 |
| Load time | 0.187 s |
| Memory usage | 5.21 MiB |
| JS errors | None |
| Resource errors | None |
File Monitoring → Files Added Events

| URL | /wp-admin/admin.php?page=file-monitor-admin&tab=added-events |
|---|---|
| Aspect | menu-item-tab |
| HTTP status | 200 |
| Load time | 0.175 s |
| Memory usage | 5.21 MiB |
| JS errors | None |
| Resource errors | None |
File Monitoring → Files Removed Events

| URL | /wp-admin/admin.php?page=file-monitor-admin&tab=removed-events |
|---|---|
| Aspect | menu-item-tab |
| HTTP status | 200 |
| Load time | 0.170 s |
| Memory usage | 5.21 MiB |
| JS errors | None |
| Resource errors | None |
File Monitoring → Settings

| URL | /wp-admin/admin.php?page=file-monitor-settings |
|---|---|
| Aspect | menu-item |
| HTTP status | 200 |
| Load time | 0.220 s |
| Memory usage | 3.6 MiB |
| JS errors | None |
| Resource errors | None |
File Monitoring → Settings → WordPress core

| URL | /wp-admin/admin.php?page=file-monitor-settings&tab=core-preferences |
|---|---|
| Aspect | menu-item-tab |
| HTTP status | 200 |
| Load time | 0.215 s |
| Memory usage | 3.6 MiB |
| JS errors | None |
| Resource errors | None |
File Monitoring → Settings → Notifications

| URL | /wp-admin/admin.php?page=file-monitor-settings&tab=notification-preferences |
|---|---|
| Aspect | menu-item-tab |
| HTTP status | 200 |
| Load time | 0.321 s |
| Memory usage | 3.6 MiB |
| JS errors | None |
| Resource errors | None |
File Monitoring → Settings → Logging & Debugging

| URL | /wp-admin/admin.php?page=file-monitor-settings&tab=debugging-preferences |
|---|---|
| Aspect | menu-item-tab |
| HTTP status | 200 |
| Load time | 0.210 s |
| Memory usage | 3.6 MiB |
| JS errors | None |
| Resource errors | None |
File Monitoring → Help & Contact Us
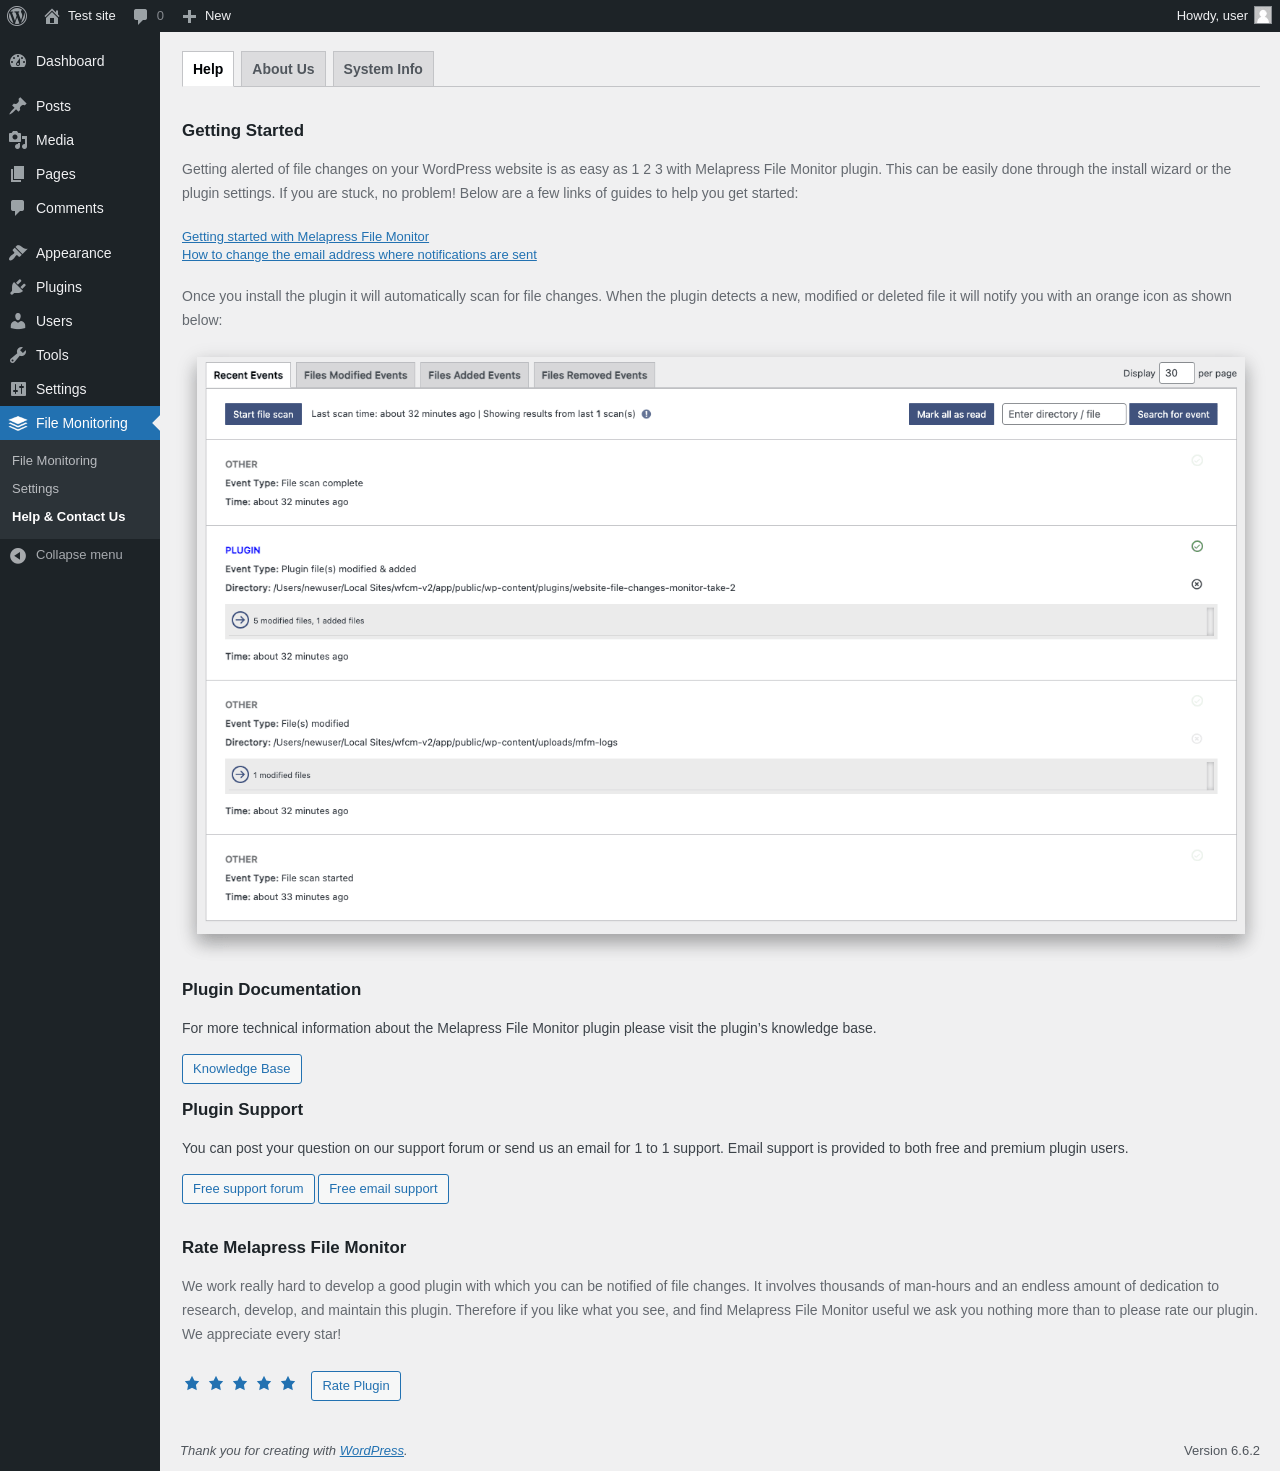
| URL | /wp-admin/admin.php?page=file-monitor-help |
|---|---|
| Aspect | menu-item |
| HTTP status | 200 |
| Load time | 0.253 s |
| Memory usage | 3.64 MiB |
| JS errors | None |
| Resource errors | None |
File Monitoring → Help & Contact Us → About Us

| URL | /wp-admin/admin.php?page=file-monitor-help&tab=about |
|---|---|
| Aspect | menu-item-tab |
| HTTP status | 200 |
| Load time | 0.186 s |
| Memory usage | 3.6 MiB |
| JS errors | None |
| Resource errors | None |
File Monitoring → Help & Contact Us → System Info

| URL | /wp-admin/admin.php?page=file-monitor-help&tab=system-info |
|---|---|
| Aspect | menu-item-tab |
| HTTP status | 200 |
| Load time | 0.183 s |
| Memory usage | 3.6 MiB |
| JS errors | None |
| Resource errors | None |
Test site – Just another WordPress site

| URL | / |
|---|---|
| Aspect | front-page |
| HTTP status | 200 |
| Load time | 0.242 s |
| Memory usage | 3.49 MiB |
| JS errors | None |
| Resource errors | None |
Benchmark
| URL | Load time | Memory usage | ||||
|---|---|---|---|---|---|---|
| Inactive | Active | Change | Inactive | Active | Change | |
| /wp-admin/index.php | 0.336 s | 0.413 s | +0.077 s | 3.47 MiB | 3.63 MiB | + 165.21 KiB |
| /wp-admin/edit.php | 0.208 s | 0.207 s | -0.001 s | 3.54 MiB | 3.7 MiB | + 165.22 KiB |
| /wp-admin/post-new.php | 0.736 s | 0.928 s | +0.192 s | 5.75 MiB | 5.88 MiB | + 133.41 KiB |
| /wp-admin/upload.php | 0.684 s | 0.361 s | -0.323 s | 3.49 MiB | 3.63 MiB | + 148.18 KiB |
| /wp-admin/options-writing.php | 0.217 s | 0.187 s | -0.030 s | 3.41 MiB | 3.6 MiB | + 190.98 KiB |
| /wp-admin/media-new.php | 0.218 s | 0.455 s | +0.237 s | 3.4 MiB | 3.6 MiB | + 204.37 KiB |
| /wp-admin/edit-tags.php?taxonomy=category | 0.199 s | 0.198 s | -0.001 s | 3.47 MiB | 3.62 MiB | + 151.04 KiB |
| /wp-admin/post-new.php?post_type=page | 0.589 s | 0.604 s | +0.015 s | 5.75 MiB | 5.87 MiB | + 128.65 KiB |
| /wp-admin/options-discussion.php | 0.208 s | 0.257 s | +0.049 s | 3.41 MiB | 3.6 MiB | + 192.67 KiB |
| /wp-admin/edit-comments.php | 0.425 s | 0.212 s | -0.213 s | 3.49 MiB | 3.61 MiB | + 128.17 KiB |
| / | 0.328 s | 0.193 s | -0.135 s | 3.45 MiB | 3.49 MiB | + 41.3 KiB |
| Average | 0.377 s | 0.365 s | -0.012 s | 3.88 MiB | 4.02 MiB | + 149.93 KiB |
Code Statistics
Note: Third-party libraries and minified JS/CSS files are excluded from these statistics where possible, so the numbers you see here may be lower than those reported by other tools.
| Language | % | Lines of code | Comment lines | Files | |
|---|---|---|---|---|---|
| PHP | 66.7% | 3,703 | 1,227 | 23 | |
| CSS | 20.0% | 1,109 | 0 | 1 | |
| JavaScript | 13.3% | 741 | 34 | 1 | |
| SVG | 0.0% | 1 | 0 | 1 | |
| Total | 5,554 | 1,261 | 26 | ||
PHP Code Analysis | More results »
| Lines of code | 2,943 |
|---|---|
| Total complexity | 619 |
| Median class complexity | 22.5 |
| Median method complexity | 3.0 |
| Most complex class | MFM\DB_Handler |
| Most complex function | MFM\DB_Handler::compare_file_changes() |
| Classes | 20 |
|---|---|
| Methods | 121 |
| Functions | 0 |
Additions
Things that the plugin adds to the site. This section is not intended to be comprehensive. The test tool only looks for a few specific types of added content.
Database Tables 6
- wp_mfm_events
- wp_mfm_events_metadata
- wp_mfm_scanned_directories
- wp_mfm_scanned_files
- wp_mfm_stored_directories
- wp_mfm_stored_files
Options wp_options 1
- mfm_initial_setup_needed
PHP Error Log
The log file is empty.