Melapress File Monitor 2.0.0
Does Melapress File Monitor work with WordPress 6.4.3 and PHP 8.1.12? A smoke test was performed on .
Summary
| No PHP errors, warnings or notices | |
| No JavaScript exceptions | |
| All test pages loaded successfully | |
| No resource errors | |
| Looks good! No problems were detected. |
Memory usage: 133.5 KiB
The average PHP memory usage increased by this amount after activating by the plugin.
Page speed impact:
0.021 seconds
The average page load time increased by this amount after activating the plugin.
| WordPress version | 6.4.3 |
|---|---|
| PHP version | 8.1.12 |
| MySQL version | 10.6.10 |
| PHP memory limit | 512M |
| Last updated | |
|---|---|
| Active installs | 5,000+ |
| WordPress.org page | https://wordpress.org/plugins/website-file-changes-monitor/ |
| Badges |
|
Pages 13
File Monitoring ‹ Test site — WordPress
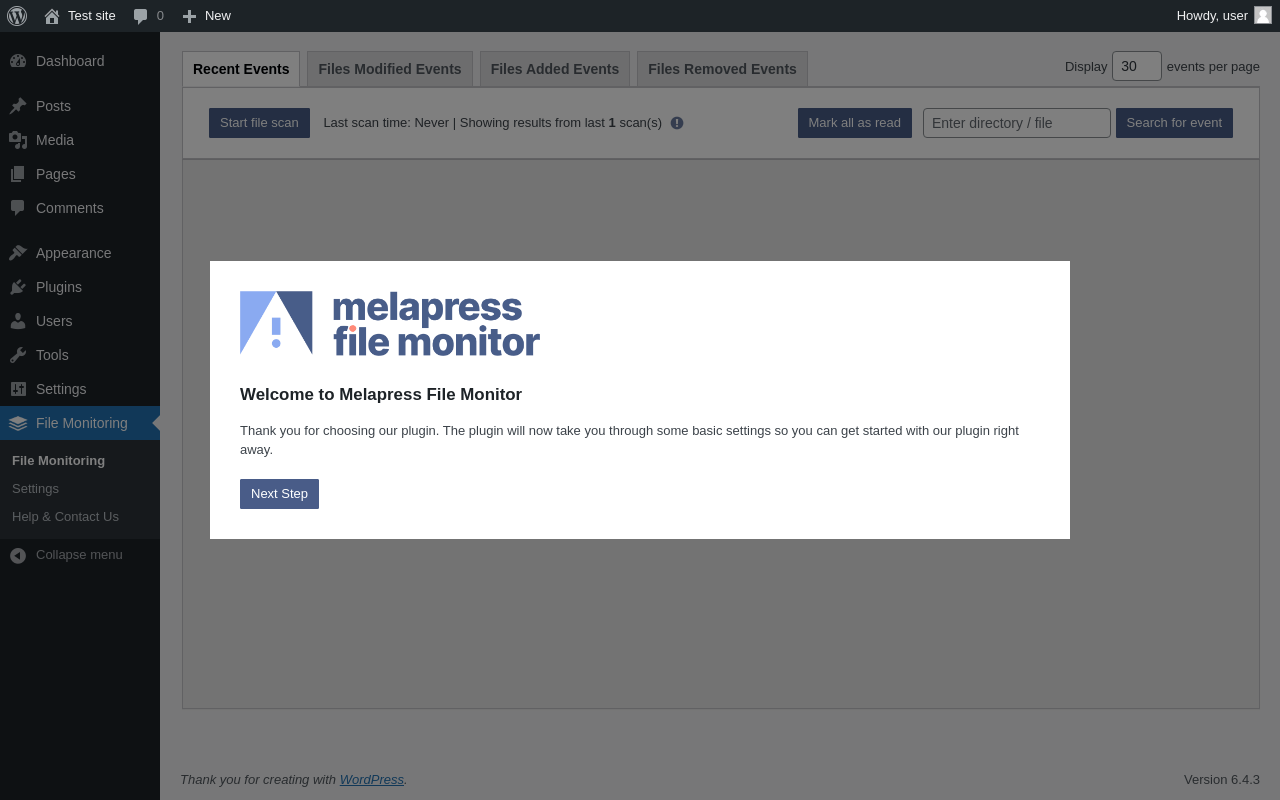
| URL | /wp-admin/admin.php?page=file-monitor-admin |
|---|---|
| Requested URL | /wp-admin/plugins.php?action=activate&plugin=website-file-changes-monitor%2Fwebsite-file-changes-monitor.php&plugin_status=all&paged=1&s&_wpnonce=bc7285edb7 |
| Aspect | after-activation |
| HTTP status | 200 |
| Load time | 0.635 s |
| Memory usage | 5.65 MiB |
| JS errors | None |
| Resource errors | None |
File Monitoring

| URL | /wp-admin/admin.php?page=file-monitor-admin |
|---|---|
| Aspect | menu-item |
| HTTP status | 200 |
| Load time | 0.185 s |
| Memory usage | 5.07 MiB |
| JS errors | None |
| Resource errors | None |
File Monitoring → Files Modified Events

| URL | /wp-admin/admin.php?page=file-monitor-admin&tab=modified-events |
|---|---|
| Aspect | menu-item-tab |
| HTTP status | 200 |
| Load time | 0.173 s |
| Memory usage | 5.07 MiB |
| JS errors | None |
| Resource errors | None |
File Monitoring → Files Added Events

| URL | /wp-admin/admin.php?page=file-monitor-admin&tab=added-events |
|---|---|
| Aspect | menu-item-tab |
| HTTP status | 200 |
| Load time | 0.173 s |
| Memory usage | 5.07 MiB |
| JS errors | None |
| Resource errors | None |
File Monitoring → Files Removed Events

| URL | /wp-admin/admin.php?page=file-monitor-admin&tab=removed-events |
|---|---|
| Aspect | menu-item-tab |
| HTTP status | 200 |
| Load time | 0.192 s |
| Memory usage | 5.07 MiB |
| JS errors | None |
| Resource errors | None |
File Monitoring → Settings

| URL | /wp-admin/admin.php?page=file-monitor-settings |
|---|---|
| Aspect | menu-item |
| HTTP status | 200 |
| Load time | 0.228 s |
| Memory usage | 3.44 MiB |
| JS errors | None |
| Resource errors | None |
File Monitoring → Settings → WordPress core

| URL | /wp-admin/admin.php?page=file-monitor-settings&tab=core-preferences |
|---|---|
| Aspect | menu-item-tab |
| HTTP status | 200 |
| Load time | 0.208 s |
| Memory usage | 3.44 MiB |
| JS errors | None |
| Resource errors | None |
File Monitoring → Settings → Notifications

| URL | /wp-admin/admin.php?page=file-monitor-settings&tab=notification-preferences |
|---|---|
| Aspect | menu-item-tab |
| HTTP status | 200 |
| Load time | 0.216 s |
| Memory usage | 3.44 MiB |
| JS errors | None |
| Resource errors | None |
File Monitoring → Settings → Logging & Debugging

| URL | /wp-admin/admin.php?page=file-monitor-settings&tab=debugging-preferences |
|---|---|
| Aspect | menu-item-tab |
| HTTP status | 200 |
| Load time | 0.208 s |
| Memory usage | 3.44 MiB |
| JS errors | None |
| Resource errors | None |
File Monitoring → Help & Contact Us
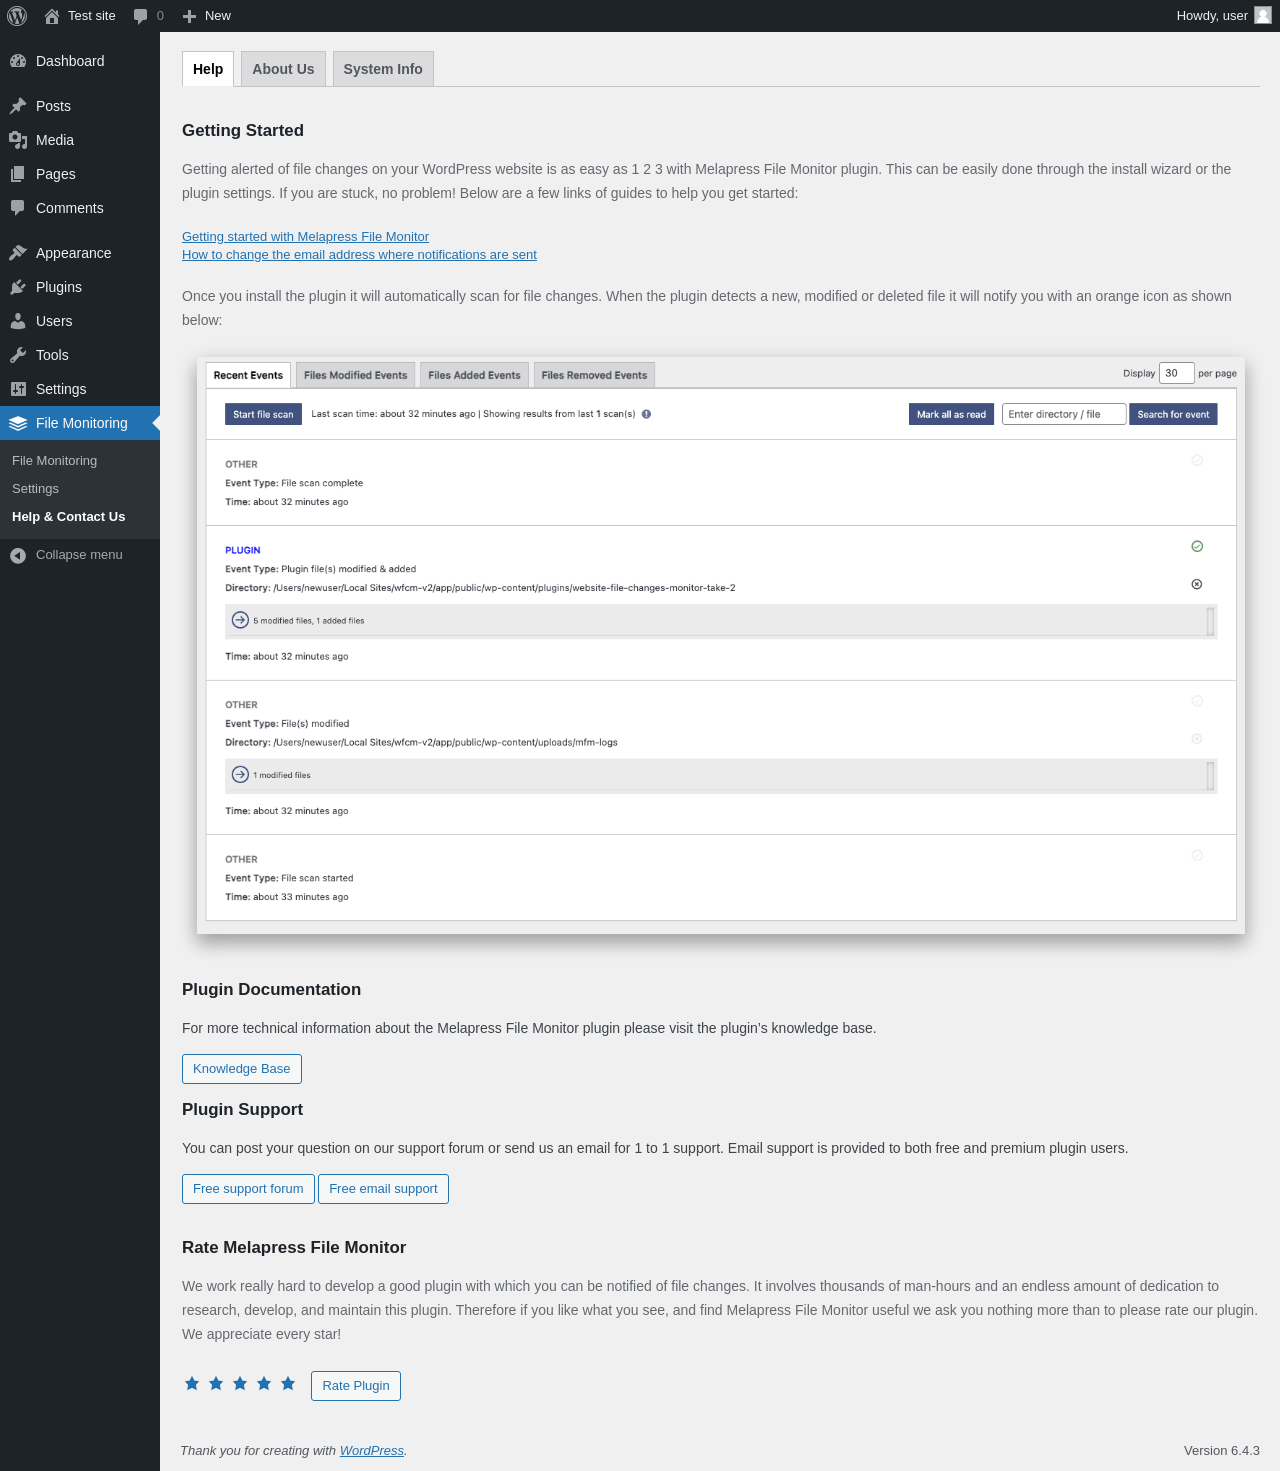
| URL | /wp-admin/admin.php?page=file-monitor-help |
|---|---|
| Aspect | menu-item |
| HTTP status | 200 |
| Load time | 0.383 s |
| Memory usage | 3.52 MiB |
| JS errors | None |
| Resource errors | None |
File Monitoring → Help & Contact Us → About Us

| URL | /wp-admin/admin.php?page=file-monitor-help&tab=about |
|---|---|
| Aspect | menu-item-tab |
| HTTP status | 200 |
| Load time | 0.214 s |
| Memory usage | 3.44 MiB |
| JS errors | None |
| Resource errors | None |
File Monitoring → Help & Contact Us → System Info

| URL | /wp-admin/admin.php?page=file-monitor-help&tab=system-info |
|---|---|
| Aspect | menu-item-tab |
| HTTP status | 200 |
| Load time | 0.182 s |
| Memory usage | 3.44 MiB |
| JS errors | None |
| Resource errors | None |
Test site – Just another WordPress site

| URL | / |
|---|---|
| Aspect | front-page |
| HTTP status | 200 |
| Load time | 0.218 s |
| Memory usage | 3.4 MiB |
| JS errors | None |
| Resource errors | None |
Benchmark
| URL | Load time | Memory usage | ||||
|---|---|---|---|---|---|---|
| Inactive | Active | Change | Inactive | Active | Change | |
| /wp-admin/index.php | 0.313 s | 0.410 s | +0.097 s | 3.38 MiB | 3.52 MiB | + 141.89 KiB |
| /wp-admin/edit.php | 0.207 s | 0.193 s | -0.014 s | 3.41 MiB | 3.54 MiB | + 140.73 KiB |
| /wp-admin/post-new.php | 0.882 s | 0.915 s | +0.033 s | 5.46 MiB | 5.59 MiB | + 131.11 KiB |
| /wp-admin/upload.php | 0.554 s | 0.555 s | +0.001 s | 3.32 MiB | 3.47 MiB | + 144.55 KiB |
| /wp-admin/options-writing.php | 0.213 s | 0.280 s | +0.067 s | 3.32 MiB | 3.45 MiB | + 137.13 KiB |
| /wp-admin/media-new.php | 0.297 s | 0.320 s | +0.023 s | 3.3 MiB | 3.45 MiB | + 156.73 KiB |
| /wp-admin/edit-tags.php?taxonomy=category | 0.200 s | 0.193 s | -0.007 s | 3.31 MiB | 3.47 MiB | + 161.91 KiB |
| /wp-admin/post-new.php?post_type=page | 0.574 s | 0.611 s | +0.037 s | 5.45 MiB | 5.57 MiB | + 126.35 KiB |
| /wp-admin/options-discussion.php | 0.288 s | 0.304 s | +0.016 s | 3.3 MiB | 3.45 MiB | + 145.35 KiB |
| /wp-admin/edit-comments.php | 0.286 s | 0.222 s | -0.064 s | 3.34 MiB | 3.48 MiB | + 144.55 KiB |
| / | 0.271 s | 0.310 s | +0.039 s | 3.36 MiB | 3.4 MiB | + 38.16 KiB |
| Average | 0.371 s | 0.392 s | +0.021 s | 3.72 MiB | 3.85 MiB | + 133.5 KiB |
Code Statistics
Note: Third-party libraries and minified JS/CSS files are excluded from these statistics where possible, so the numbers you see here may be lower than those reported by other tools.
| Language | % | Lines of code | Comment lines | Files | |
|---|---|---|---|---|---|
| PHP | 66.6% | 3,574 | 1,207 | 24 | |
| CSS | 20.5% | 1,100 | 0 | 1 | |
| JavaScript | 12.8% | 689 | 30 | 1 | |
| SVG | 0.0% | 1 | 0 | 1 | |
| Total | 5,364 | 1,237 | 27 | ||
PHP Code Analysis | More results »
| Lines of code | 2,862 |
|---|---|
| Total complexity | 601 |
| Median class complexity | 22.5 |
| Median method complexity | 3.0 |
| Most complex class | MFM\DB_Handler |
| Most complex function | MFM\DB_Handler::compare_file_changes() |
| Classes | 20 |
|---|---|
| Methods | 119 |
| Functions | 0 |
Additions
Things that the plugin adds to the site. This section is not intended to be comprehensive. The test tool only looks for a few specific types of added content.
Database Tables 6
- wp_mfm_events
- wp_mfm_events_metadata
- wp_mfm_scanned_directories
- wp_mfm_scanned_files
- wp_mfm_stored_directories
- wp_mfm_stored_files
Options wp_options 1
- mfm_initial_setup_needed
PHP Error Log
The log file is empty.