Traffic 1.6.0
Does Traffic work with WordPress 5.4 and PHP 7.2.16? A smoke test was performed on .
Summary
Errors
| No PHP errors, warnings or notices | |
| No JavaScript exceptions | |
| All test pages loaded successfully | |
| No resource errors | |
| Looks good! No problems were detected. |
Performance
Memory usage: 149.45 KiB
The average PHP memory usage increased by this amount after activating by the plugin.
Page speed impact:
insignificant.
The plugin didn't make the site noticeably slower.
Environment
| WordPress version | 5.4 |
|---|---|
| PHP version | 7.2.16 |
| MySQL version | 8.0.15 |
| PHP memory limit | 256M |
Plugin Info
| Last updated | |
|---|---|
| Active installs | 200+ |
| WordPress.org page | https://wordpress.org/plugins/traffic/ |
| Badges |
|
Pages 7
Plugins ‹ Test site — WordPress

| URL | /wp-admin/plugins.php?plugin_status=all&paged=1&s |
|---|---|
| Requested URL | /wp-admin/plugins.php?action=activate&plugin=traffic%2Ftraffic.php&plugin_status=all&paged=1&s&_wpnonce=83c6c9b7fc |
| Aspect | after-activation |
| HTTP status | 200 |
| Load time | 0.484 s |
| Memory usage | 3.86 MiB |
| JS errors | None |
| Resource errors | None |
PerfOps Settings

| URL | /wp-admin/admin.php?page=perfopsone-settings |
|---|---|
| Aspect | menu-item |
| HTTP status | 200 |
| Load time | 0.262 s |
| Memory usage | 4.1 MiB |
| JS errors | None |
| Resource errors | None |
PerfOps Settings → Traffic
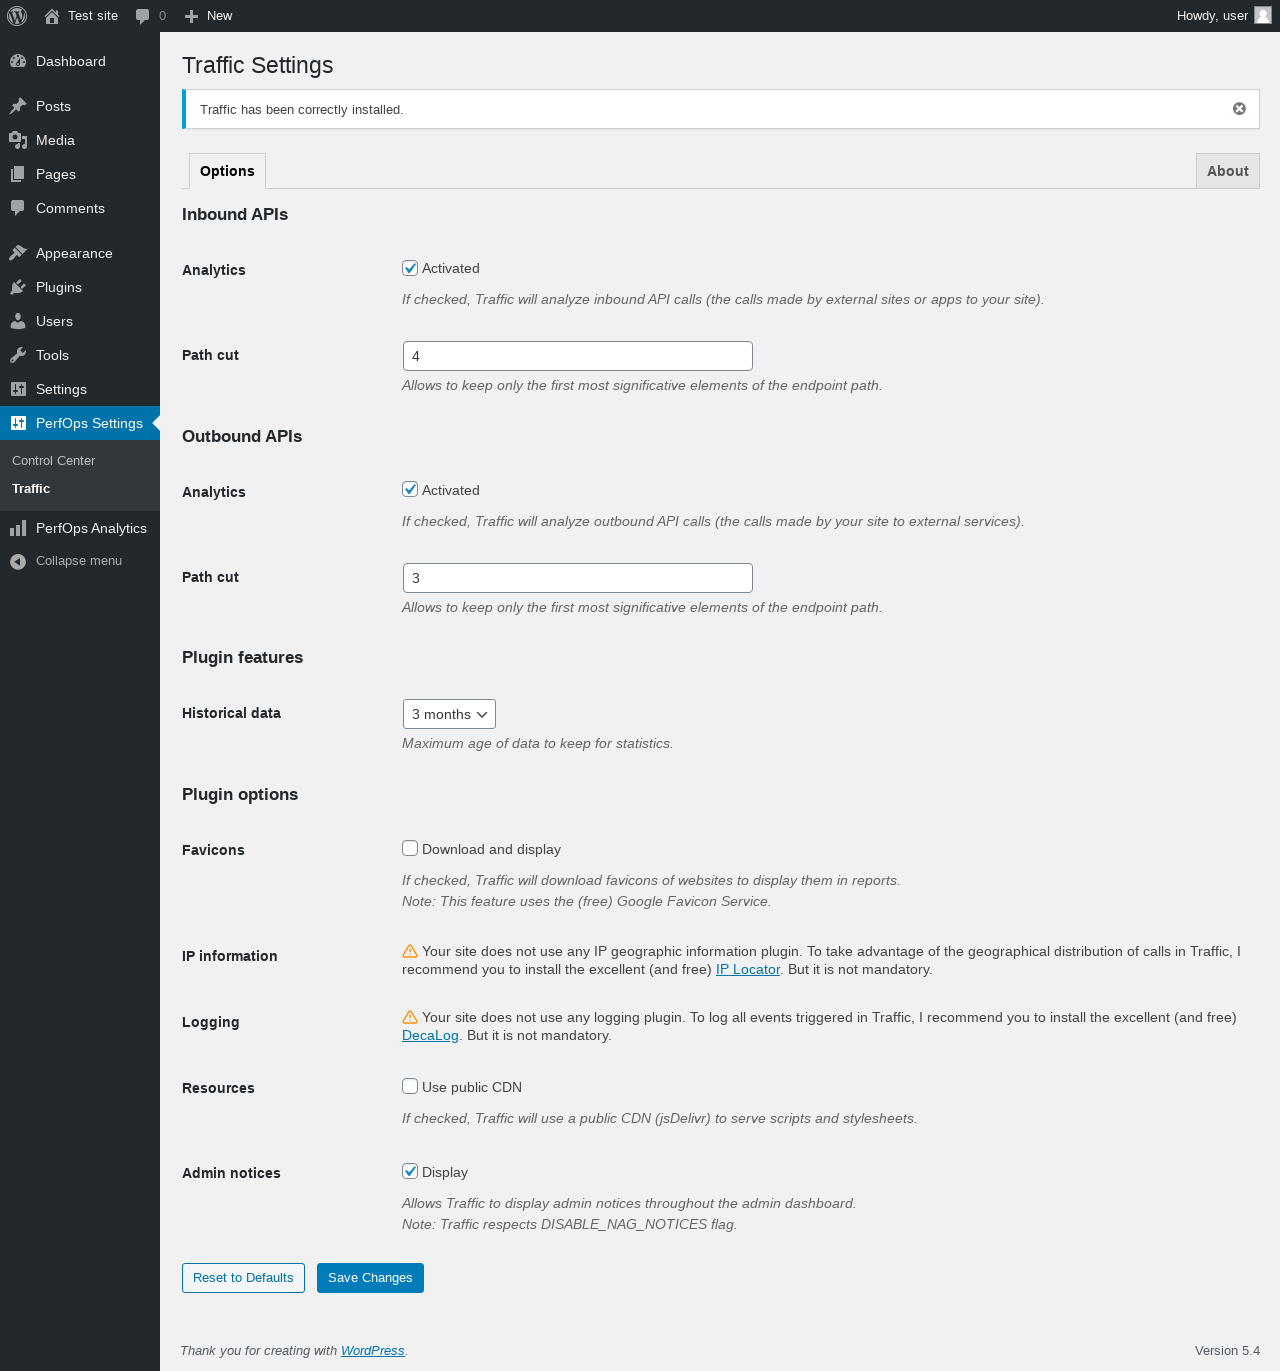
| URL | /wp-admin/admin.php?page=traffic-settings |
|---|---|
| Aspect | menu-item |
| HTTP status | 200 |
| Load time | 0.151 s |
| Memory usage | 3.91 MiB |
| JS errors | None |
| Resource errors | None |
PerfOps Settings → Traffic → About

| URL | /wp-admin/admin.php?page=traffic-settings&tab=about |
|---|---|
| Aspect | menu-item-tab |
| HTTP status | 200 |
| Load time | 0.188 s |
| Memory usage | 4.42 MiB |
| JS errors | None |
| Resource errors | None |
PerfOps Analytics

| URL | /wp-admin/admin.php?page=perfopsone-analytics |
|---|---|
| Aspect | menu-item |
| HTTP status | 200 |
| Load time | 0.164 s |
| Memory usage | 3.64 MiB |
| JS errors | None |
| Resource errors | None |
PerfOps Analytics → API Traffic

| URL | /wp-admin/admin.php?page=traffic-viewer |
|---|---|
| Aspect | menu-item |
| HTTP status | 200 |
| Load time | 0.927 s |
| Memory usage | 4.83 MiB |
| JS errors | None |
| Resource errors | None |
Test site – Just another WordPress site

| URL | / |
|---|---|
| Aspect | front-page |
| HTTP status | 200 |
| Load time | 0.279 s |
| Memory usage | 3.39 MiB |
| JS errors | None |
| Resource errors | None |
Benchmark
| URL | Load time | Memory usage | ||||
|---|---|---|---|---|---|---|
| Inactive | Active | Change | Inactive | Active | Change | |
| /wp-admin/index.php | 0.330 s | 0.283 s | -0.047 s | 3.64 MiB | 3.8 MiB | + 162.52 KiB |
| /wp-admin/edit.php | 0.207 s | 0.241 s | +0.034 s | 3.66 MiB | 3.82 MiB | + 162.55 KiB |
| /wp-admin/post-new.php | 1.304 s | 1.782 s | +0.478 s | 5.43 MiB | 5.61 MiB | + 186.84 KiB |
| /wp-admin/upload.php | 0.724 s | 0.444 s | -0.280 s | 3.5 MiB | 3.71 MiB | + 215.9 KiB |
| /wp-admin/options-writing.php | 0.179 s | 0.152 s | -0.027 s | 3.58 MiB | 3.71 MiB | + 132.77 KiB |
| /wp-admin/media-new.php | 0.219 s | 0.196 s | -0.023 s | 3.48 MiB | 3.64 MiB | + 162.4 KiB |
| /wp-admin/edit-tags.php?taxonomy=category | 0.197 s | 0.200 s | +0.003 s | 3.58 MiB | 3.74 MiB | + 162.5 KiB |
| /wp-admin/post-new.php?post_type=page | 1.122 s | 1.287 s | +0.165 s | 5.42 MiB | 5.59 MiB | + 180.02 KiB |
| /wp-admin/options-discussion.php | 0.495 s | 0.292 s | -0.203 s | 3.48 MiB | 3.64 MiB | + 162.69 KiB |
| /wp-admin/edit-comments.php | 0.224 s | 0.222 s | -0.002 s | 3.59 MiB | 3.75 MiB | + 161.45 KiB |
| / | 0.357 s | 0.210 s | -0.147 s | 3.43 MiB | 3.39 MiB | - 45.74 KiB |
| Average | 0.487 s | 0.483 s | -0.004 s | 3.89 MiB | 4.04 MiB | + 149.45 KiB |
Additions
Things that the plugin adds to the site. This section is not intended to be comprehensive. The test tool only looks for a few specific types of added content.
Database Tables 1
- wp_traffic_statistics
Options wp_options 2
- traffic_nags
- traffic_version
PHP Error Log
The log file is empty.