SiteGround Optimizer 7.1.3
Does SiteGround Optimizer work with WordPress 6.0 and PHP 7.4.8? A smoke test was performed on .
Summary
| No PHP errors, warnings or notices | |
| No JavaScript exceptions | |
| All test pages loaded successfully | |
| No resource errors | |
| Looks good! No problems were detected. |
Memory usage: 351.62 KiB
The average PHP memory usage increased by this amount after activating by the plugin.
Page speed impact:
insignificant.
The plugin didn't make the site noticeably slower.
| WordPress version | 6.0 |
|---|---|
| PHP version | 7.4.8 |
| MySQL version | 8.0.21 |
| PHP memory limit | 256M |
| Last updated | |
|---|---|
| Active installs | 1,000,000+ |
| WordPress.org page | https://wordpress.org/plugins/sg-cachepress/ |
| Badges |
|
Pages 9
Plugins ‹ Test site — WordPress
| URL | /wp-admin/plugins.php?plugin_status=all&paged=1&s |
|---|---|
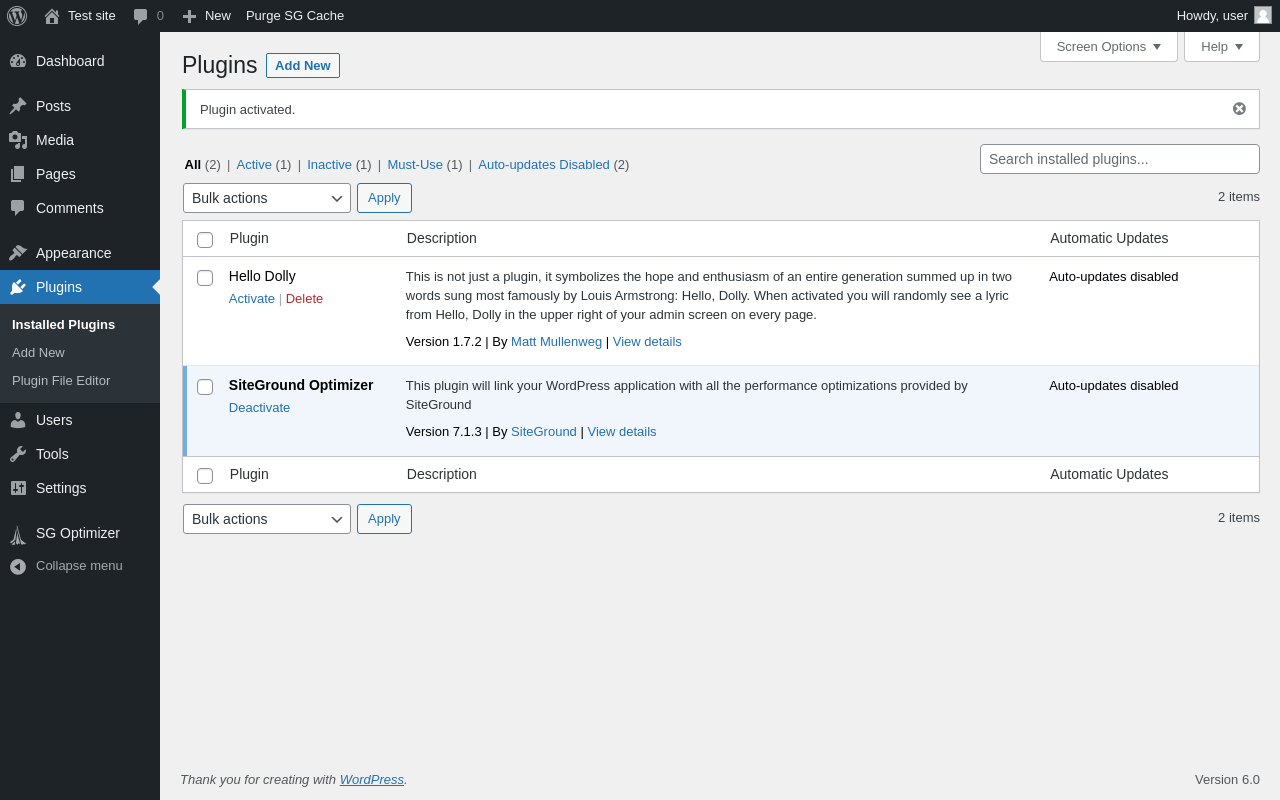
| Requested URL | /wp-admin/plugins.php?action=activate&plugin=sg-cachepress%2Fsg-cachepress.php&plugin_status=all&paged=1&s&_wpnonce=352ccda369 |
| Aspect | after-activation |
| HTTP status | 200 |
| Load time | 0.362 s |
| Memory usage | 4.01 MiB |
| JS errors | None |
| Resource errors | None |
Settings → SG Plugins

| URL | /wp-admin/options-general.php?page=siteground_settings |
|---|---|
| Aspect | menu-item |
| HTTP status | 200 |
| Load time | 0.138 s |
| Memory usage | 3.91 MiB |
| JS errors | None |
| Resource errors | None |
SG Optimizer

| URL | /wp-admin/admin.php?page=sg-cachepress |
|---|---|
| Aspect | menu-item |
| HTTP status | 200 |
| Load time | 0.969 s |
| Memory usage | 4 MiB |
| JS errors | None |
| Resource errors | None |
SG Optimizer → Caching

| URL | /wp-admin/admin.php?page=sgo_caching |
|---|---|
| Aspect | menu-item |
| HTTP status | 200 |
| Load time | 0.459 s |
| Memory usage | 3.99 MiB |
| JS errors | None |
| Resource errors | None |
SG Optimizer → Environment

| URL | /wp-admin/admin.php?page=sgo_environment |
|---|---|
| Aspect | menu-item |
| HTTP status | 200 |
| Load time | 0.416 s |
| Memory usage | 3.99 MiB |
| JS errors | None |
| Resource errors | None |
SG Optimizer → Frontend

| URL | /wp-admin/admin.php?page=sgo_frontend |
|---|---|
| Aspect | menu-item |
| HTTP status | 200 |
| Load time | 0.532 s |
| Memory usage | 3.99 MiB |
| JS errors | None |
| Resource errors | None |
SG Optimizer → Media

| URL | /wp-admin/admin.php?page=sgo_media |
|---|---|
| Aspect | menu-item |
| HTTP status | 200 |
| Load time | 0.549 s |
| Memory usage | 3.99 MiB |
| JS errors | None |
| Resource errors | None |
SG Optimizer → Speed Test

| URL | /wp-admin/admin.php?page=sgo_analysis |
|---|---|
| Aspect | menu-item |
| HTTP status | 200 |
| Load time | 0.325 s |
| Memory usage | 3.99 MiB |
| JS errors | None |
| Resource errors | None |
Test site – Just another WordPress site

| URL | / |
|---|---|
| Aspect | front-page |
| HTTP status | 200 |
| Load time | 0.227 s |
| Memory usage | 3.86 MiB |
| JS errors | None |
| Resource errors | None |
Benchmark
| URL | Load time | Memory usage | ||||
|---|---|---|---|---|---|---|
| Inactive | Active | Change | Inactive | Active | Change | |
| /wp-admin/index.php | 0.375 s | 0.266 s | -0.109 s | 3.72 MiB | 4.04 MiB | + 326.05 KiB |
| /wp-admin/edit.php | 0.174 s | 0.184 s | +0.010 s | 3.75 MiB | 4.07 MiB | + 326.02 KiB |
| /wp-admin/post-new.php | 0.720 s | 0.971 s | +0.251 s | 5.53 MiB | 6.01 MiB | + 483.79 KiB |
| /wp-admin/upload.php | 0.376 s | 0.460 s | +0.084 s | 3.68 MiB | 4 MiB | + 325.85 KiB |
| /wp-admin/options-writing.php | 0.260 s | 0.153 s | -0.107 s | 3.61 MiB | 3.91 MiB | + 306.05 KiB |
| /wp-admin/media-new.php | 0.281 s | 0.193 s | -0.088 s | 3.66 MiB | 3.98 MiB | + 325.97 KiB |
| /wp-admin/edit-tags.php?taxonomy=category | 0.181 s | 0.180 s | -0.001 s | 3.68 MiB | 4 MiB | + 326.88 KiB |
| /wp-admin/post-new.php?post_type=page | 0.672 s | 0.601 s | -0.071 s | 5.53 MiB | 5.99 MiB | + 475.38 KiB |
| /wp-admin/options-discussion.php | 0.243 s | 0.274 s | +0.031 s | 3.59 MiB | 3.91 MiB | + 326.22 KiB |
| /wp-admin/edit-comments.php | 0.208 s | 0.188 s | -0.020 s | 3.69 MiB | 4.01 MiB | + 325.2 KiB |
| / | 0.407 s | 0.199 s | -0.208 s | 3.55 MiB | 3.86 MiB | + 320.38 KiB |
| Average | 0.354 s | 0.334 s | -0.021 s | 4 MiB | 4.34 MiB | + 351.62 KiB |
Code Statistics
Note: Third-party libraries and minified JS/CSS files are excluded from these statistics where possible, so the numbers you see here may be lower than those reported by other tools.
| Language | % | Lines of code | Comment lines | Files | |
|---|---|---|---|---|---|
| PHP | 83.6% | 10,535 | 6,647 | 112 | |
| SVG | 9.8% | 1,235 | 0 | 583 | |
| CSS | 4.6% | 574 | 17 | 1 | |
| JavaScript | 1.3% | 161 | 199 | 2 | |
| Sass | 0.7% | 90 | 0 | 1 | |
| Total | 12,595 | 6,863 | 699 | ||
PHP Code Analysis | More results »
| Lines of code | 10,306 |
|---|---|
| Total complexity | 1,775 |
| Median class complexity | 6.0 |
| Median method complexity | 2.5 |
| Most complex class | SiteGround_Optimizer\File_Cacher\File_Cacher |
| Most complex function | SiteGround_Optimizer\Analysis\Analysis::process_analysis() |
| Classes | 103 |
|---|---|
| Methods | 528 |
| Functions | 2 |
Additions
Things that the plugin adds to the site. This section is not intended to be comprehensive. The test tool only looks for a few specific types of added content.
Options wp_options 7
- siteground_optimizer_excluded_lazy_load_media_types
- siteground_optimizer_heartbeat_dashboard_interval
- siteground_optimizer_heartbeat_frontend_interval
- siteground_optimizer_heartbeat_post_interval
- siteground_optimizer_update_timestamp
- siteground_optimizer_version
- siteground_settings_optimizer_hello
PHP Error Log
The log file is empty.