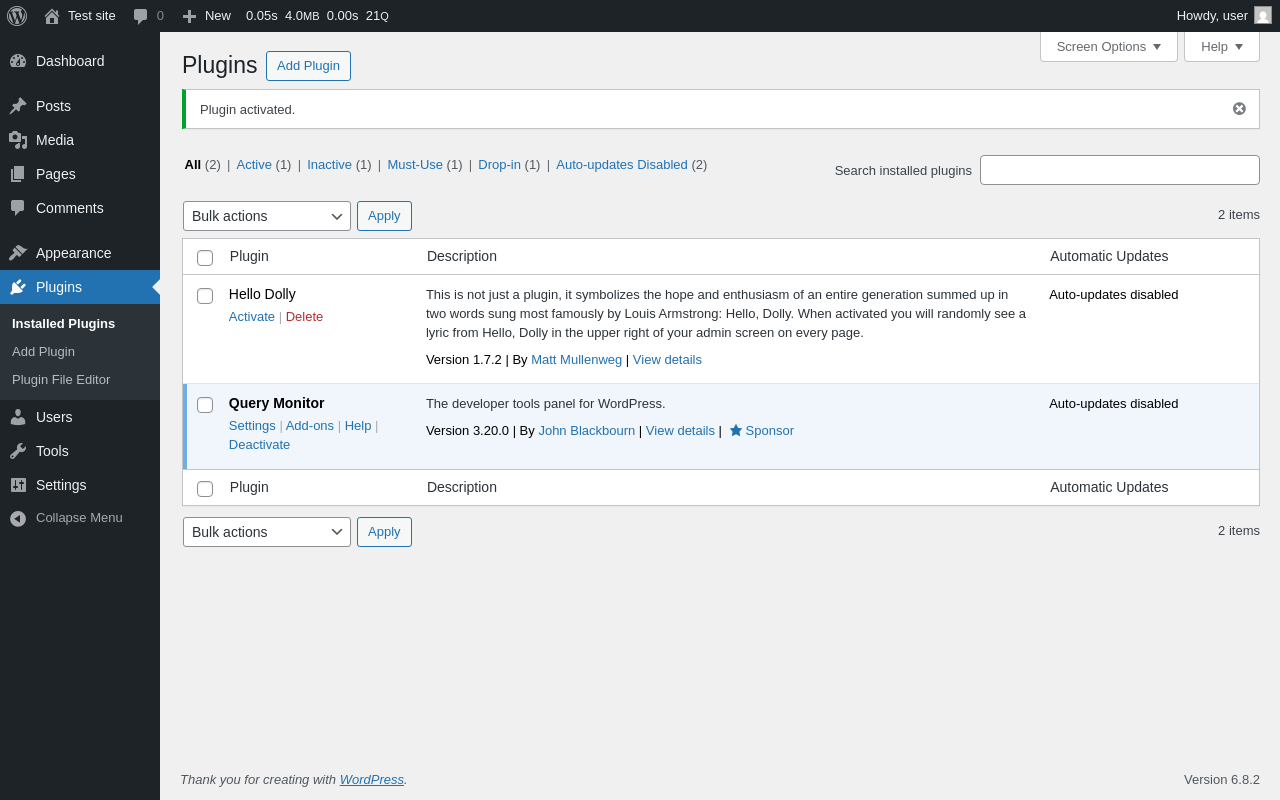
Query Monitor 3.20.0
Does Query Monitor work with WordPress 6.8.3 and PHP 8.1.12? A smoke test was performed on .
Summary
| No PHP errors, warnings or notices | |
| No JavaScript exceptions | |
| All test pages loaded successfully | |
| No resource errors | |
| Looks good! No problems were detected. |
Memory usage: 443.36 KiB
The average PHP memory usage increased by this amount after activating by the plugin.
Page speed impact:
0.156 seconds
The average page load time increased by this amount after activating the plugin.
| WordPress version | 6.8.3 |
|---|---|
| PHP version | 8.1.12 |
| MySQL version | 10.6.10 |
| PHP memory limit | 512M |
| Last updated | |
|---|---|
| Active installs | 200,000+ |
| WordPress.org page | https://wordpress.org/plugins/query-monitor/ |
| Badges |
|
Pages 2
Plugins ‹ Test site — WordPress
| URL | /wp-admin/plugins.php?plugin_status=all&paged=1&s |
|---|---|
| Requested URL | /wp-admin/plugins.php?action=activate&plugin=query-monitor%2Fquery-monitor.php&plugin_status=all&paged=1&s&_wpnonce=7648984751 |
| Aspect | after-activation |
| HTTP status | 200 |
| Load time | 0.548 s |
| Memory usage | 3.96 MiB |
| JS errors | None |
| Resource errors | None |
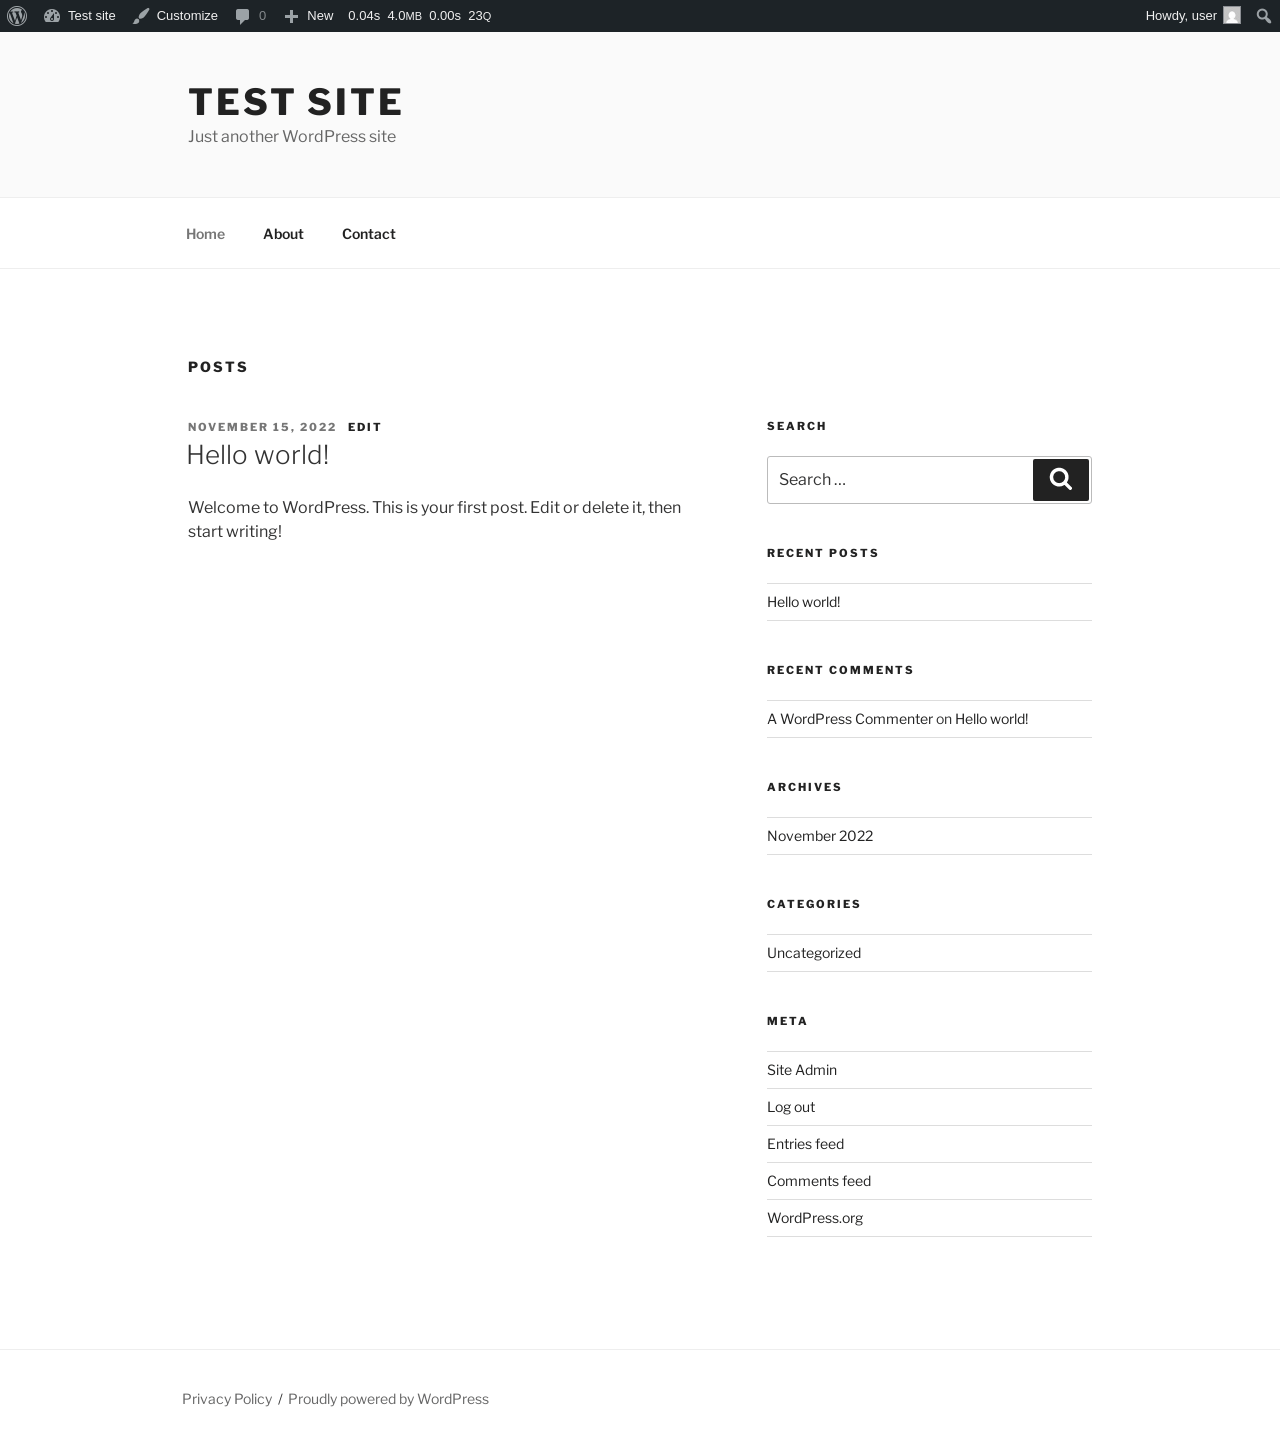
Test site – Just another WordPress site
| URL | / |
|---|---|
| Aspect | front-page |
| HTTP status | 200 |
| Load time | 0.330 s |
| Memory usage | 4.03 MiB |
| JS errors | None |
| Resource errors | None |
Benchmark
| URL | Load time | Memory usage | ||||
|---|---|---|---|---|---|---|
| Inactive | Active | Change | Inactive | Active | Change | |
| /wp-admin/index.php | 0.413 s | 0.711 s | +0.298 s | 3.51 MiB | 4 MiB | + 508.39 KiB |
| /wp-admin/edit.php | 0.205 s | 0.339 s | +0.134 s | 3.57 MiB | 3.99 MiB | + 432.57 KiB |
| /wp-admin/post-new.php | 0.774 s | 1.066 s | +0.292 s | 6.06 MiB | 6.64 MiB | + 594.25 KiB |
| /wp-admin/upload.php | 0.578 s | 0.492 s | -0.086 s | 3.52 MiB | 3.87 MiB | + 351.13 KiB |
| /wp-admin/options-writing.php | 0.221 s | 0.528 s | +0.307 s | 3.5 MiB | 3.84 MiB | + 351.3 KiB |
| /wp-admin/media-new.php | 0.289 s | 0.387 s | +0.098 s | 3.49 MiB | 3.84 MiB | + 359.49 KiB |
| /wp-admin/edit-tags.php?taxonomy=category | 0.196 s | 0.352 s | +0.156 s | 3.5 MiB | 3.88 MiB | + 384.03 KiB |
| /wp-admin/post-new.php?post_type=page | 0.613 s | 0.792 s | +0.179 s | 6.05 MiB | 6.56 MiB | + 526.9 KiB |
| /wp-admin/options-discussion.php | 0.485 s | 0.684 s | +0.199 s | 3.5 MiB | 3.84 MiB | + 347.8 KiB |
| /wp-admin/edit-comments.php | 0.249 s | 0.327 s | +0.078 s | 3.52 MiB | 3.88 MiB | + 369.48 KiB |
| / | 0.301 s | 0.364 s | +0.063 s | 3.43 MiB | 4.07 MiB | + 651.59 KiB |
| Average | 0.393 s | 0.549 s | +0.156 s | 3.97 MiB | 4.4 MiB | + 443.36 KiB |
Code Statistics
Note: Third-party libraries and minified JS/CSS files are excluded from these statistics where possible, so the numbers you see here may be lower than those reported by other tools.
| Language | % | Lines of code | Comment lines | Files | |
|---|---|---|---|---|---|
| PHP | 84.3% | 11,756 | 5,708 | 141 | |
| CSS | 10.6% | 1,473 | 15 | 1 | |
| JavaScript | 4.3% | 595 | 29 | 1 | |
| JSON | 0.8% | 107 | 0 | 1 | |
| SVG | 0.1% | 12 | 0 | 11 | |
| Markdown | 0.0% | 4 | 0 | 1 | |
| Total | 13,947 | 5,752 | 156 | ||
PHP Code Analysis | More results »
| Lines of code | 11,747 |
|---|---|
| Total complexity | 2,099 |
| Median class complexity | 7.0 |
| Median method complexity | 1.0 |
| Most complex class | QM_Util |
| Most complex function | QM_Output_Html_HTTP::output() |
| Classes | 139 |
|---|---|
| Methods | 612 |
| Functions | 58 |
Additions
Things that the plugin adds to the site. This section is not intended to be comprehensive. The test tool only looks for a few specific types of added content.
No new entries found.
PHP Error Log
The log file is empty.