OpenGraph.xyz 1.2.2
Does OpenGraph.xyz work with WordPress 6.8.3 and PHP 8.1.12? A smoke test was performed on .
Summary
| No PHP errors, warnings or notices | |
| No JavaScript exceptions | |
| All test pages loaded successfully | |
| No resource errors | |
| Looks good! No problems were detected. |
Memory usage: 70.8 KiB
The average PHP memory usage increased by this amount after activating by the plugin.
Page speed impact:
0.064 seconds
The average page load time increased by this amount after activating the plugin.
| WordPress version | 6.8.3 |
|---|---|
| PHP version | 8.1.12 |
| MySQL version | 10.6.10 |
| PHP memory limit | 512M |
| Last updated | |
|---|---|
| Active installs | 60+ |
| WordPress.org page | https://wordpress.org/plugins/opengraph-xyz/ |
| Badges |
|
Pages 5
Plugins ‹ Test site — WordPress
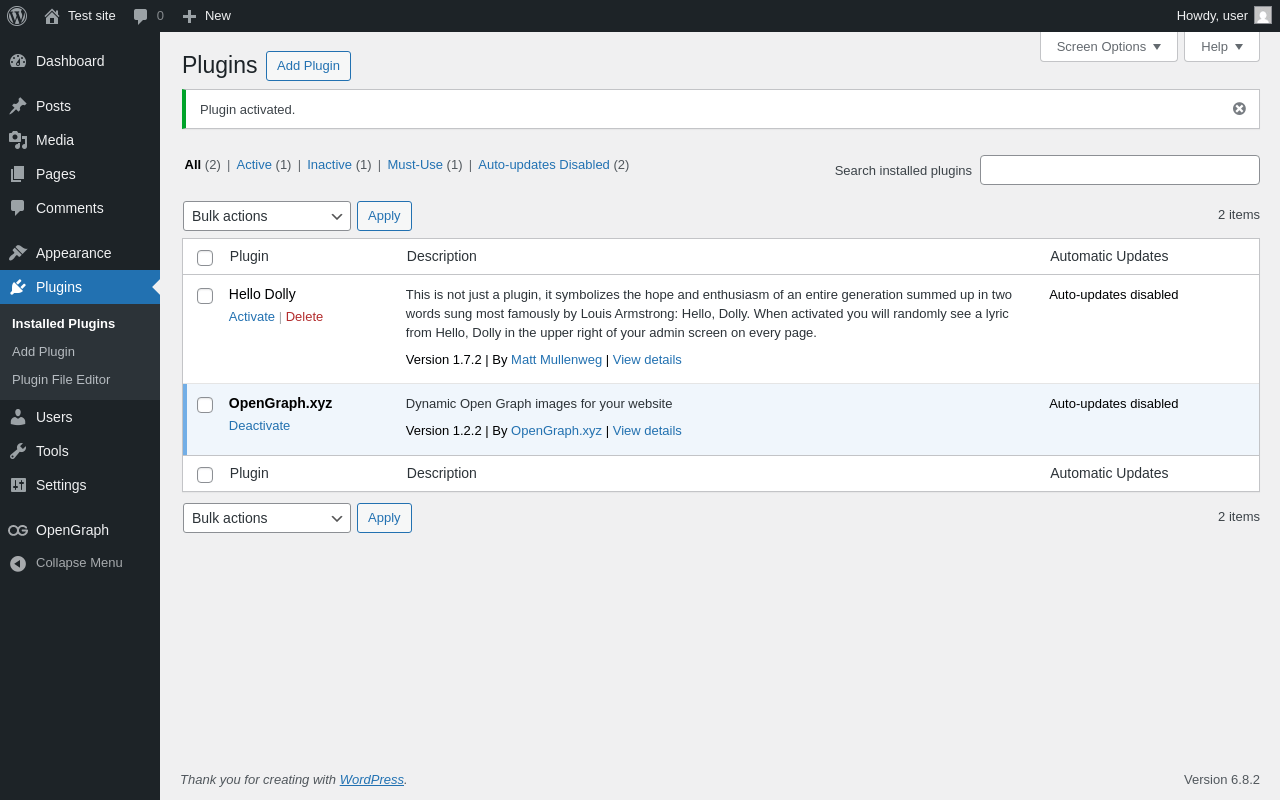
| URL | /wp-admin/plugins.php?plugin_status=all&paged=1&s |
|---|---|
| Requested URL | /wp-admin/plugins.php?action=activate&plugin=opengraph-xyz%2Fopengraph-xyz.php&plugin_status=all&paged=1&s&_wpnonce=873a9aed7d |
| Aspect | after-activation |
| HTTP status | 200 |
| Load time | 0.290 s |
| Memory usage | 3.6 MiB |
| JS errors | None |
| Resource errors | None |
OpenGraph
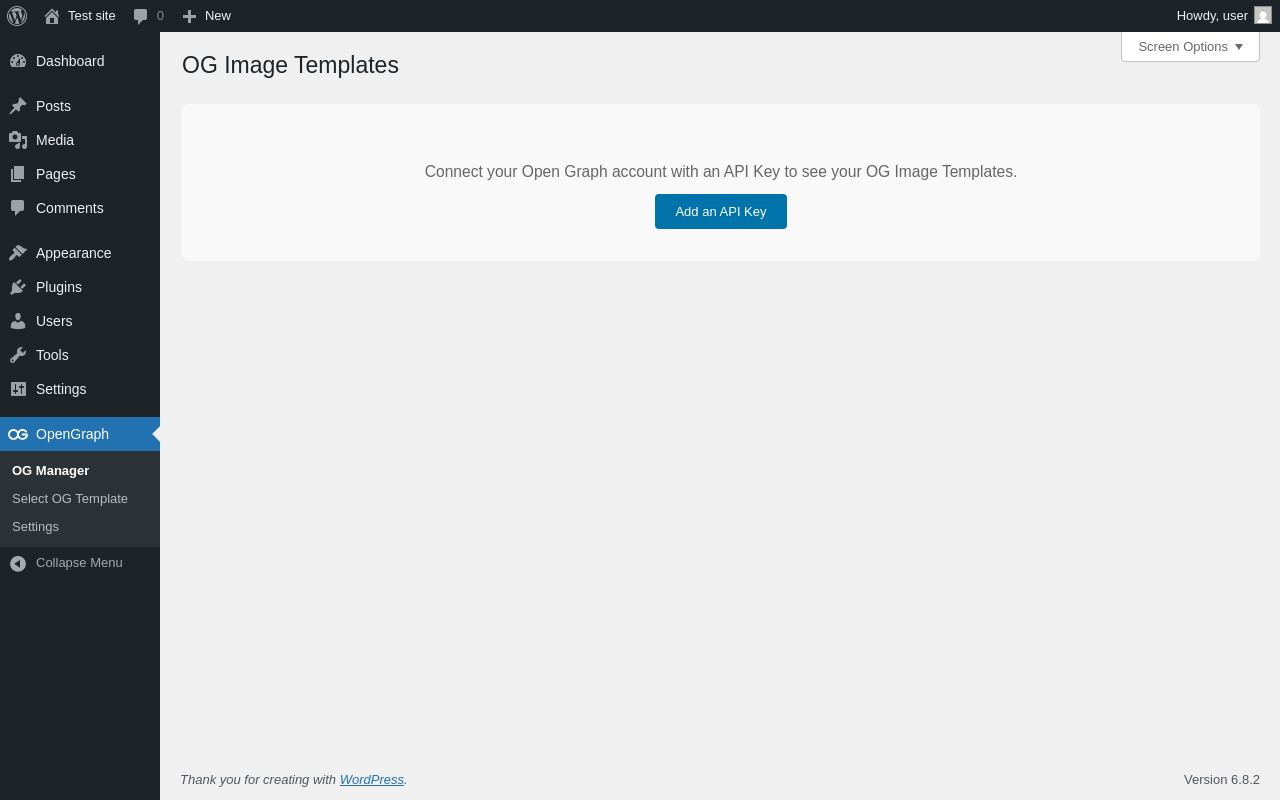
| URL | /wp-admin/edit.php?post_type=opengraph_template |
|---|---|
| Aspect | menu-item |
| HTTP status | 200 |
| Load time | 0.187 s |
| Memory usage | 3.63 MiB |
| JS errors | None |
| Resource errors | None |
OpenGraph → Select OG Template

| URL | /wp-admin/edit.php?post_type=opengraph_template&page=opengraph_template_selection |
|---|---|
| Aspect | menu-item |
| HTTP status | 200 |
| Load time | 1.283 s |
| Memory usage | 3.65 MiB |
| JS errors | None |
| Resource errors | None |
OpenGraph → Settings
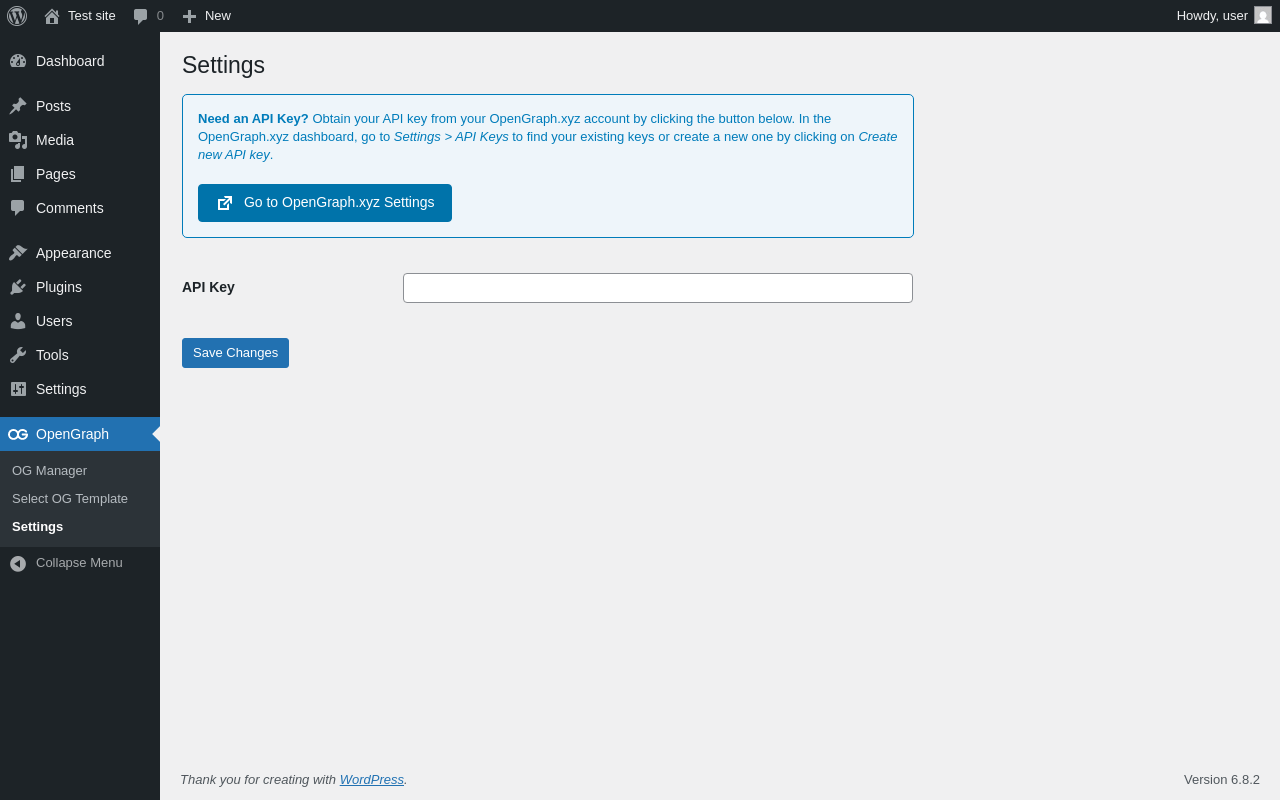
| URL | /wp-admin/edit.php?post_type=opengraph_template&page=og-xyz-settings |
|---|---|
| Aspect | menu-item |
| HTTP status | 200 |
| Load time | 0.175 s |
| Memory usage | 3.57 MiB |
| JS errors | None |
| Resource errors | None |
Test site – Just another WordPress site
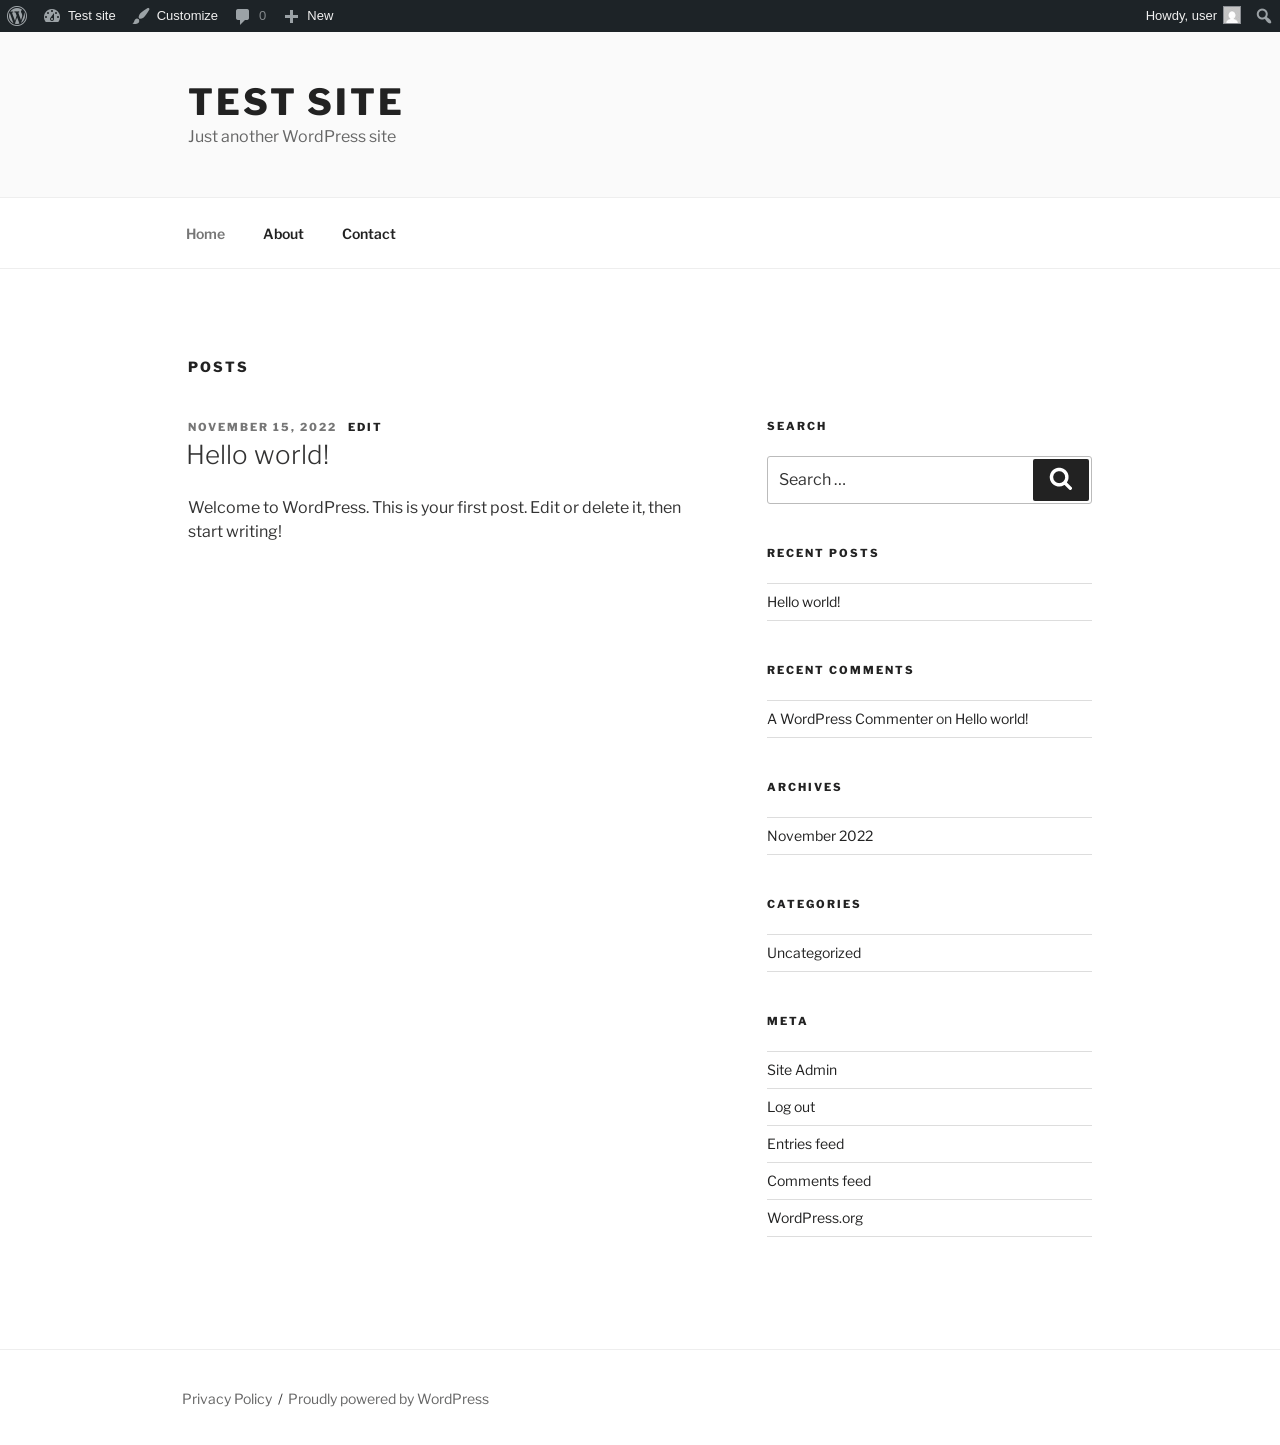
| URL | / |
|---|---|
| Aspect | front-page |
| HTTP status | 200 |
| Load time | 0.190 s |
| Memory usage | 3.48 MiB |
| JS errors | None |
| Resource errors | None |
Benchmark
| URL | Load time | Memory usage | ||||
|---|---|---|---|---|---|---|
| Inactive | Active | Change | Inactive | Active | Change | |
| /wp-admin/index.php | 0.341 s | 0.439 s | +0.098 s | 3.51 MiB | 3.59 MiB | + 81.42 KiB |
| /wp-admin/edit.php | 0.199 s | 0.223 s | +0.024 s | 3.57 MiB | 3.65 MiB | + 79.07 KiB |
| /wp-admin/post-new.php | 0.744 s | 1.182 s | +0.438 s | 6.06 MiB | 6.14 MiB | + 81.93 KiB |
| /wp-admin/upload.php | 0.571 s | 0.707 s | +0.136 s | 3.52 MiB | 3.58 MiB | + 61.66 KiB |
| /wp-admin/options-writing.php | 0.224 s | 0.219 s | -0.005 s | 3.5 MiB | 3.57 MiB | + 65.65 KiB |
| /wp-admin/media-new.php | 0.279 s | 0.208 s | -0.071 s | 3.49 MiB | 3.56 MiB | + 73.84 KiB |
| /wp-admin/edit-tags.php?taxonomy=category | 0.237 s | 0.192 s | -0.045 s | 3.5 MiB | 3.59 MiB | + 84.52 KiB |
| /wp-admin/post-new.php?post_type=page | 0.608 s | 0.692 s | +0.084 s | 6.05 MiB | 6.13 MiB | + 77.45 KiB |
| /wp-admin/options-discussion.php | 0.262 s | 0.456 s | +0.194 s | 3.5 MiB | 3.56 MiB | + 62.15 KiB |
| /wp-admin/edit-comments.php | 0.416 s | 0.209 s | -0.207 s | 3.52 MiB | 3.58 MiB | + 61.65 KiB |
| / | 0.292 s | 0.353 s | +0.061 s | 3.43 MiB | 3.48 MiB | + 49.45 KiB |
| Average | 0.379 s | 0.444 s | +0.064 s | 3.97 MiB | 4.04 MiB | + 70.8 KiB |
Code Statistics
Note: Third-party libraries and minified JS/CSS files are excluded from these statistics where possible, so the numbers you see here may be lower than those reported by other tools.
| Language | % | Lines of code | Comment lines | Files | |
|---|---|---|---|---|---|
| PHP | 97.5% | 1,931 | 423 | 14 | |
| SVG | 1.7% | 34 | 0 | 1 | |
| JSON | 0.8% | 16 | 0 | 1 | |
| Total | 1,981 | 423 | 16 | ||
PHP Code Analysis | More results »
| Lines of code | 1,155 |
|---|---|
| Total complexity | 253 |
| Median class complexity | 57.5 |
| Median method complexity | 2.0 |
| Most complex class | OpenGraphXYZ\Admin |
| Most complex function | OpenGraphXYZ\Dynamic_Tags::get_post_property() |
| Classes | 4 |
|---|---|
| Methods | 57 |
| Functions | 9 |
Additions
Things that the plugin adds to the site. This section is not intended to be comprehensive. The test tool only looks for a few specific types of added content.
Custom Post Types 1
| ID | Name |
|---|---|
| opengraph_template | OG Image Templates |
PHP Error Log
The log file is empty.