OPcache Manager 3.1.0
Does OPcache Manager work with WordPress 6.7.2 and PHP 8.1.12? A smoke test was performed on .
Summary
| No PHP errors, warnings or notices | |
| No JavaScript exceptions | |
| All test pages loaded successfully | |
| No resource errors | |
| Looks good! No problems were detected. |
Memory usage: 107.59 KiB
The average PHP memory usage increased by this amount after activating by the plugin.
Page speed impact:
insignificant.
The plugin didn't make the site noticeably slower.
| WordPress version | 6.7.2 |
|---|---|
| PHP version | 8.1.12 |
| MySQL version | 10.6.10 |
| PHP memory limit | 512M |
| Last updated | |
|---|---|
| Active installs | 1,000+ |
| WordPress.org page | https://wordpress.org/plugins/opcache-manager/ |
| Badges |
|
Pages 5
Plugins ‹ Test site — WordPress
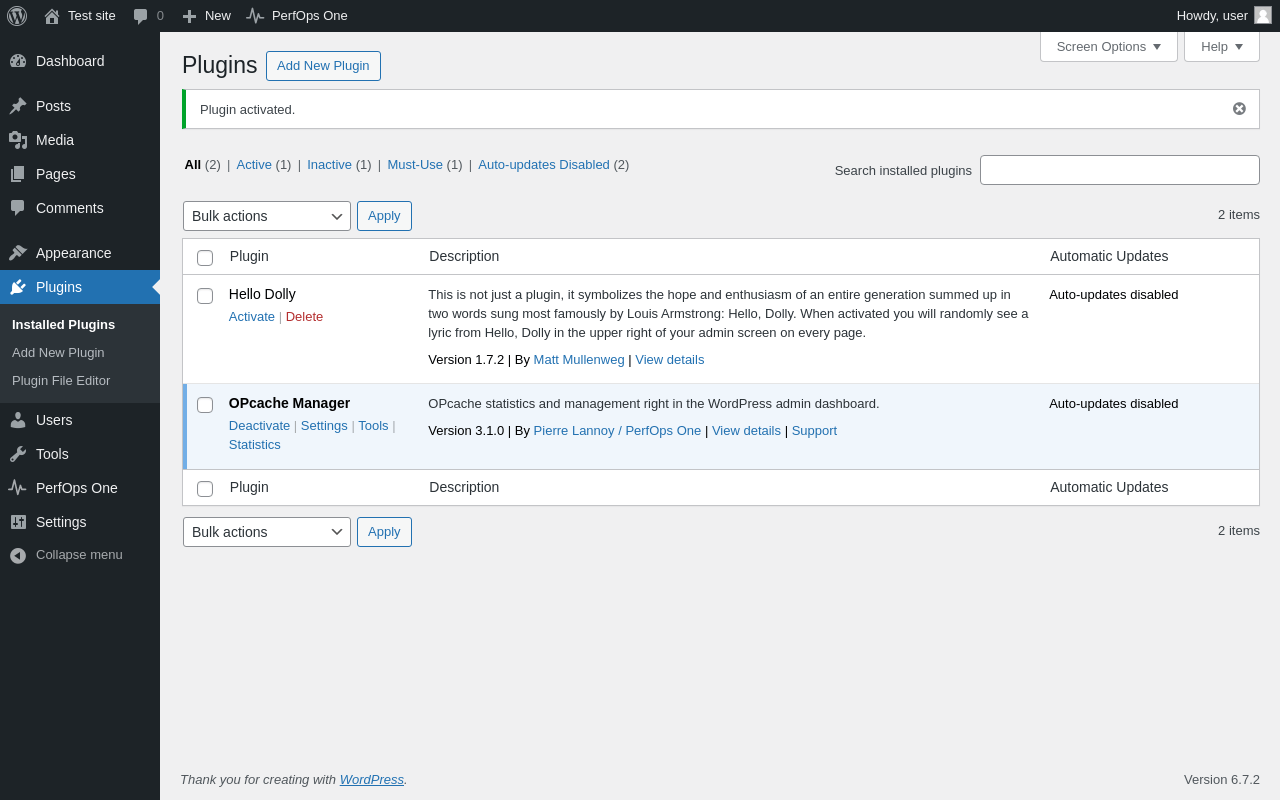
| URL | /wp-admin/plugins.php?plugin_status=all&paged=1&s |
|---|---|
| Requested URL | /wp-admin/plugins.php?action=activate&plugin=opcache-manager%2Fopcache-manager.php&plugin_status=all&paged=1&s&_wpnonce=036c680eab |
| Aspect | after-activation |
| HTTP status | 200 |
| Load time | 0.997 s |
| Memory usage | 3.64 MiB |
| JS errors | None |
| Resource errors | None |
PerfOps One
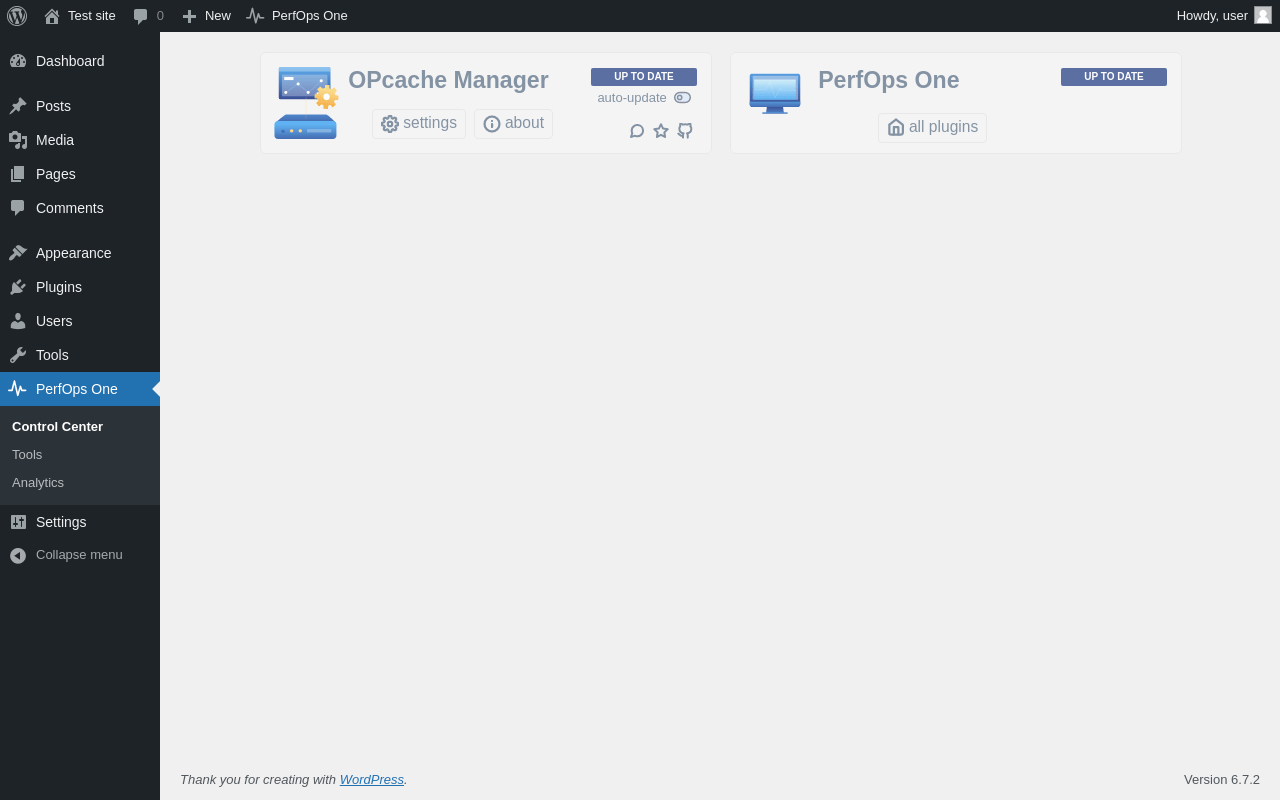
| URL | /wp-admin/admin.php?page=perfopsone-dashboard |
|---|---|
| Aspect | menu-item |
| HTTP status | 200 |
| Load time | 0.331 s |
| Memory usage | 3.57 MiB |
| JS errors | None |
| Resource errors | None |
PerfOps One → Tools
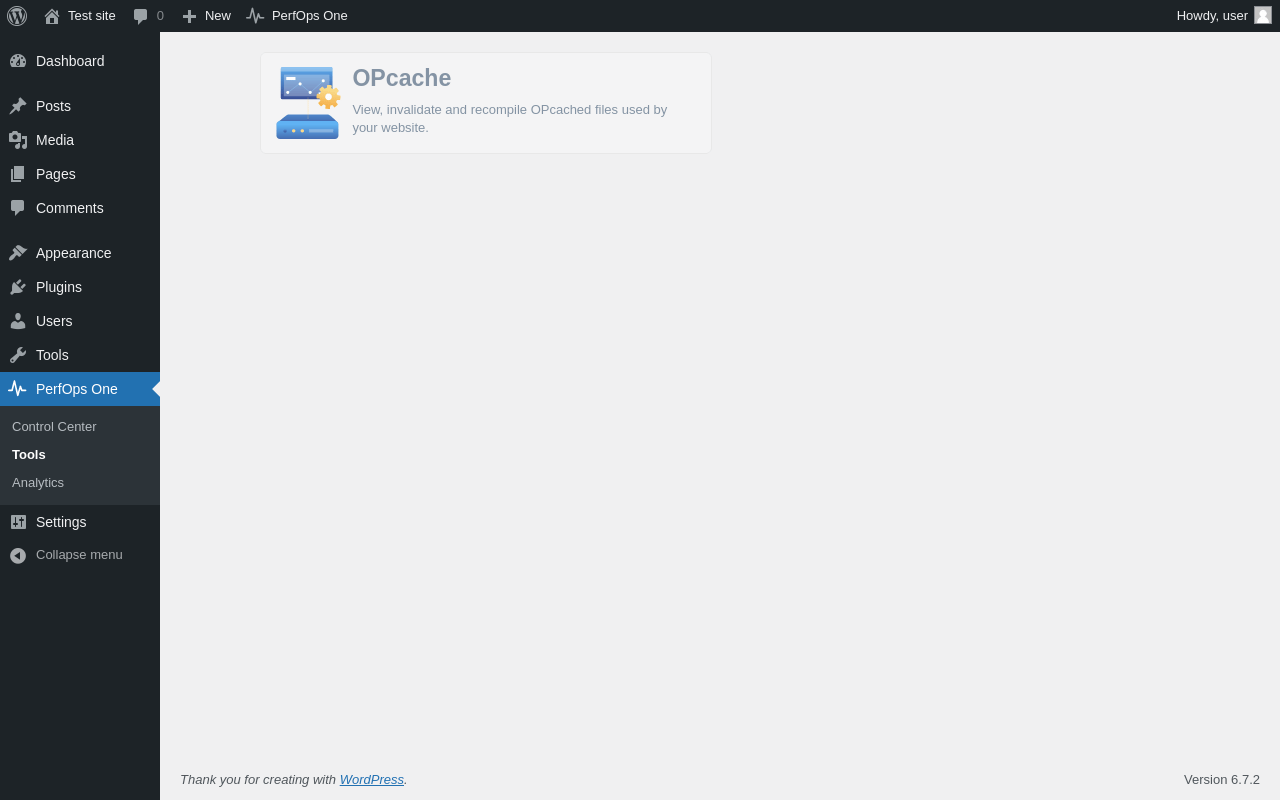
| URL | /wp-admin/admin.php?page=perfopsone-tools |
|---|---|
| Aspect | menu-item |
| HTTP status | 200 |
| Load time | 0.175 s |
| Memory usage | 3.57 MiB |
| JS errors | None |
| Resource errors | None |
PerfOps One → Analytics
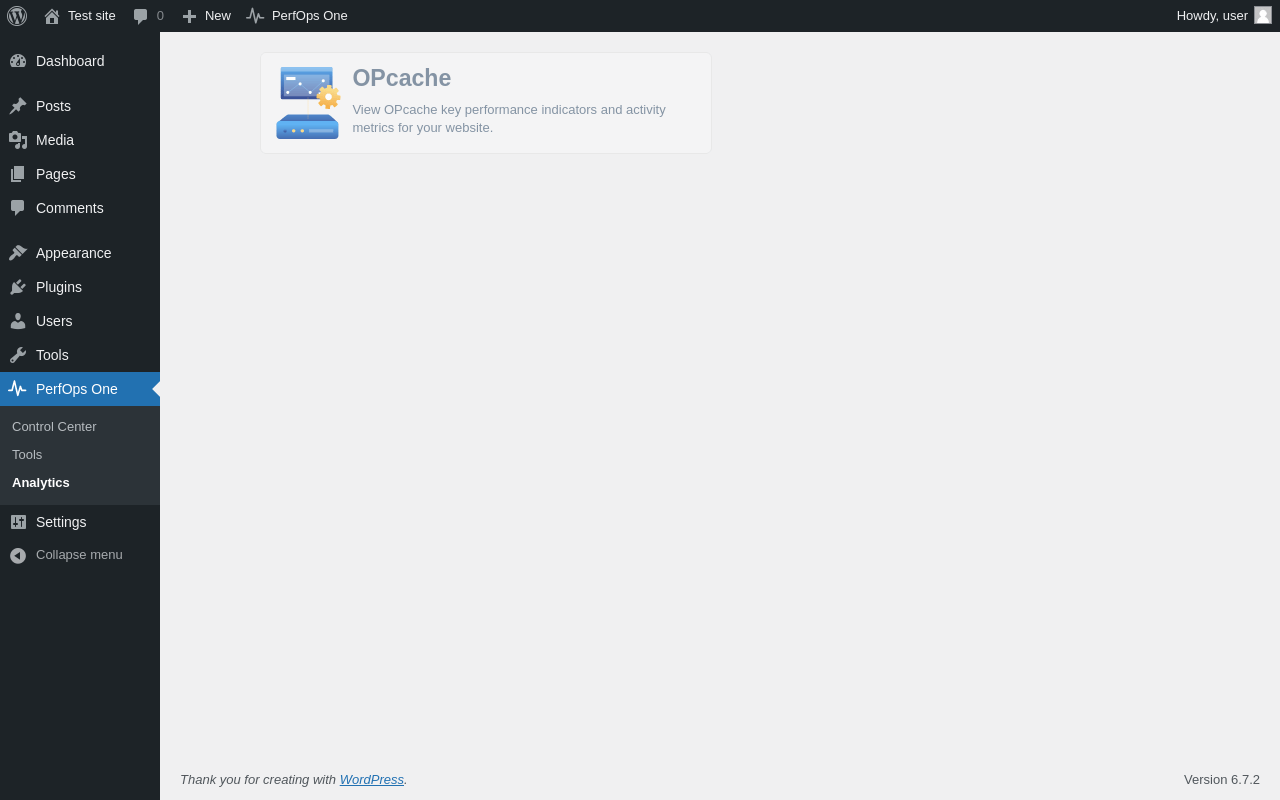
| URL | /wp-admin/admin.php?page=perfopsone-analytics |
|---|---|
| Aspect | menu-item |
| HTTP status | 200 |
| Load time | 0.153 s |
| Memory usage | 3.57 MiB |
| JS errors | None |
| Resource errors | None |
Test site – Just another WordPress site
| URL | / |
|---|---|
| Aspect | front-page |
| HTTP status | 200 |
| Load time | 0.218 s |
| Memory usage | 3.48 MiB |
| JS errors | None |
| Resource errors | None |
Benchmark
| URL | Load time | Memory usage | ||||
|---|---|---|---|---|---|---|
| Inactive | Active | Change | Inactive | Active | Change | |
| /wp-admin/index.php | 0.301 s | 0.310 s | +0.009 s | 3.48 MiB | 3.6 MiB | + 120.66 KiB |
| /wp-admin/edit.php | 0.210 s | 0.243 s | +0.033 s | 3.54 MiB | 3.68 MiB | + 142.3 KiB |
| /wp-admin/post-new.php | 0.797 s | 0.646 s | -0.151 s | 5.93 MiB | 6.07 MiB | + 145.13 KiB |
| /wp-admin/upload.php | 0.600 s | 0.373 s | -0.227 s | 3.5 MiB | 3.59 MiB | + 98.04 KiB |
| /wp-admin/options-writing.php | 0.207 s | 0.197 s | -0.010 s | 3.47 MiB | 3.57 MiB | + 102.44 KiB |
| /wp-admin/media-new.php | 0.443 s | 0.204 s | -0.239 s | 3.46 MiB | 3.57 MiB | + 110.63 KiB |
| /wp-admin/edit-tags.php?taxonomy=category | 0.183 s | 0.368 s | +0.185 s | 3.48 MiB | 3.6 MiB | + 121.4 KiB |
| /wp-admin/post-new.php?post_type=page | 0.579 s | 0.675 s | +0.096 s | 5.92 MiB | 6.06 MiB | + 140.66 KiB |
| /wp-admin/options-discussion.php | 0.293 s | 0.266 s | -0.027 s | 3.48 MiB | 3.57 MiB | + 98.94 KiB |
| /wp-admin/edit-comments.php | 0.201 s | 0.218 s | +0.017 s | 3.5 MiB | 3.59 MiB | + 98.59 KiB |
| / | 0.326 s | 0.205 s | -0.121 s | 3.48 MiB | 3.48 MiB | + 4.67 KiB |
| Average | 0.376 s | 0.337 s | -0.040 s | 3.93 MiB | 4.04 MiB | + 107.59 KiB |
Code Statistics
Note: Third-party libraries and minified JS/CSS files are excluded from these statistics where possible, so the numbers you see here may be lower than those reported by other tools.
| Language | % | Lines of code | Comment lines | Files | |
|---|---|---|---|---|---|
| JavaScript | 55.7% | 20,482 | 2,305 | 6 | |
| PHP | 26.4% | 9,702 | 7,196 | 116 | |
| SVG | 11.6% | 4,251 | 1 | 285 | |
| CSS | 4.9% | 1,816 | 2 | 7 | |
| Markdown | 1.2% | 434 | 0 | 7 | |
| JSON | 0.2% | 60 | 0 | 3 | |
| Total | 36,745 | 9,504 | 424 | ||
PHP Code Analysis | More results »
| Lines of code | 9,416 |
|---|---|
| Total complexity | 2,201 |
| Median class complexity | 16.0 |
| Median method complexity | 2.0 |
| Most complex class | OPcacheManager\Plugin\Feature\Analytics |
| Most complex function | OPcacheManager\Plugin\Feature\Analytics::query_kpi() |
| Classes | 71 |
|---|---|
| Methods | 475 |
| Functions | 6 |
Additions
Things that the plugin adds to the site. This section is not intended to be comprehensive. The test tool only looks for a few specific types of added content.
Database Tables 1
- wp_opcm_statistics
Options wp_options 2
- opcm_nags
- opcm_version
PHP Error Log
The log file is empty.