OPcache Manager 2.6.1
Does OPcache Manager work with WordPress 5.9.3 and PHP 7.4.8? A smoke test was performed on .
Summary
| No PHP errors, warnings or notices | |
| No JavaScript exceptions | |
| All test pages loaded successfully | |
| No resource errors | |
| Looks good! No problems were detected. |
Memory usage: 133.23 KiB
The average PHP memory usage increased by this amount after activating by the plugin.
Page speed impact:
insignificant.
The plugin didn't make the site noticeably slower.
| WordPress version | 5.9.3 |
|---|---|
| PHP version | 7.4.8 |
| MySQL version | 8.0.21 |
| PHP memory limit | 256M |
| Last updated | |
|---|---|
| Active installs | 1,000+ |
| WordPress.org page | https://wordpress.org/plugins/opcache-manager/ |
| Badges |
|
Pages 5
Plugins ‹ Test site — WordPress
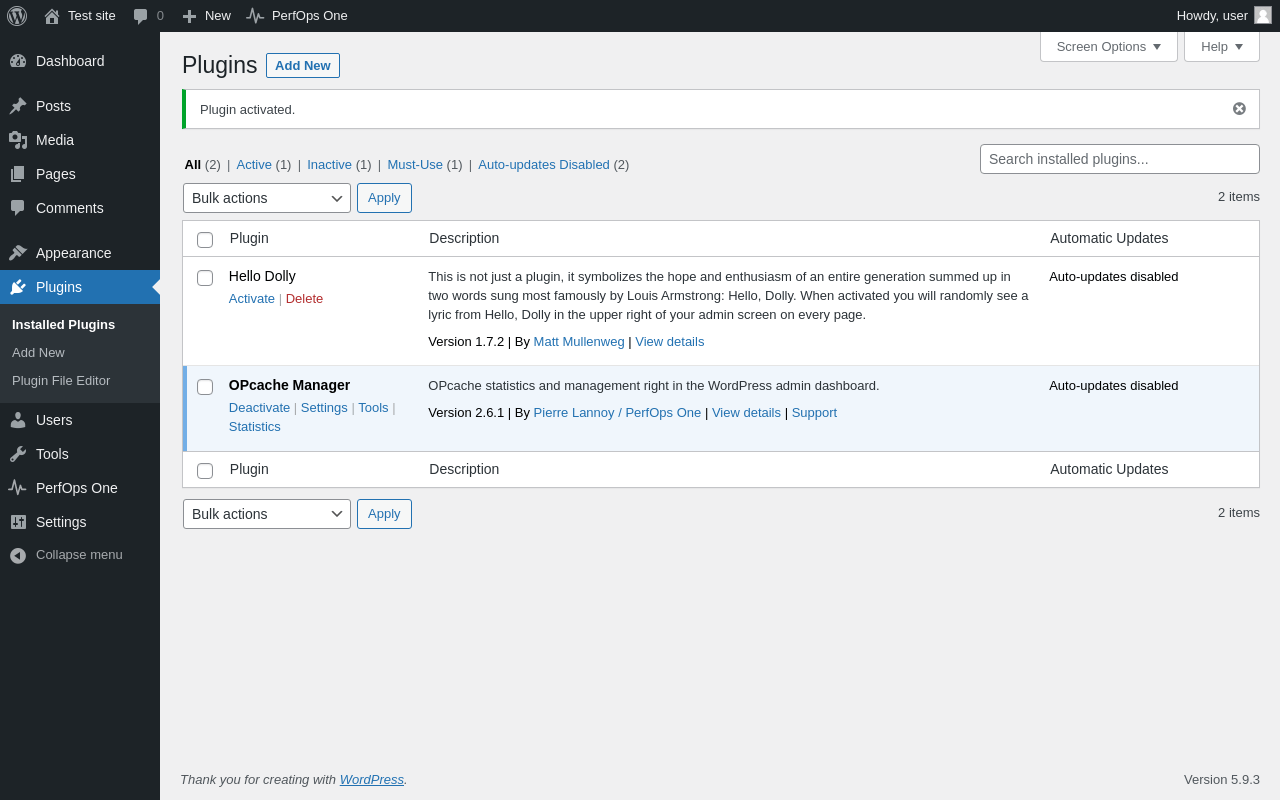
| URL | /wp-admin/plugins.php?plugin_status=all&paged=1&s |
|---|---|
| Requested URL | /wp-admin/plugins.php?action=activate&plugin=opcache-manager%2Fopcache-manager.php&plugin_status=all&paged=1&s&_wpnonce=10f48d0556 |
| Aspect | after-activation |
| HTTP status | 200 |
| Load time | 0.412 s |
| Memory usage | 3.56 MiB |
| JS errors | None |
| Resource errors | None |
PerfOps One
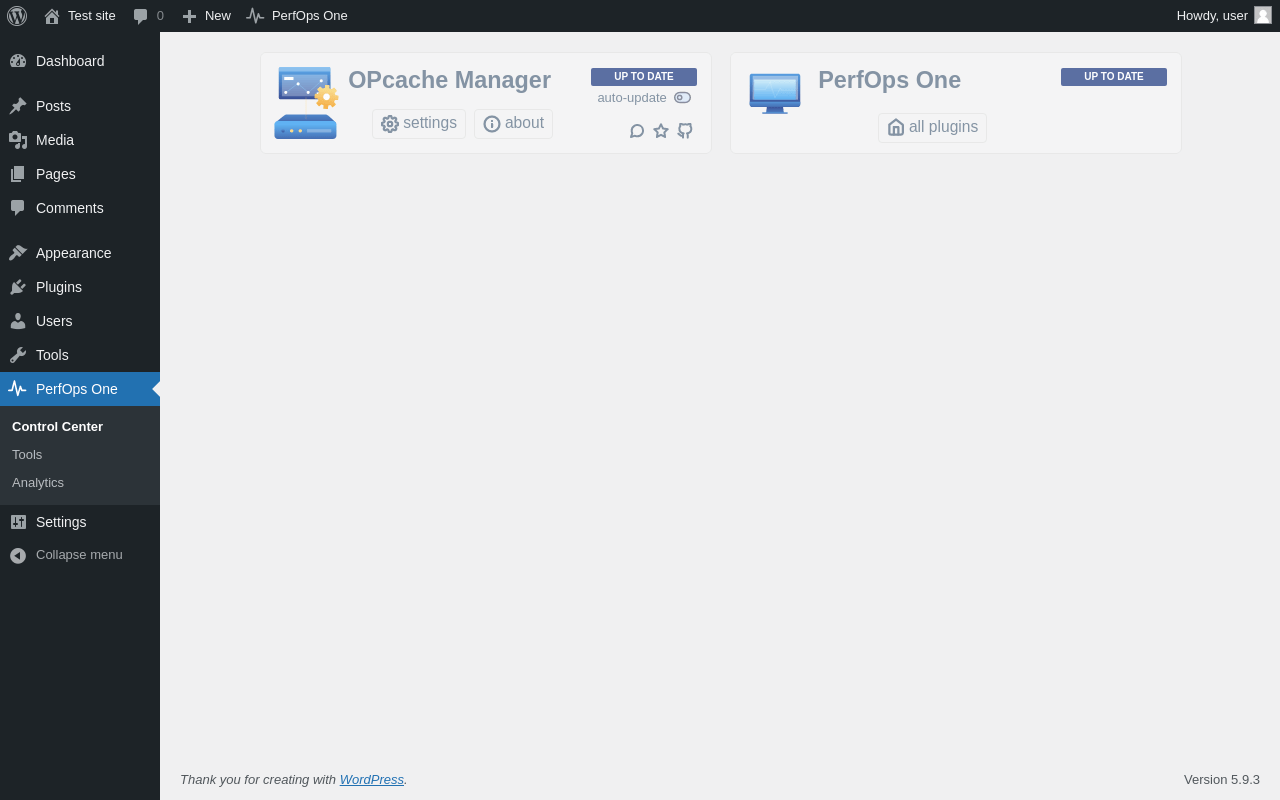
| URL | /wp-admin/admin.php?page=perfopsone-dashboard |
|---|---|
| Aspect | menu-item |
| HTTP status | 200 |
| Load time | 0.278 s |
| Memory usage | 3.45 MiB |
| JS errors | None |
| Resource errors | None |
PerfOps One → Tools
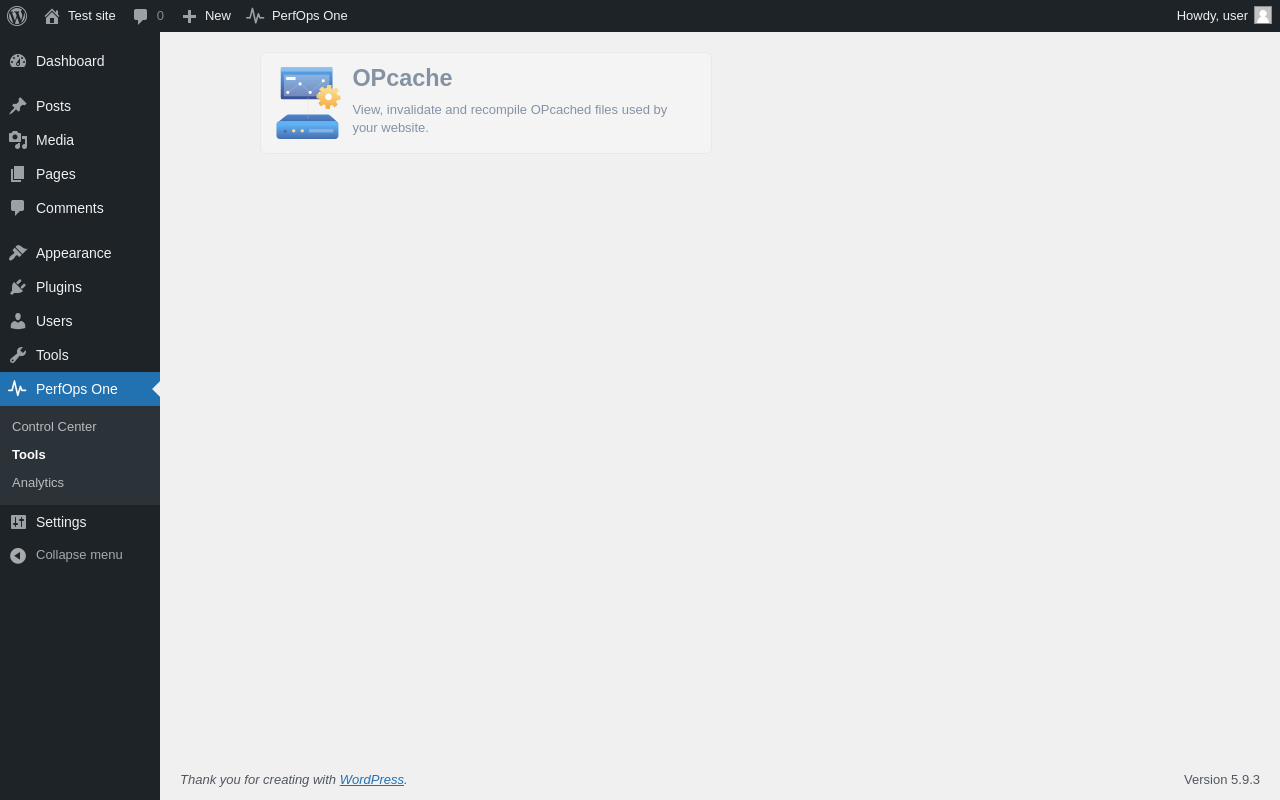
| URL | /wp-admin/admin.php?page=perfopsone-tools |
|---|---|
| Aspect | menu-item |
| HTTP status | 200 |
| Load time | 0.164 s |
| Memory usage | 3.34 MiB |
| JS errors | None |
| Resource errors | None |
PerfOps One → Analytics
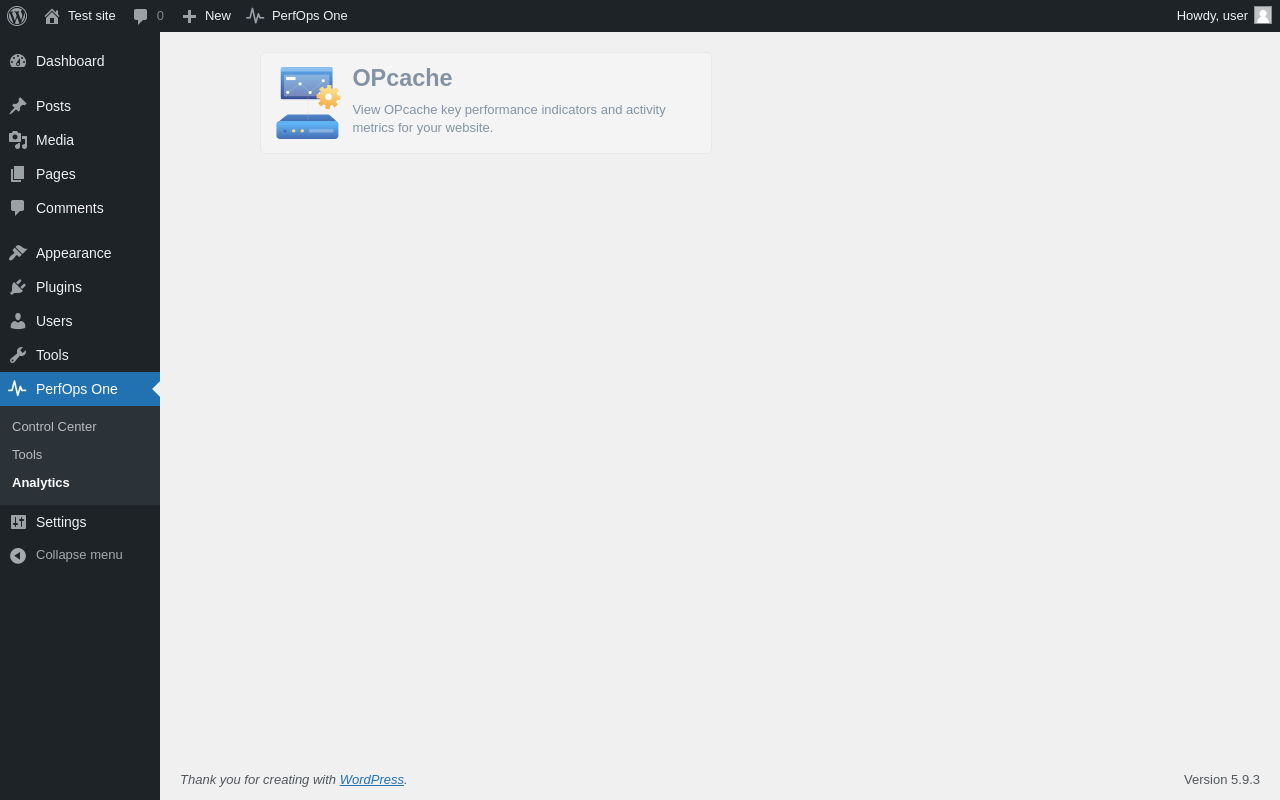
| URL | /wp-admin/admin.php?page=perfopsone-analytics |
|---|---|
| Aspect | menu-item |
| HTTP status | 200 |
| Load time | 0.133 s |
| Memory usage | 3.34 MiB |
| JS errors | None |
| Resource errors | None |
Test site – Just another WordPress site
| URL | / |
|---|---|
| Aspect | front-page |
| HTTP status | 200 |
| Load time | 0.215 s |
| Memory usage | 3.42 MiB |
| JS errors | None |
| Resource errors | None |
Benchmark
| URL | Load time | Memory usage | ||||
|---|---|---|---|---|---|---|
| Inactive | Active | Change | Inactive | Active | Change | |
| /wp-admin/index.php | 0.365 s | 0.281 s | -0.084 s | 3.37 MiB | 3.48 MiB | + 111.64 KiB |
| /wp-admin/edit.php | 0.188 s | 0.228 s | +0.040 s | 3.4 MiB | 3.51 MiB | + 111.33 KiB |
| /wp-admin/post-new.php | 0.987 s | 1.164 s | +0.177 s | 5.69 MiB | 5.79 MiB | + 110.5 KiB |
| /wp-admin/upload.php | 0.487 s | 0.350 s | -0.137 s | 3.25 MiB | 3.43 MiB | + 182.2 KiB |
| /wp-admin/options-writing.php | 0.267 s | 0.157 s | -0.110 s | 3.24 MiB | 3.4 MiB | + 166.02 KiB |
| /wp-admin/media-new.php | 0.230 s | 0.194 s | -0.036 s | 3.23 MiB | 3.4 MiB | + 182.99 KiB |
| /wp-admin/edit-tags.php?taxonomy=category | 0.203 s | 0.190 s | -0.013 s | 3.27 MiB | 3.44 MiB | + 175.27 KiB |
| /wp-admin/post-new.php?post_type=page | 0.890 s | 1.047 s | +0.157 s | 5.68 MiB | 5.78 MiB | + 105.46 KiB |
| /wp-admin/options-discussion.php | 0.225 s | 0.352 s | +0.127 s | 3.22 MiB | 3.34 MiB | + 119.59 KiB |
| /wp-admin/edit-comments.php | 0.221 s | 0.225 s | +0.004 s | 3.27 MiB | 3.44 MiB | + 173.59 KiB |
| / | 0.262 s | 0.215 s | -0.047 s | 3.4 MiB | 3.42 MiB | + 26.91 KiB |
| Average | 0.393 s | 0.400 s | +0.007 s | 3.73 MiB | 3.86 MiB | + 133.23 KiB |
Code Statistics
Note: Third-party libraries and minified JS/CSS files are excluded from these statistics where possible, so the numbers you see here may be lower than those reported by other tools.
| Language | % | Lines of code | Comment lines | Files | |
|---|---|---|---|---|---|
| JavaScript | 51.9% | 17,090 | 2,275 | 6 | |
| PHP | 28.5% | 9,371 | 6,762 | 110 | |
| SVG | 12.9% | 4,251 | 1 | 285 | |
| CSS | 5.5% | 1,816 | 2 | 7 | |
| Markdown | 1.0% | 326 | 0 | 7 | |
| JSON | 0.2% | 53 | 0 | 2 | |
| Total | 32,907 | 9,040 | 417 | ||
PHP Code Analysis | More results »
| Lines of code | 9,072 |
|---|---|
| Total complexity | 2,103 |
| Median class complexity | 16.0 |
| Median method complexity | 2.0 |
| Most complex class | OPcacheManager\Plugin\Feature\Analytics |
| Most complex function | OPcacheManager\Plugin\Feature\Analytics::query_kpi() |
| Classes | 67 |
|---|---|
| Methods | 458 |
| Functions | 6 |
Additions
Things that the plugin adds to the site. This section is not intended to be comprehensive. The test tool only looks for a few specific types of added content.
Database Tables 1
- wp_opcm_statistics
Options wp_options 2
- opcm_nags
- opcm_version
PHP Error Log
The log file is empty.