OPcache Manager 2.3.2
Does OPcache Manager work with WordPress 5.8 and PHP 7.4.8? A smoke test was performed on .
Summary
| No PHP errors, warnings or notices | |
| No JavaScript exceptions | |
| All test pages loaded successfully | |
| No resource errors | |
| Looks good! No problems were detected. |
Memory usage: 115.86 KiB
The average PHP memory usage increased by this amount after activating by the plugin.
Page speed impact:
insignificant.
The plugin didn't make the site noticeably slower.
| WordPress version | 5.8 |
|---|---|
| PHP version | 7.4.8 |
| MySQL version | 8.0.21 |
| PHP memory limit | 256M |
| Last updated | |
|---|---|
| Active installs | 1,000+ |
| WordPress.org page | https://wordpress.org/plugins/opcache-manager/ |
| Badges |
|
Pages 5
Plugins ‹ Test site — WordPress
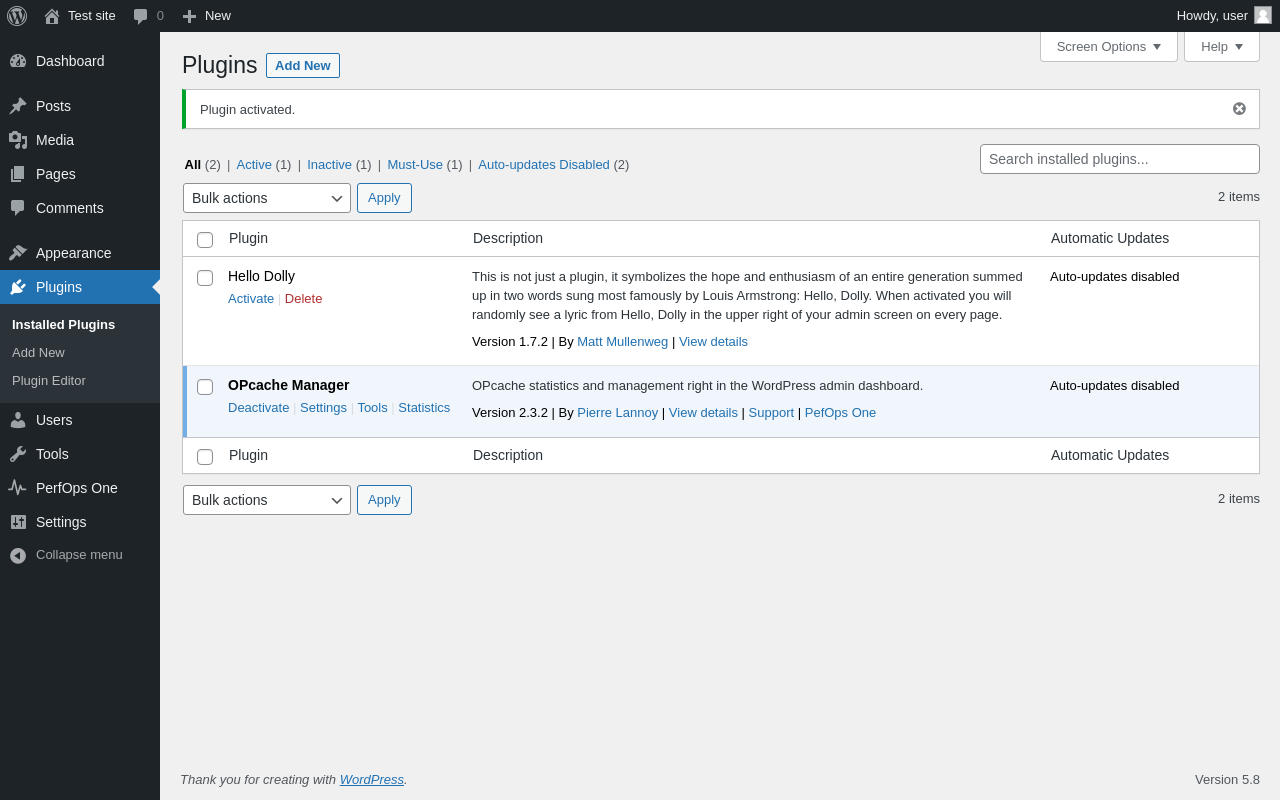
| URL | /wp-admin/plugins.php?plugin_status=all&paged=1&s |
|---|---|
| Requested URL | /wp-admin/plugins.php?action=activate&plugin=opcache-manager%2Fopcache-manager.php&plugin_status=all&paged=1&s&_wpnonce=2c05eda72a |
| Aspect | after-activation |
| HTTP status | 200 |
| Load time | 0.625 s |
| Memory usage | 3.33 MiB |
| JS errors | None |
| Resource errors | None |
PerfOps One
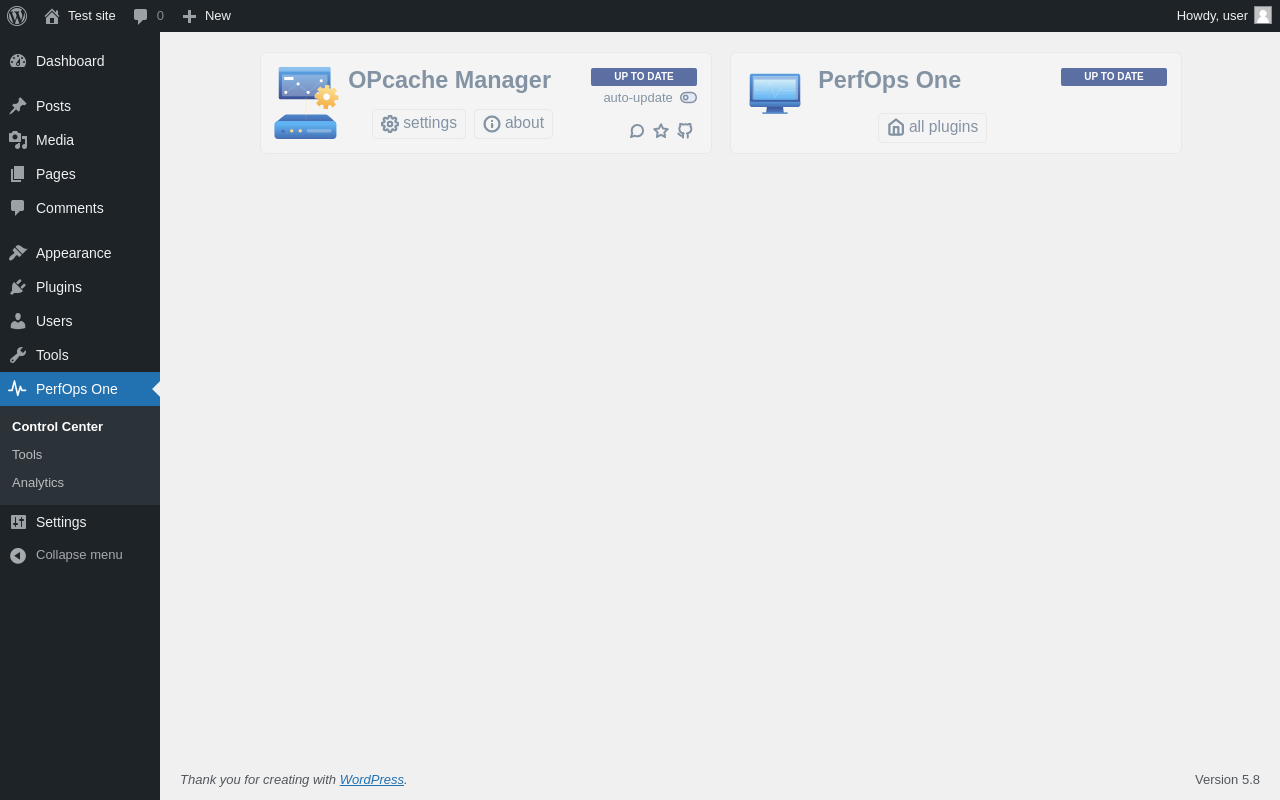
| URL | /wp-admin/admin.php?page=perfopsone-dashboard |
|---|---|
| Aspect | menu-item |
| HTTP status | 200 |
| Load time | 0.195 s |
| Memory usage | 3.16 MiB |
| JS errors | None |
| Resource errors | None |
PerfOps One → Tools
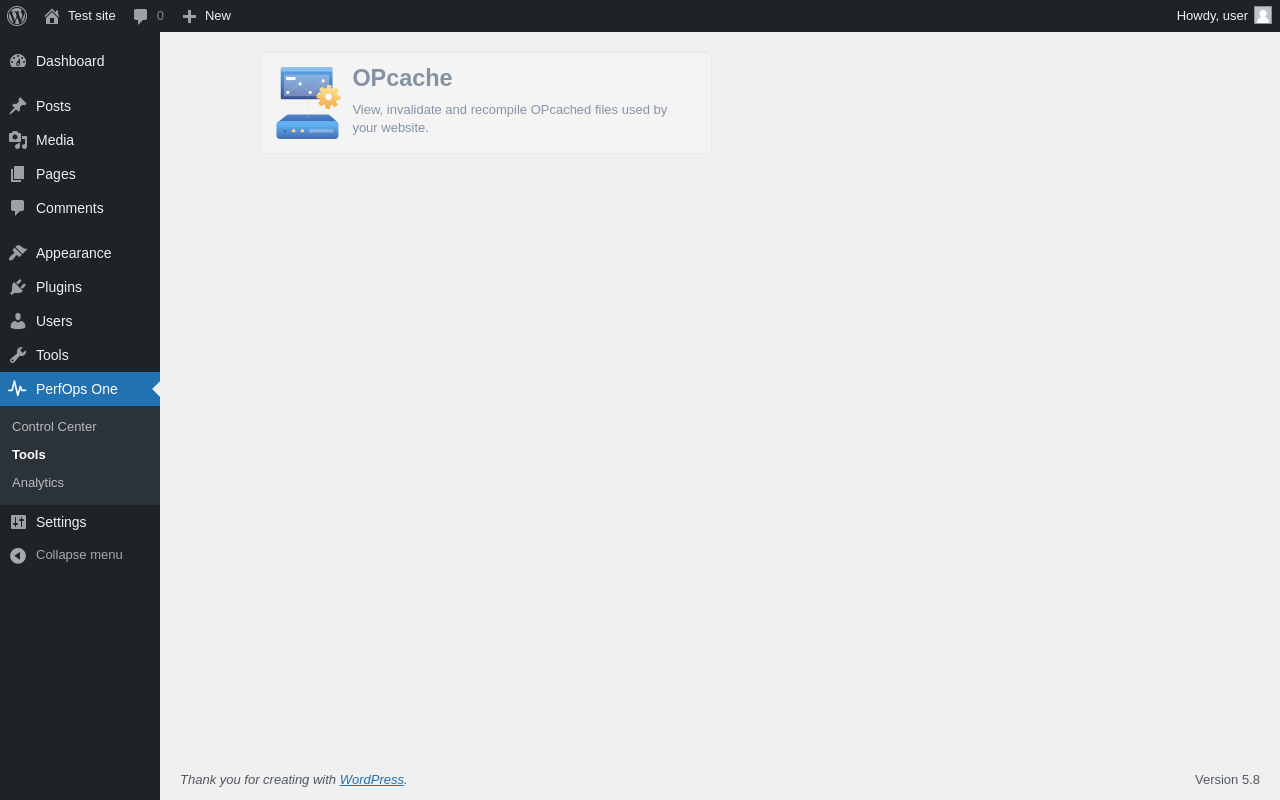
| URL | /wp-admin/admin.php?page=perfopsone-tools |
|---|---|
| Aspect | menu-item |
| HTTP status | 200 |
| Load time | 0.132 s |
| Memory usage | 3.11 MiB |
| JS errors | None |
| Resource errors | None |
PerfOps One → Analytics

| URL | /wp-admin/admin.php?page=perfopsone-analytics |
|---|---|
| Aspect | menu-item |
| HTTP status | 200 |
| Load time | 0.129 s |
| Memory usage | 3.11 MiB |
| JS errors | None |
| Resource errors | None |
Test site – Just another WordPress site
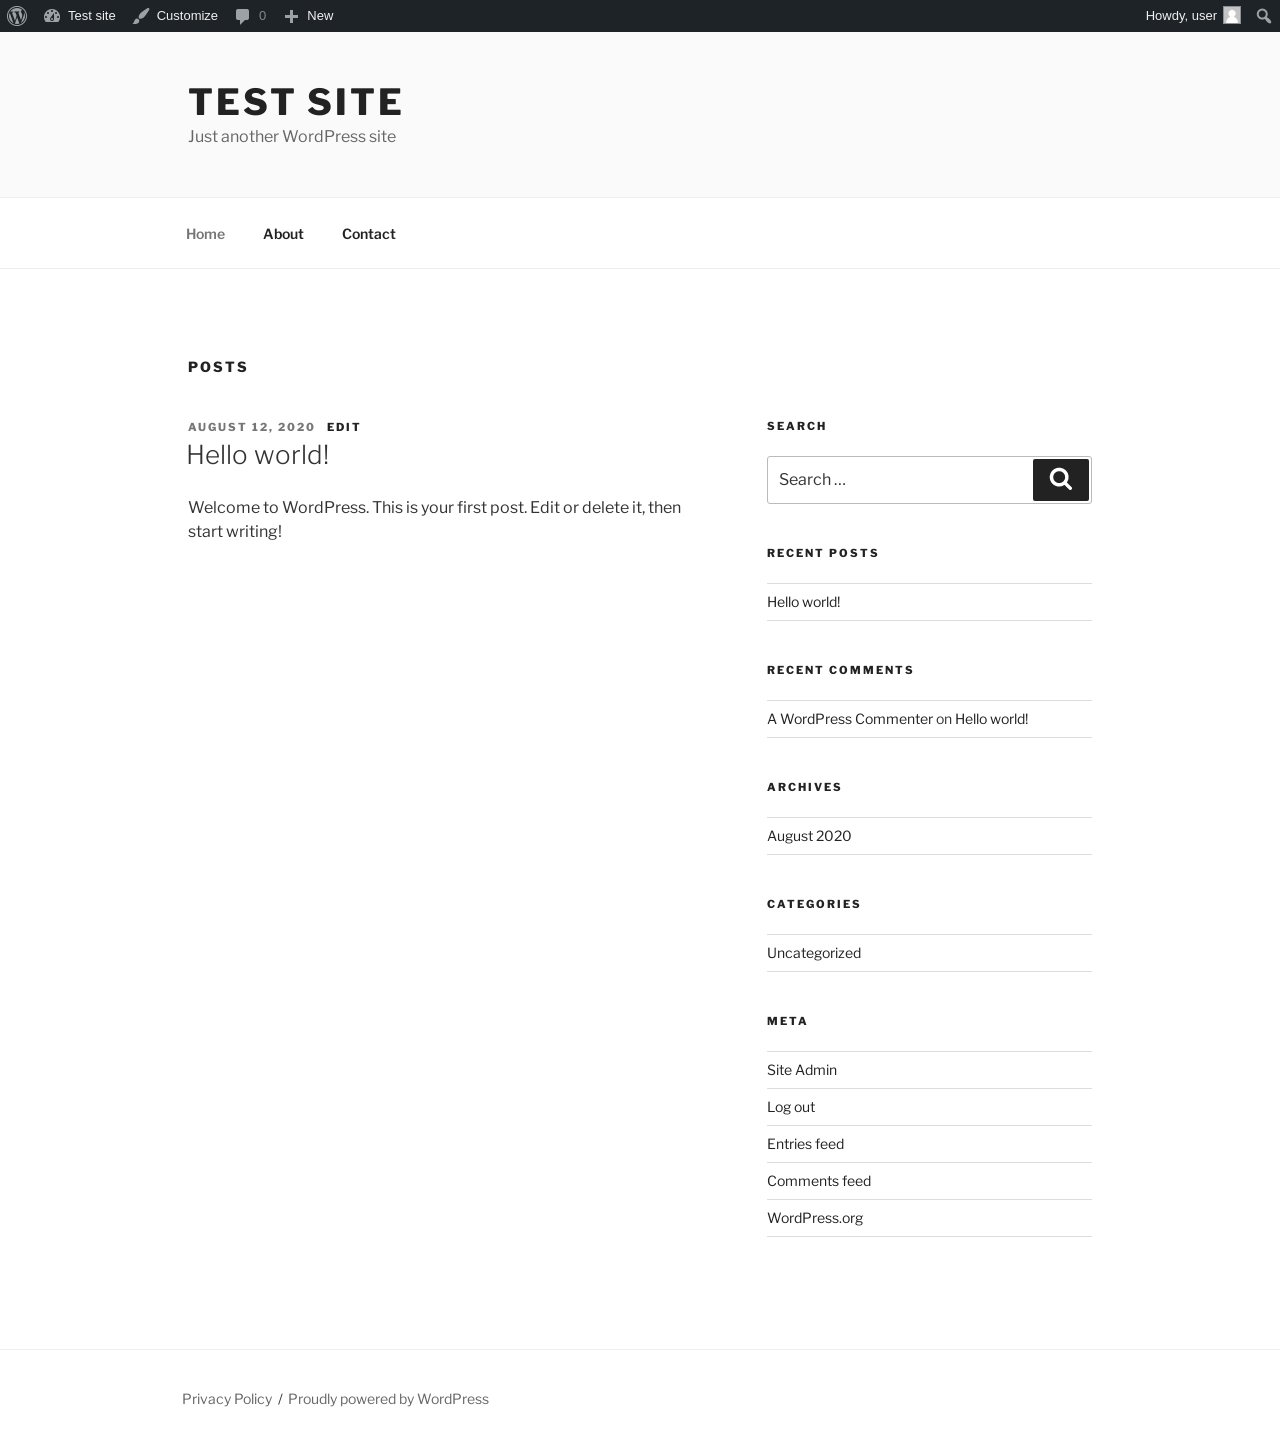
| URL | / |
|---|---|
| Aspect | front-page |
| HTTP status | 200 |
| Load time | 0.164 s |
| Memory usage | 2.98 MiB |
| JS errors | None |
| Resource errors | None |
Benchmark
| URL | Load time | Memory usage | ||||
|---|---|---|---|---|---|---|
| Inactive | Active | Change | Inactive | Active | Change | |
| /wp-admin/index.php | 0.300 s | 0.248 s | -0.052 s | 3.08 MiB | 3.26 MiB | + 178.24 KiB |
| /wp-admin/edit.php | 0.175 s | 0.180 s | +0.005 s | 3.11 MiB | 3.29 MiB | + 177.93 KiB |
| /wp-admin/post-new.php | 0.784 s | 1.127 s | +0.343 s | 5.27 MiB | 5.37 MiB | + 110.6 KiB |
| /wp-admin/upload.php | 0.518 s | 0.412 s | -0.106 s | 3.03 MiB | 3.13 MiB | + 105.4 KiB |
| /wp-admin/options-writing.php | 0.145 s | 0.140 s | -0.005 s | 3.02 MiB | 3.11 MiB | + 89.34 KiB |
| /wp-admin/media-new.php | 0.237 s | 0.205 s | -0.032 s | 3.01 MiB | 3.11 MiB | + 105.57 KiB |
| /wp-admin/edit-tags.php?taxonomy=category | 0.218 s | 0.176 s | -0.042 s | 3.04 MiB | 3.15 MiB | + 114.48 KiB |
| /wp-admin/post-new.php?post_type=page | 0.756 s | 0.622 s | -0.134 s | 5.26 MiB | 5.36 MiB | + 106.19 KiB |
| /wp-admin/options-discussion.php | 0.322 s | 0.238 s | -0.084 s | 3 MiB | 3.11 MiB | + 106.16 KiB |
| /wp-admin/edit-comments.php | 0.218 s | 0.351 s | +0.133 s | 3.04 MiB | 3.15 MiB | + 112.82 KiB |
| / | 0.313 s | 0.222 s | -0.091 s | 2.91 MiB | 2.98 MiB | + 67.74 KiB |
| Average | 0.362 s | 0.356 s | -0.006 s | 3.43 MiB | 3.55 MiB | + 115.86 KiB |
Code Statistics
Note: Third-party libraries and minified JS/CSS files are excluded from these statistics where possible, so the numbers you see here may be lower than those reported by other tools.
| Language | % | Lines of code | Comment lines | Files | |
|---|---|---|---|---|---|
| JavaScript | 52.4% | 17,079 | 2,275 | 6 | |
| PHP | 28.4% | 9,248 | 6,708 | 107 | |
| SVG | 13.0% | 4,240 | 1 | 284 | |
| CSS | 5.3% | 1,743 | 1 | 6 | |
| Markdown | 0.8% | 254 | 0 | 6 | |
| JSON | 0.2% | 53 | 0 | 2 | |
| Total | 32,617 | 8,985 | 411 | ||
PHP Code Analysis | More results »
| Lines of code | 8,953 |
|---|---|
| Total complexity | 2,072 |
| Median class complexity | 16.0 |
| Median method complexity | 2.0 |
| Most complex class | OPcacheManager\Plugin\Feature\Analytics |
| Most complex function | OPcacheManager\Plugin\Feature\Analytics::query_kpi() |
| Classes | 64 |
|---|---|
| Methods | 455 |
| Functions | 6 |
Additions
Things that the plugin adds to the site. This section is not intended to be comprehensive. The test tool only looks for a few specific types of added content.
Database Tables 1
- wp_opcm_statistics
Options wp_options 2
- opcm_nags
- opcm_version
PHP Error Log
The log file is empty.