OPcache Manager 2.0.0
Does OPcache Manager work with WordPress 5.5.3 and PHP 7.4.8? A smoke test was performed on .
Summary
Errors
| No PHP errors, warnings or notices | |
| No JavaScript exceptions | |
| All test pages loaded successfully | |
| No resource errors | |
| Looks good! No problems were detected. |
Performance
Memory usage: 86.65 KiB
The average PHP memory usage increased by this amount after activating by the plugin.
Page speed impact:
insignificant.
The plugin didn't make the site noticeably slower.
Environment
| WordPress version | 5.5.3 |
|---|---|
| PHP version | 7.4.8 |
| MySQL version | 8.0.21 |
| PHP memory limit | 256M |
Plugin Info
| Last updated | |
|---|---|
| Active installs | 1,000+ |
| WordPress.org page | https://wordpress.org/plugins/opcache-manager/ |
| Badges |
|
Pages 10
Plugins ‹ Test site — WordPress
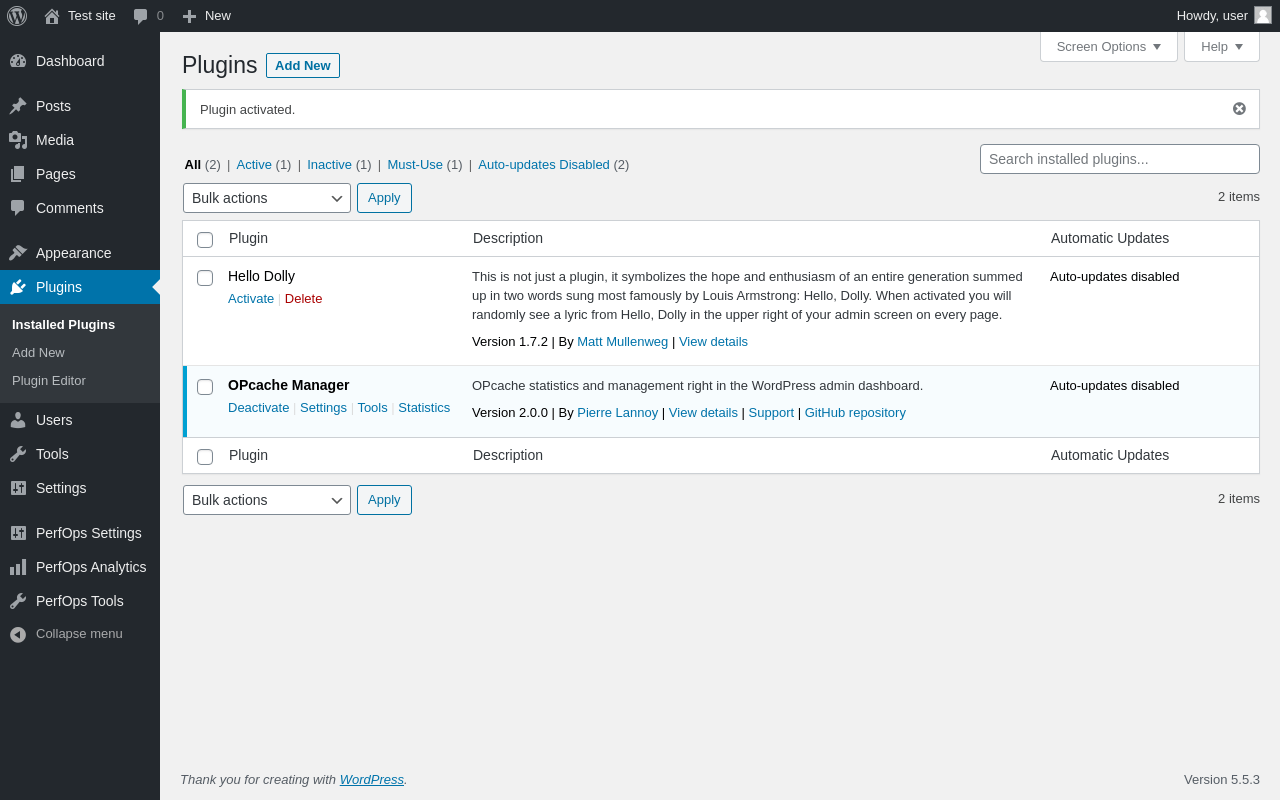
| URL | /wp-admin/plugins.php?plugin_status=all&paged=1&s |
|---|---|
| Requested URL | /wp-admin/plugins.php?action=activate&plugin=opcache-manager%2Fopcache-manager.php&plugin_status=all&paged=1&s&_wpnonce=baa9c64076 |
| Aspect | after-activation |
| HTTP status | 200 |
| Load time | 0.418 s |
| Memory usage | 2.87 MiB |
| JS errors | None |
| Resource errors | None |
PerfOps Settings
| URL | /wp-admin/admin.php?page=perfopsone-settings |
|---|---|
| Aspect | menu-item |
| HTTP status | 200 |
| Load time | 0.364 s |
| Memory usage | 3.05 MiB |
| JS errors | None |
| Resource errors | None |
PerfOps Settings → OPcache Manager
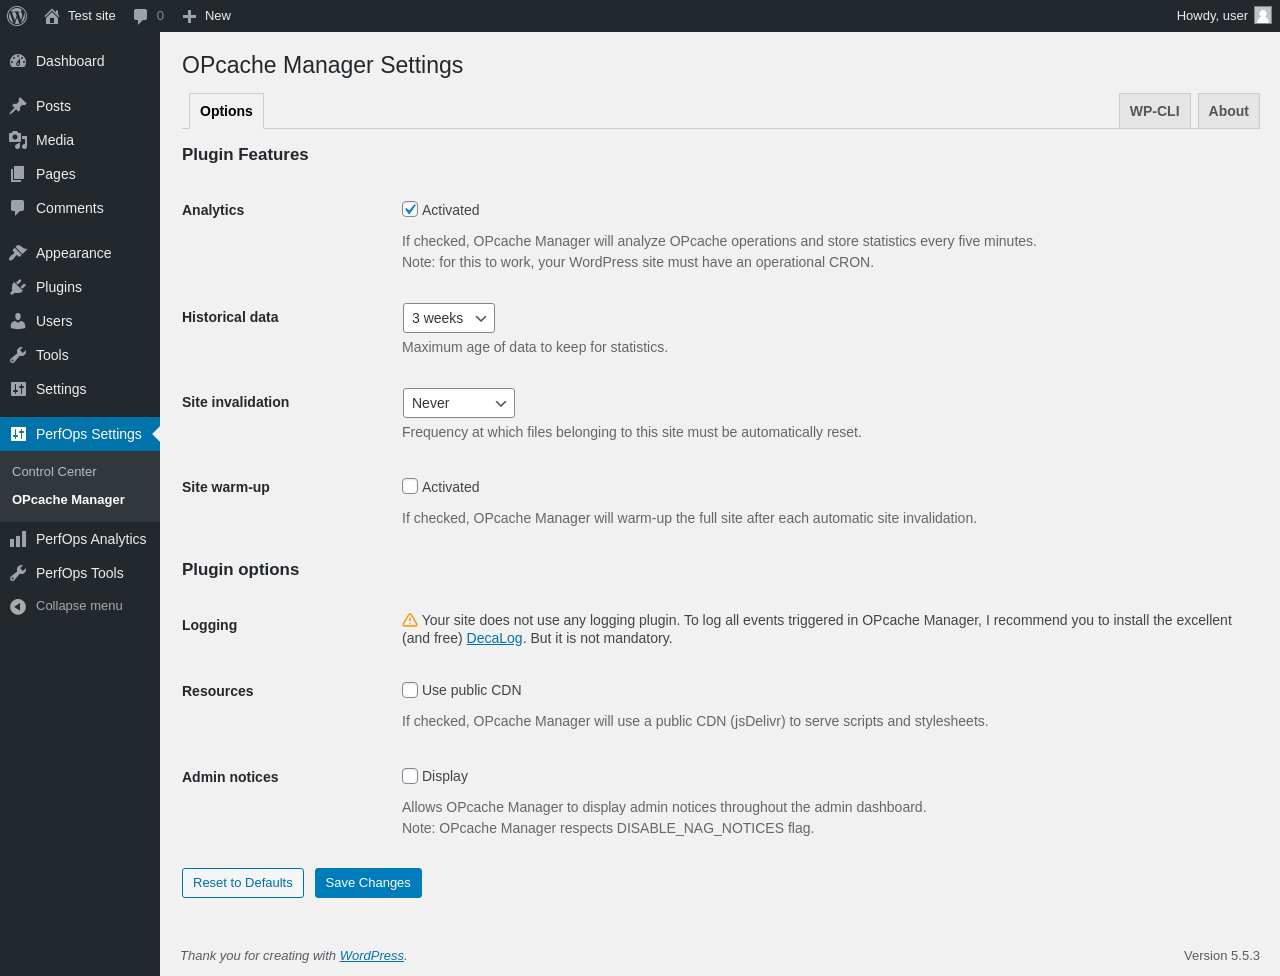
| URL | /wp-admin/admin.php?page=opcm-settings |
|---|---|
| Aspect | menu-item |
| HTTP status | 200 |
| Load time | 0.155 s |
| Memory usage | 2.83 MiB |
| JS errors | None |
| Resource errors | None |
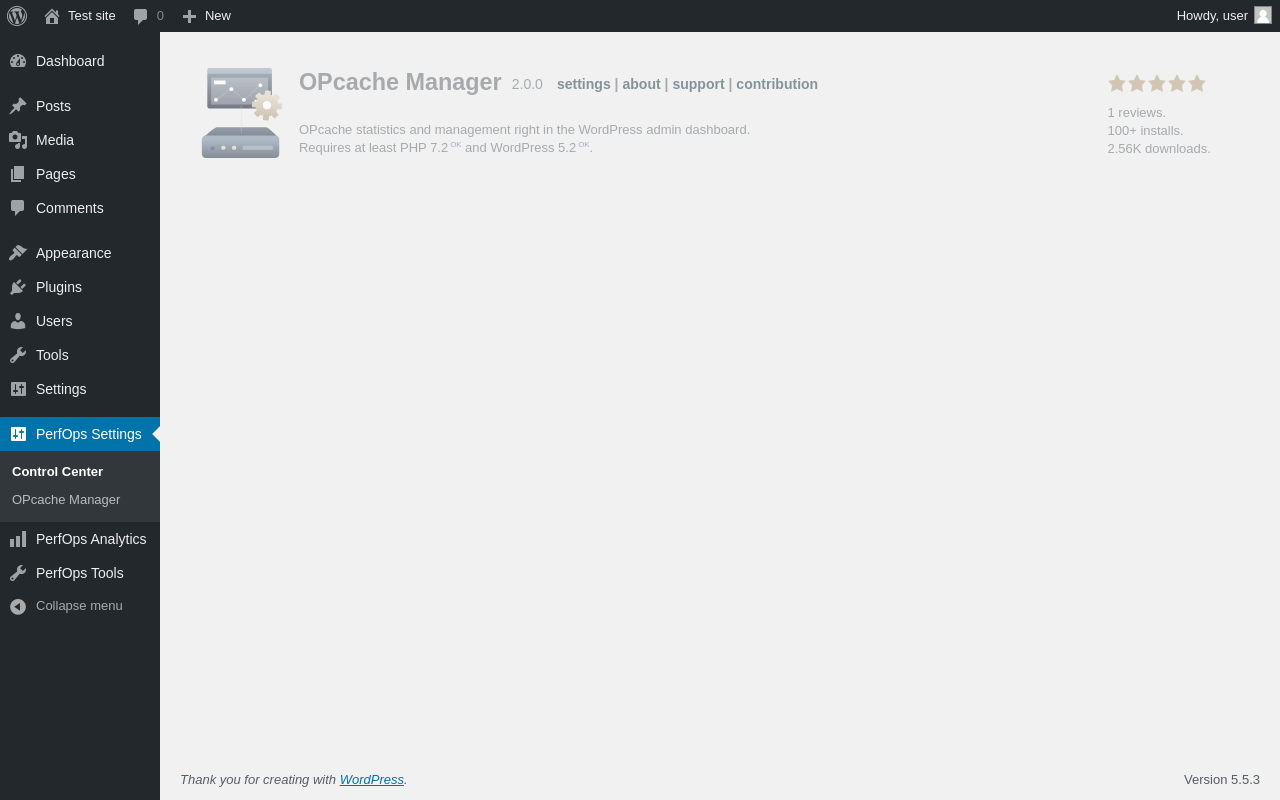
PerfOps Settings → OPcache Manager → About
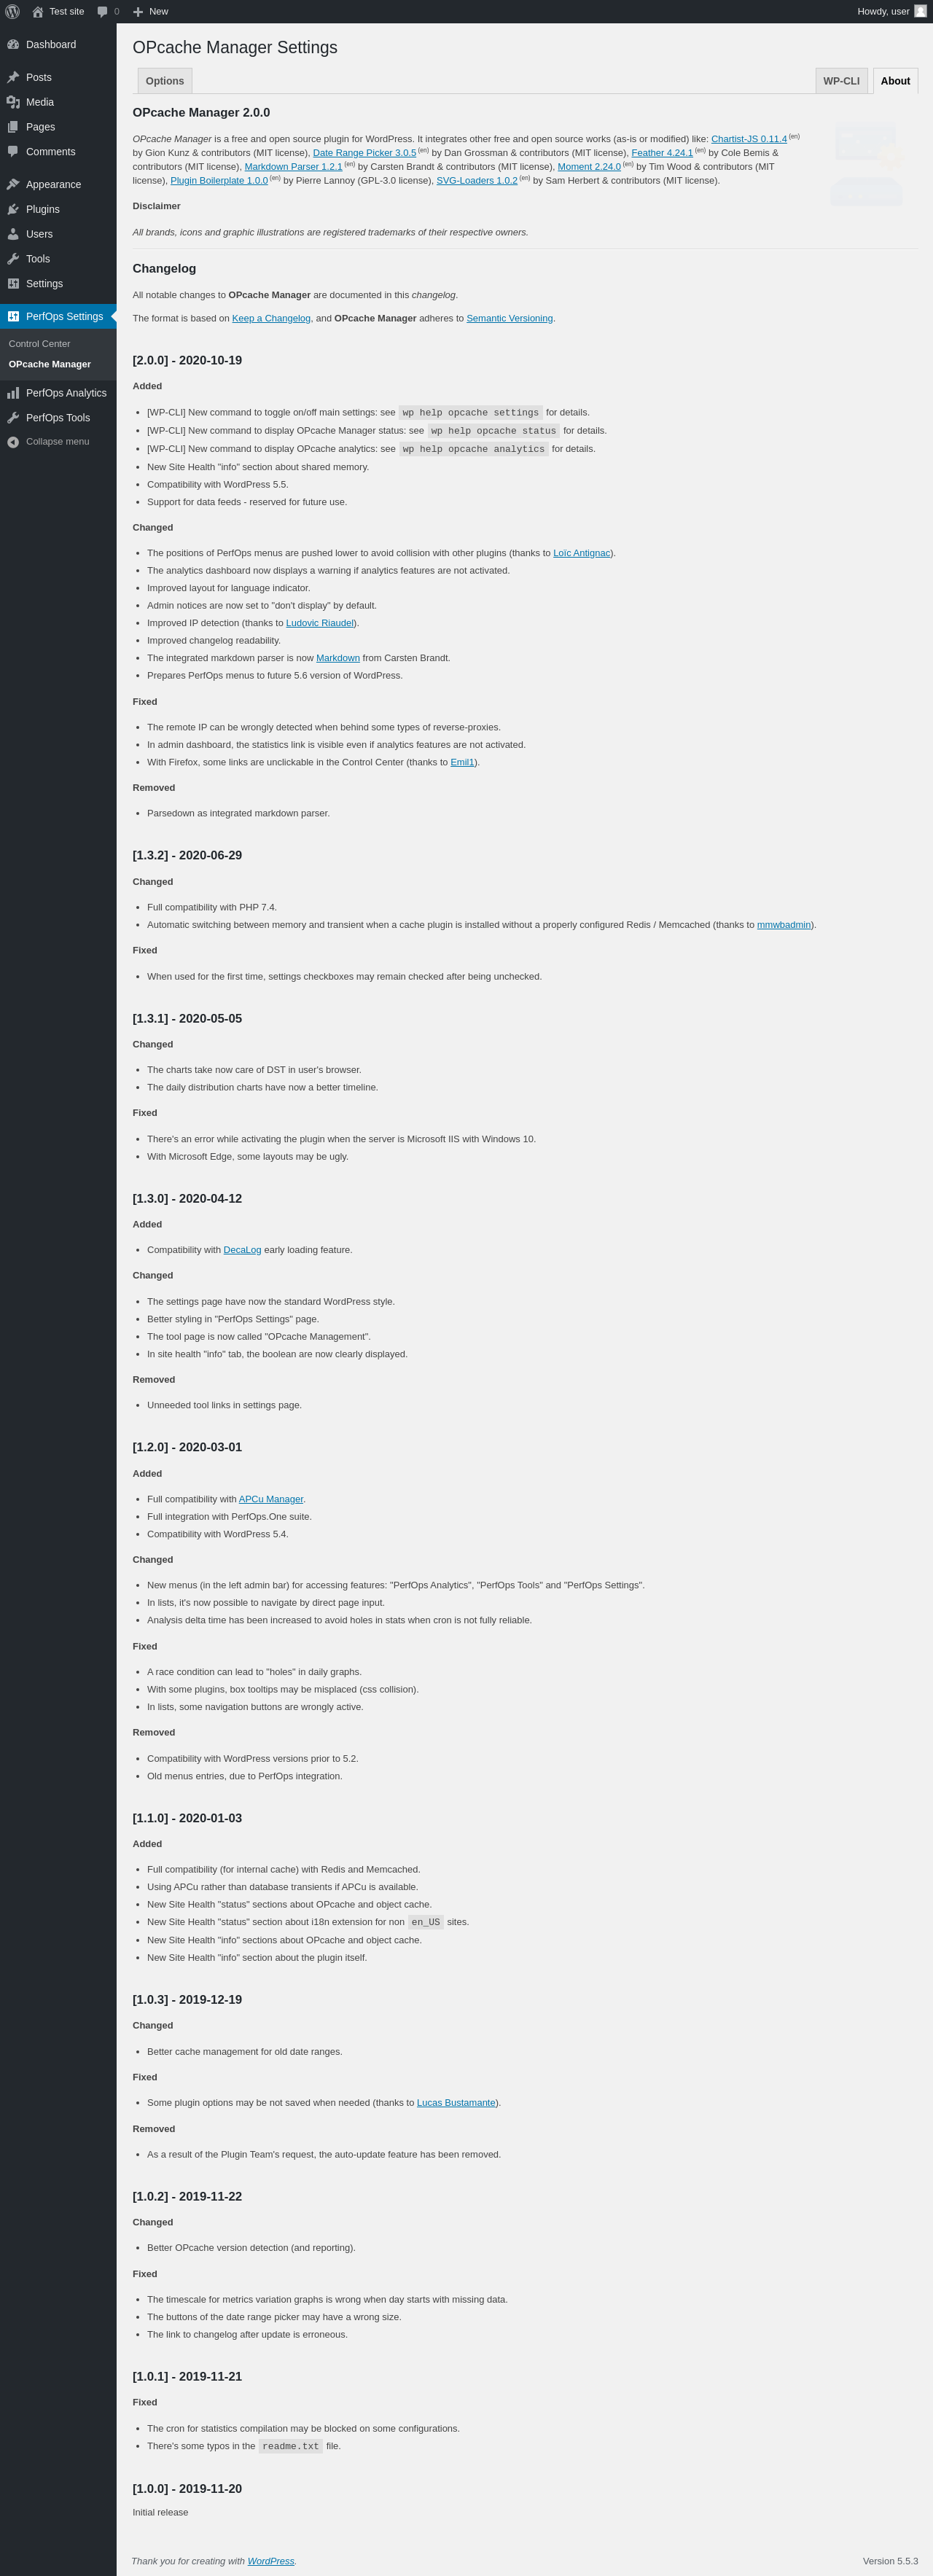
| URL | /wp-admin/admin.php?page=opcm-settings&tab=about |
|---|---|
| Aspect | menu-item-tab |
| HTTP status | 200 |
| Load time | 0.195 s |
| Memory usage | 3.02 MiB |
| JS errors | None |
| Resource errors | None |
PerfOps Settings → OPcache Manager → WP-CLI
| URL | /wp-admin/admin.php?page=opcm-settings&tab=wpcli |
|---|---|
| Aspect | menu-item-tab |
| HTTP status | 200 |
| Load time | 0.190 s |
| Memory usage | 2.84 MiB |
| JS errors | None |
| Resource errors | None |
PerfOps Analytics
| URL | /wp-admin/admin.php?page=perfopsone-analytics |
|---|---|
| Aspect | menu-item |
| HTTP status | 200 |
| Load time | 0.172 s |
| Memory usage | 2.69 MiB |
| JS errors | None |
| Resource errors | None |
PerfOps Analytics → OPcache
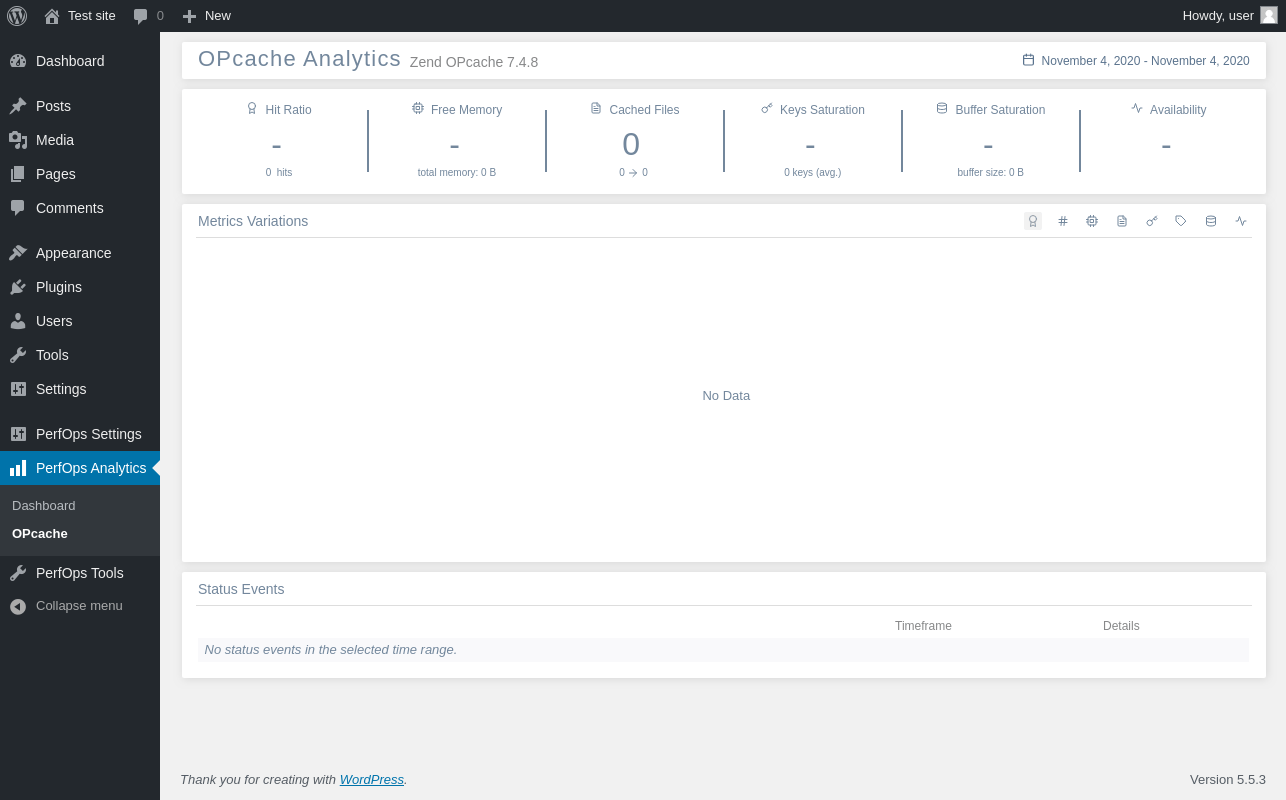
| URL | /wp-admin/admin.php?page=opcm-viewer |
|---|---|
| Aspect | menu-item |
| HTTP status | 200 |
| Load time | 0.663 s |
| Memory usage | 3.81 MiB |
| JS errors | None |
| Resource errors | None |
PerfOps Tools
| URL | /wp-admin/admin.php?page=perfopsone-tools |
|---|---|
| Aspect | menu-item |
| HTTP status | 200 |
| Load time | 0.150 s |
| Memory usage | 2.69 MiB |
| JS errors | None |
| Resource errors | None |
PerfOps Tools → OPcache
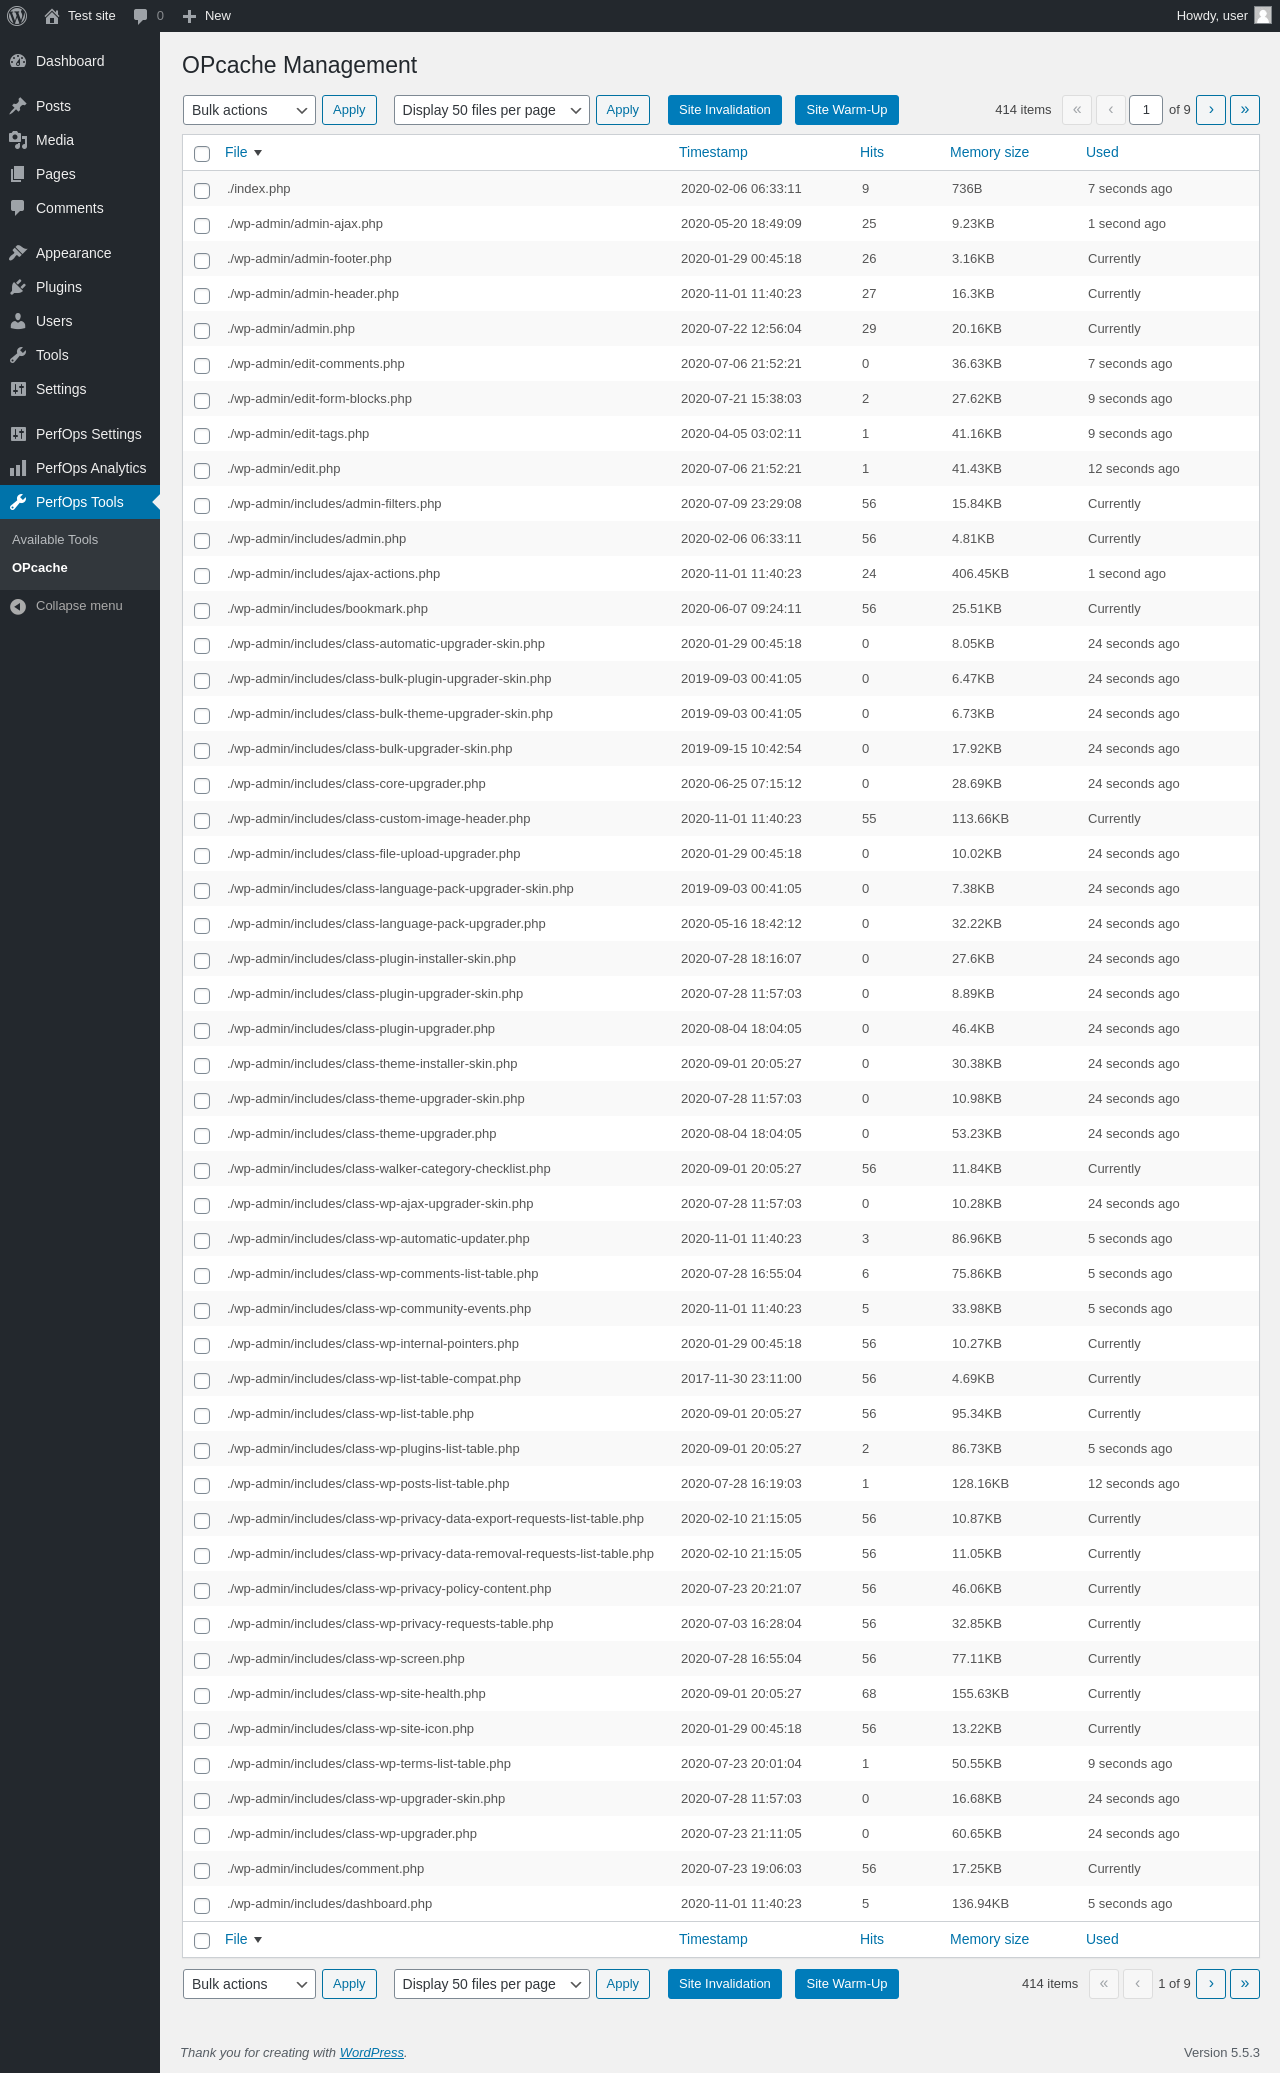
| URL | /wp-admin/admin.php?page=opcm-tools |
|---|---|
| Aspect | menu-item |
| HTTP status | 200 |
| Load time | 0.234 s |
| Memory usage | 3.26 MiB |
| JS errors | None |
| Resource errors | None |
Test site – Just another WordPress site
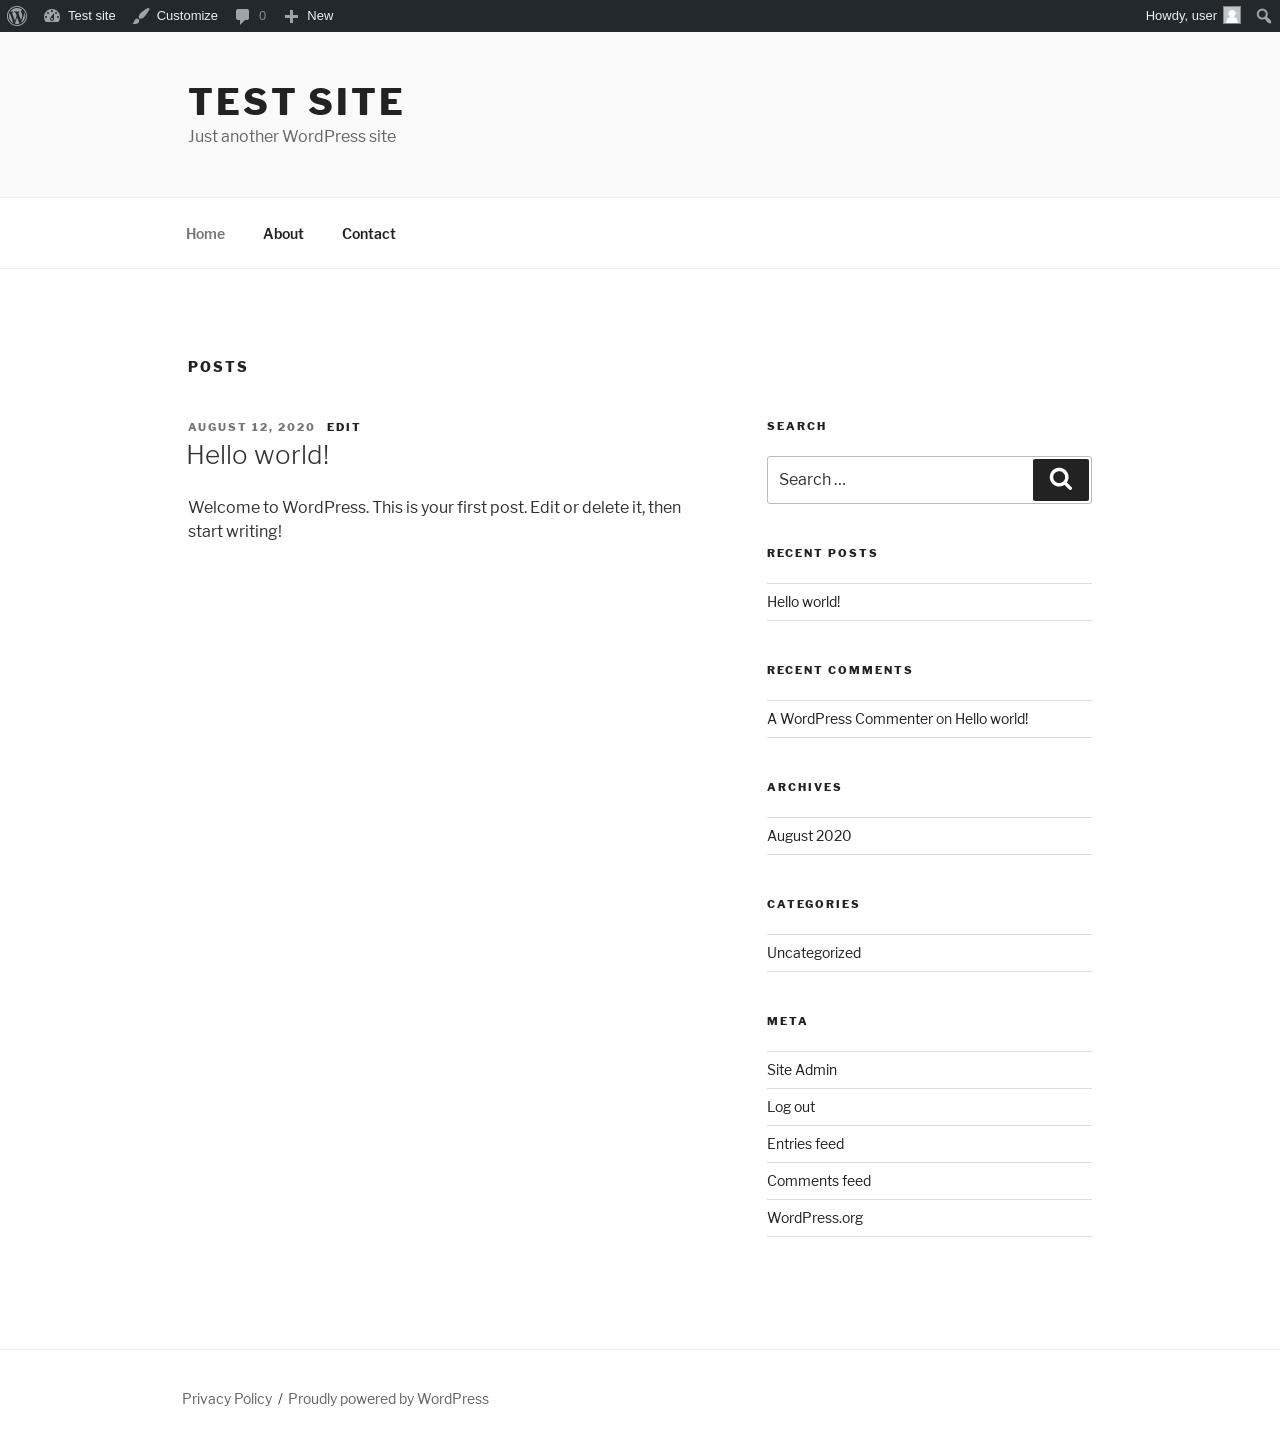
| URL | / |
|---|---|
| Aspect | front-page |
| HTTP status | 200 |
| Load time | 0.239 s |
| Memory usage | 2.62 MiB |
| JS errors | None |
| Resource errors | None |
Benchmark
| URL | Load time | Memory usage | ||||
|---|---|---|---|---|---|---|
| Inactive | Active | Change | Inactive | Active | Change | |
| /wp-admin/index.php | 0.503 s | 0.423 s | -0.080 s | 2.75 MiB | 2.83 MiB | + 77.81 KiB |
| /wp-admin/edit.php | 0.226 s | 0.238 s | +0.012 s | 2.8 MiB | 2.87 MiB | + 77.5 KiB |
| /wp-admin/post-new.php | 1.533 s | 1.950 s | +0.417 s | 4.54 MiB | 4.63 MiB | + 90.17 KiB |
| /wp-admin/upload.php | 0.707 s | 0.402 s | -0.305 s | 2.63 MiB | 2.7 MiB | + 76.41 KiB |
| /wp-admin/options-writing.php | 0.165 s | 0.158 s | -0.007 s | 2.64 MiB | 2.69 MiB | + 44.35 KiB |
| /wp-admin/media-new.php | 0.215 s | 0.193 s | -0.022 s | 2.6 MiB | 2.68 MiB | + 76.58 KiB |
| /wp-admin/edit-tags.php?taxonomy=category | 0.187 s | 0.190 s | +0.003 s | 2.64 MiB | 2.78 MiB | + 141.48 KiB |
| /wp-admin/post-new.php?post_type=page | 1.379 s | 1.337 s | -0.042 s | 4.53 MiB | 4.62 MiB | + 85.76 KiB |
| /wp-admin/options-discussion.php | 0.264 s | 0.528 s | +0.264 s | 2.61 MiB | 2.68 MiB | + 77.17 KiB |
| /wp-admin/edit-comments.php | 0.212 s | 0.223 s | +0.011 s | 2.65 MiB | 2.78 MiB | + 140.43 KiB |
| / | 0.316 s | 0.276 s | -0.040 s | 2.56 MiB | 2.62 MiB | + 65.52 KiB |
| Average | 0.519 s | 0.538 s | +0.019 s | 3 MiB | 3.08 MiB | + 86.65 KiB |
Additions
Things that the plugin adds to the site. This section is not intended to be comprehensive. The test tool only looks for a few specific types of added content.
Database Tables 1
- wp_opcm_statistics
Options wp_options 2
- opcm_nags
- opcm_version
PHP Error Log
The log file is empty.