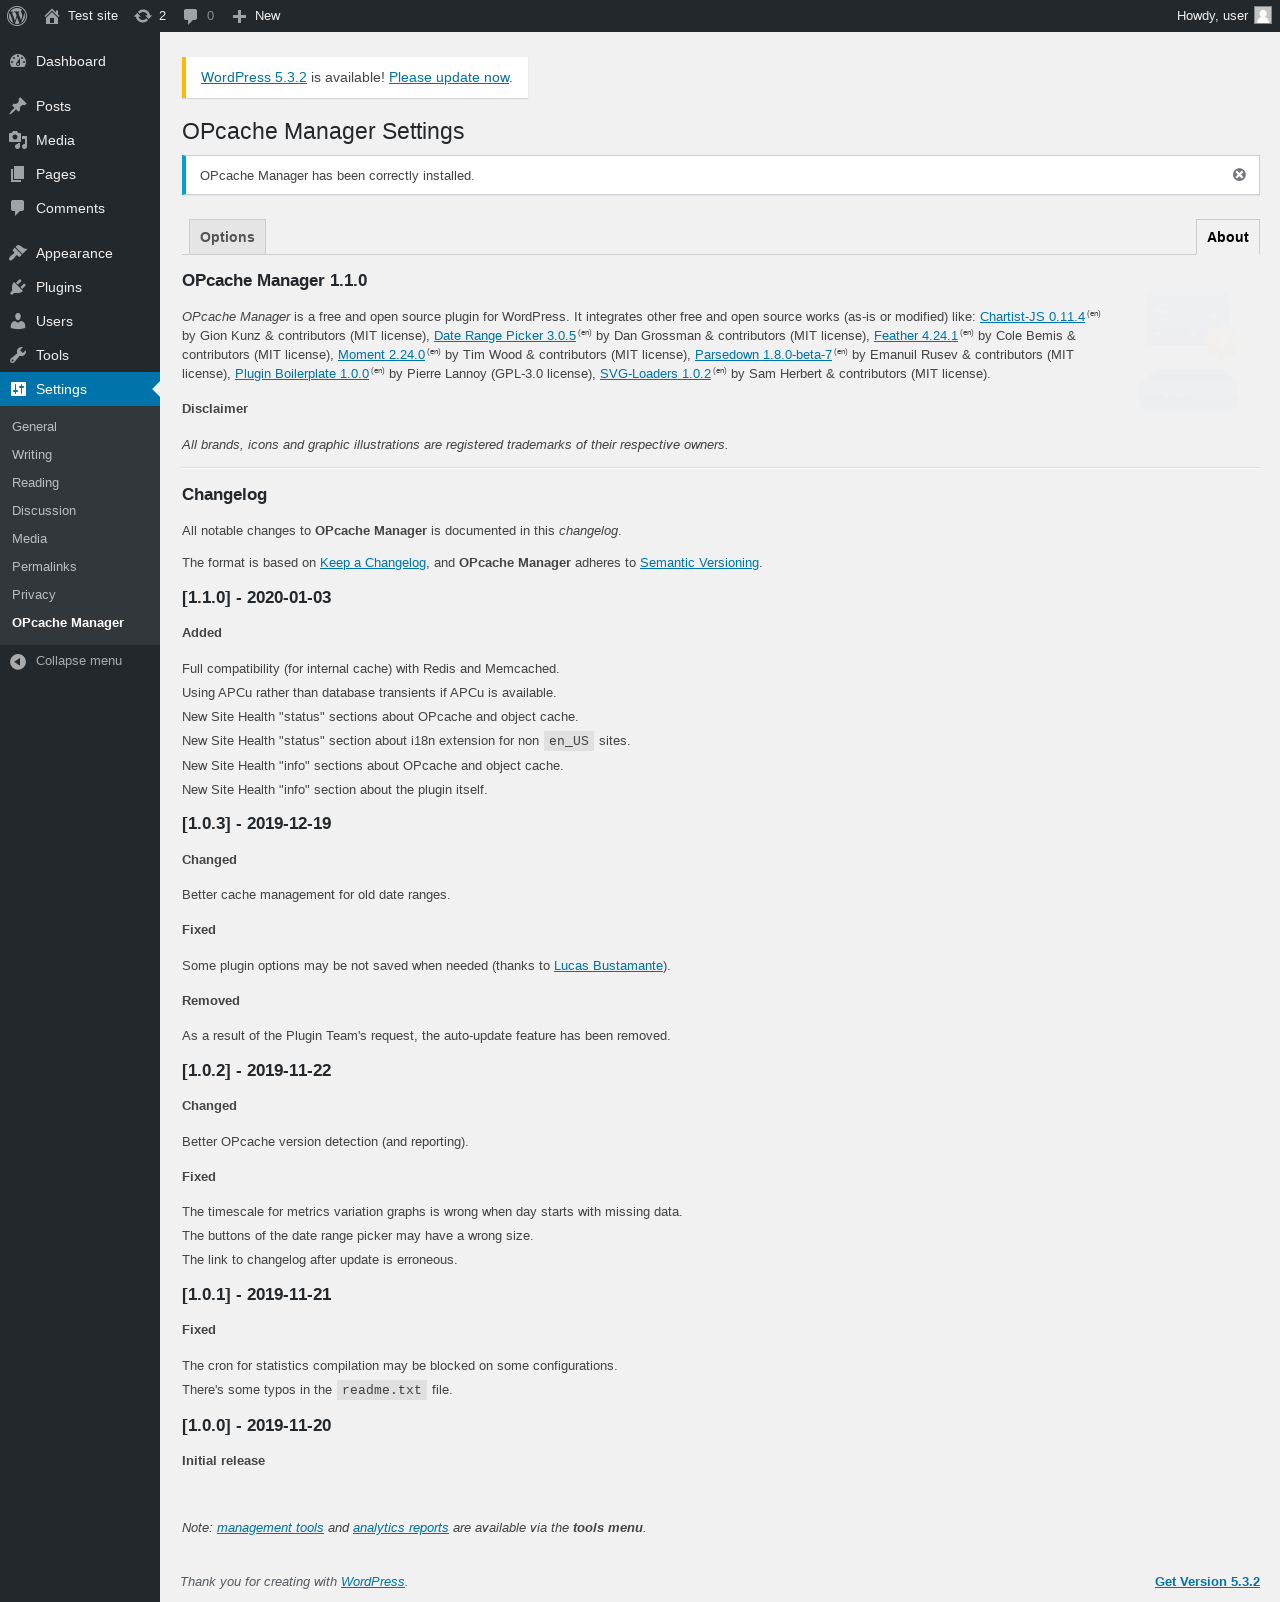
OPcache Manager 1.1.0
Does OPcache Manager work with WordPress 5.3.2 and PHP 7.2.16? A smoke test was performed on .
Summary
Errors
| No PHP errors, warnings or notices | |
| No JavaScript exceptions | |
| All test pages loaded successfully | |
| No resource errors | |
| Looks good! No problems were detected. |
Performance
Memory usage: 112.58 KiB
The average PHP memory usage increased by this amount after activating by the plugin.
Page speed impact:
insignificant.
The plugin didn't make the site noticeably slower.
Environment
| WordPress version | 5.3.2 |
|---|---|
| PHP version | 7.2.16 |
| MySQL version | 8.0.15 |
| PHP memory limit | 256M |
Plugin Info
| Last updated | |
|---|---|
| Active installs | 1,000+ |
| WordPress.org page | https://wordpress.org/plugins/opcache-manager/ |
| Badges |
|
Pages 6
Plugins ‹ Test site — WordPress
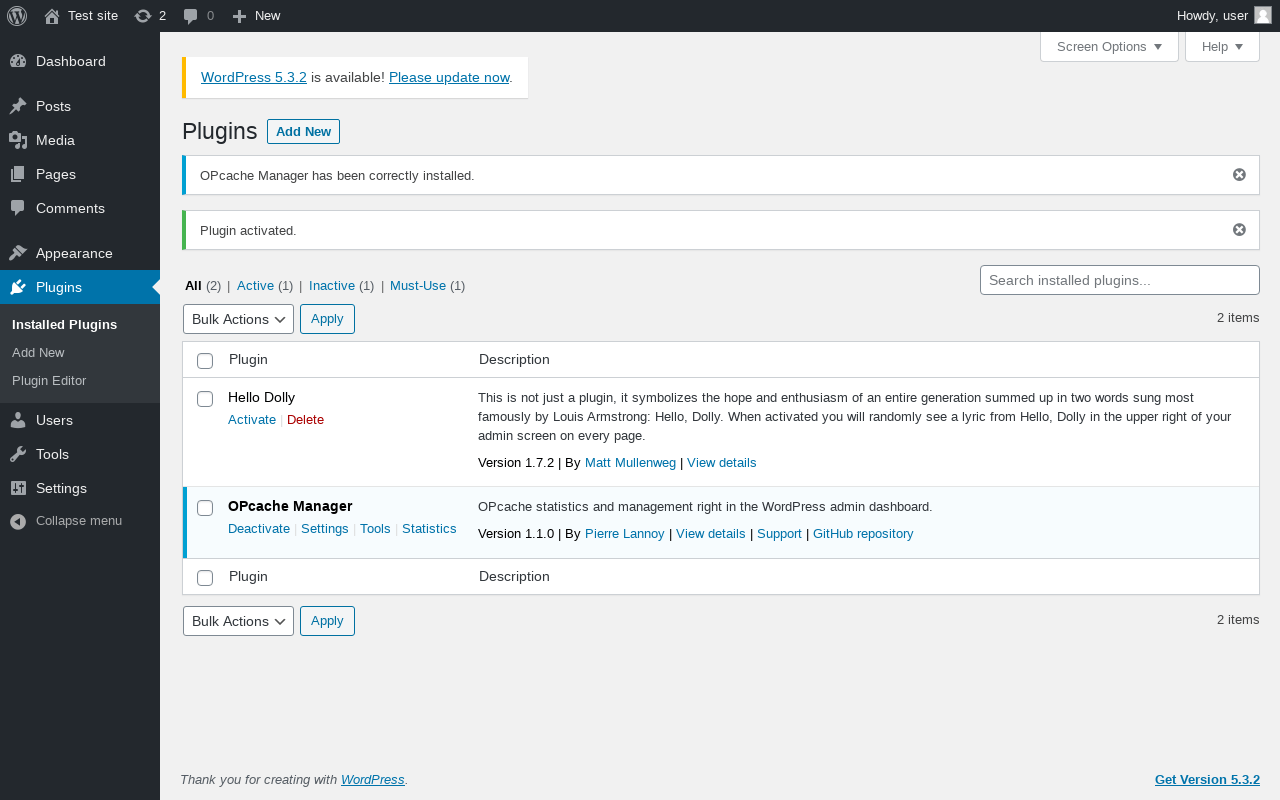
| URL | /wp-admin/plugins.php?plugin_status=all&paged=1&s |
|---|---|
| Requested URL | /wp-admin/plugins.php?action=activate&plugin=opcache-manager%2Fopcache-manager.php&plugin_status=all&paged=1&s&_wpnonce=62fb325328 |
| Aspect | after-activation |
| HTTP status | 200 |
| Load time | 0.541 s |
| Memory usage | 3.64 MiB |
| JS errors | None |
| Resource errors | None |
Tools → OPcache Tools
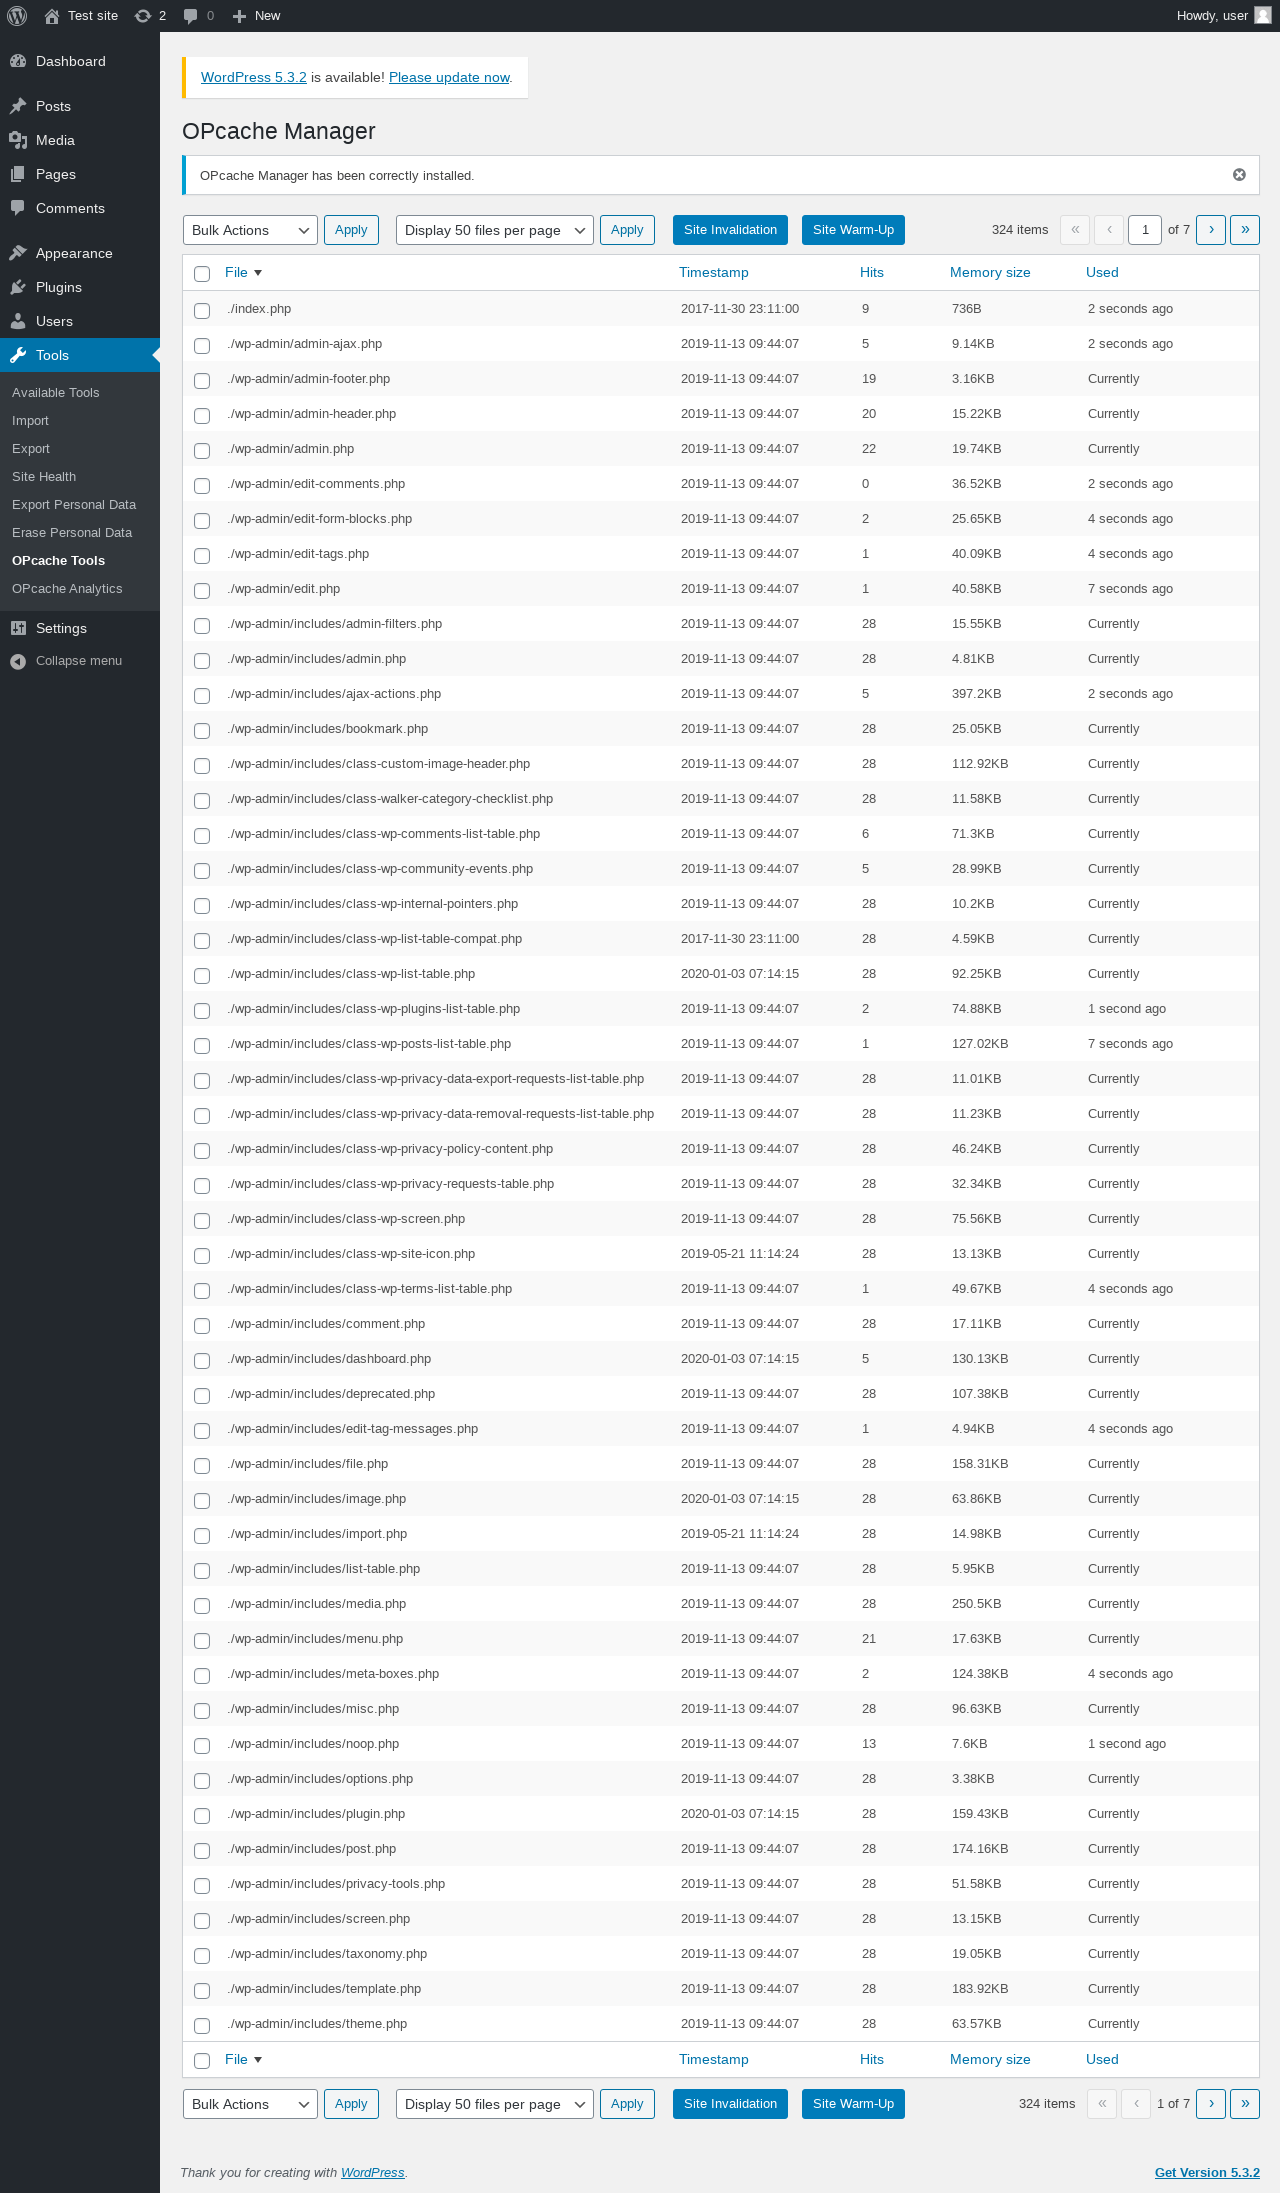
| URL | /wp-admin/tools.php?page=opcm-tools |
|---|---|
| Aspect | menu-item |
| HTTP status | 200 |
| Load time | 0.268 s |
| Memory usage | 4 MiB |
| JS errors | None |
| Resource errors | None |
Tools → OPcache Analytics
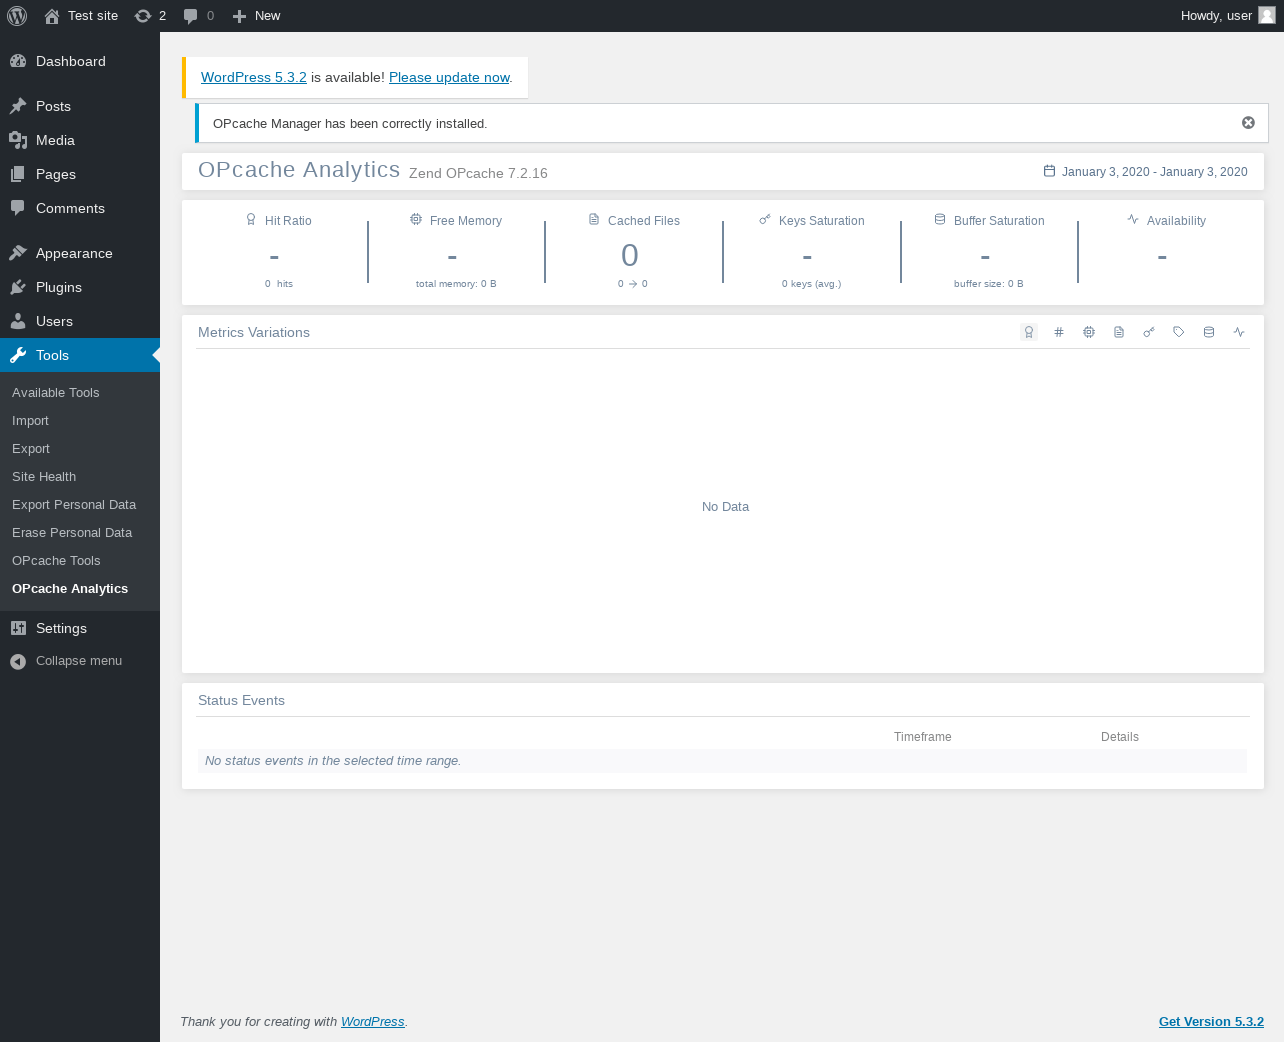
| URL | /wp-admin/tools.php?page=opcm-viewer |
|---|---|
| Aspect | menu-item |
| HTTP status | 200 |
| Load time | 0.639 s |
| Memory usage | 4.6 MiB |
| JS errors | None |
| Resource errors | None |
Settings → OPcache Manager
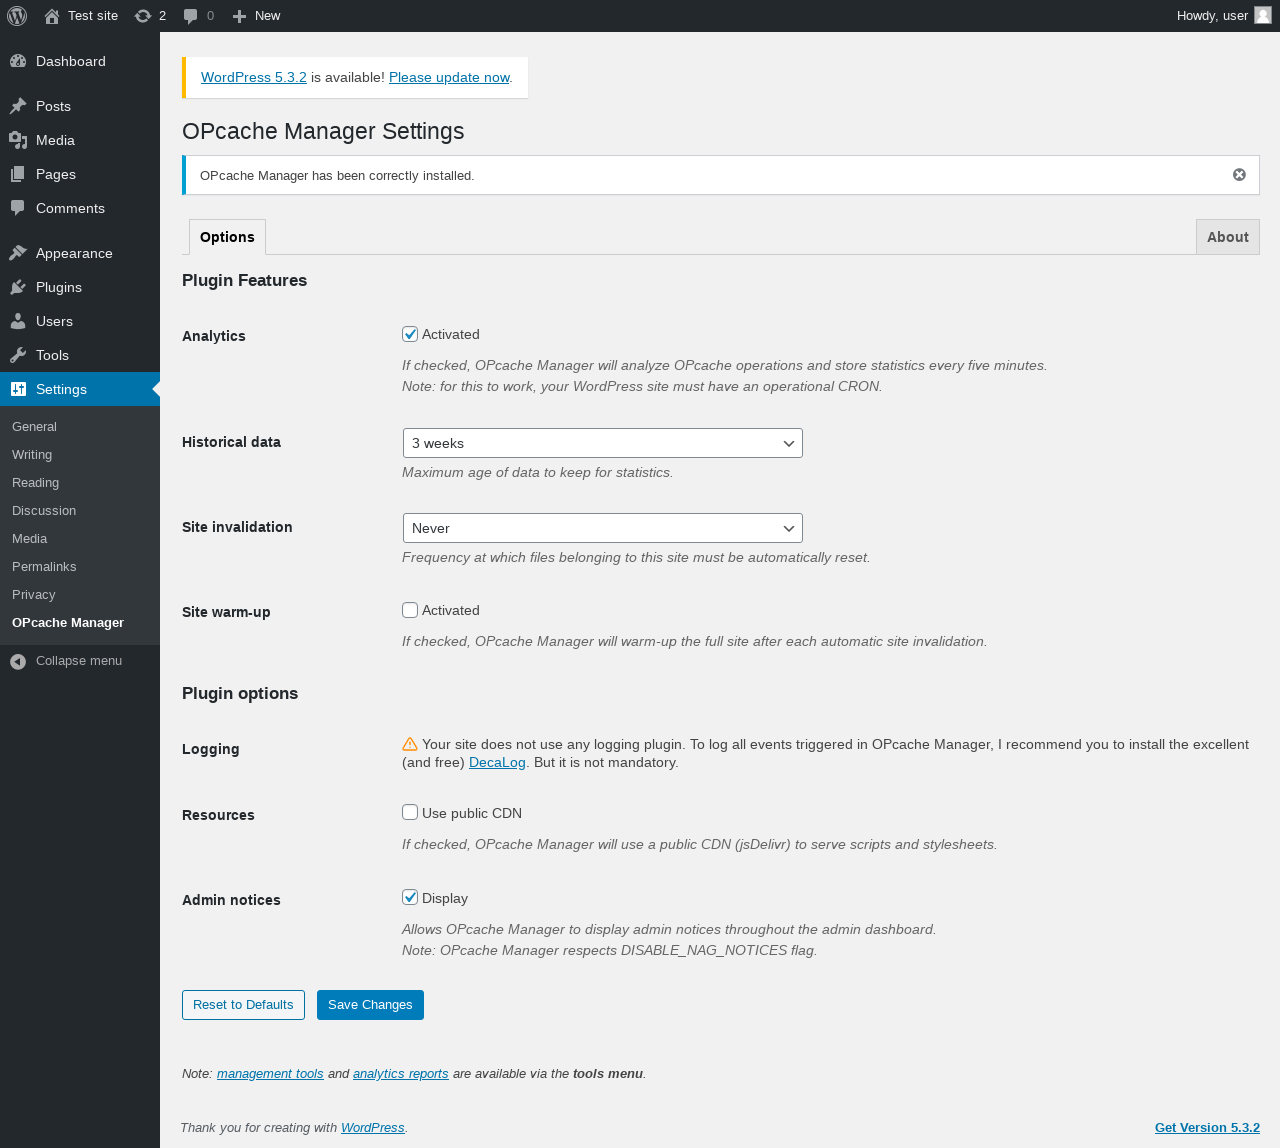
| URL | /wp-admin/options-general.php?page=opcm-settings |
|---|---|
| Aspect | menu-item |
| HTTP status | 200 |
| Load time | 0.170 s |
| Memory usage | 3.79 MiB |
| JS errors | None |
| Resource errors | None |
Settings → OPcache Manager → About
| URL | /wp-admin/options-general.php?page=opcm-settings&tab=about |
|---|---|
| Aspect | menu-item-tab |
| HTTP status | 200 |
| Load time | 0.189 s |
| Memory usage | 4.39 MiB |
| JS errors | None |
| Resource errors | None |
Test site – Just another WordPress site
| URL | / |
|---|---|
| Aspect | front-page |
| HTTP status | 200 |
| Load time | 0.245 s |
| Memory usage | 3.35 MiB |
| JS errors | None |
| Resource errors | None |
Benchmark
| URL | Load time | Memory usage | ||||
|---|---|---|---|---|---|---|
| Inactive | Active | Change | Inactive | Active | Change | |
| /wp-admin/index.php | 0.320 s | 0.291 s | -0.029 s | 3.62 MiB | 3.75 MiB | + 135.91 KiB |
| /wp-admin/edit.php | 0.229 s | 0.239 s | +0.010 s | 3.65 MiB | 3.78 MiB | + 135.91 KiB |
| /wp-admin/post-new.php | 1.361 s | 1.829 s | +0.468 s | 5.36 MiB | 5.49 MiB | + 134.63 KiB |
| /wp-admin/upload.php | 0.506 s | 0.464 s | -0.042 s | 3.48 MiB | 3.61 MiB | + 135.23 KiB |
| /wp-admin/options-writing.php | 0.168 s | 0.160 s | -0.008 s | 3.56 MiB | 3.61 MiB | + 44.77 KiB |
| /wp-admin/media-new.php | 0.210 s | 0.197 s | -0.013 s | 3.46 MiB | 3.6 MiB | + 135.75 KiB |
| /wp-admin/edit-tags.php?taxonomy=category | 0.330 s | 0.195 s | -0.135 s | 3.57 MiB | 3.64 MiB | + 71.85 KiB |
| /wp-admin/post-new.php?post_type=page | 1.310 s | 1.331 s | +0.021 s | 5.35 MiB | 5.48 MiB | + 127.81 KiB |
| /wp-admin/options-discussion.php | 0.252 s | 0.251 s | -0.001 s | 3.47 MiB | 3.6 MiB | + 136.04 KiB |
| /wp-admin/edit-comments.php | 0.314 s | 0.229 s | -0.085 s | 3.57 MiB | 3.7 MiB | + 134.76 KiB |
| / | 0.327 s | 0.221 s | -0.106 s | 3.32 MiB | 3.36 MiB | + 45.72 KiB |
| Average | 0.484 s | 0.492 s | +0.007 s | 3.86 MiB | 3.97 MiB | + 112.58 KiB |
Additions
Things that the plugin adds to the site. This section is not intended to be comprehensive. The test tool only looks for a few specific types of added content.
Database Tables 1
- wp_opcm_statistics
Options wp_options 2
- opcm_nags
- opcm_version
PHP Error Log
The log file is empty.