OPcache Manager 1.0.2
Does OPcache Manager work with WordPress 5.3.1 and PHP 7.2.16? A smoke test was performed on .
Summary
Errors
| No PHP errors, warnings or notices | |
| No JavaScript exceptions | |
| All test pages loaded successfully | |
| No resource errors | |
| Looks good! No problems were detected. |
Performance
Memory usage: 105.61 KiB
The average PHP memory usage increased by this amount after activating by the plugin.
Page speed impact:
0.036 seconds
The average page load time increased by this amount after activating the plugin.
Environment
| WordPress version | 5.3.1 |
|---|---|
| PHP version | 7.2.16 |
| MySQL version | 8.0.15 |
| PHP memory limit | 256M |
Plugin Info
| Last updated | |
|---|---|
| Active installs | 1,000+ |
| WordPress.org page | https://wordpress.org/plugins/opcache-manager/ |
| Badges |
|
Pages 6
Plugins ‹ Test site — WordPress
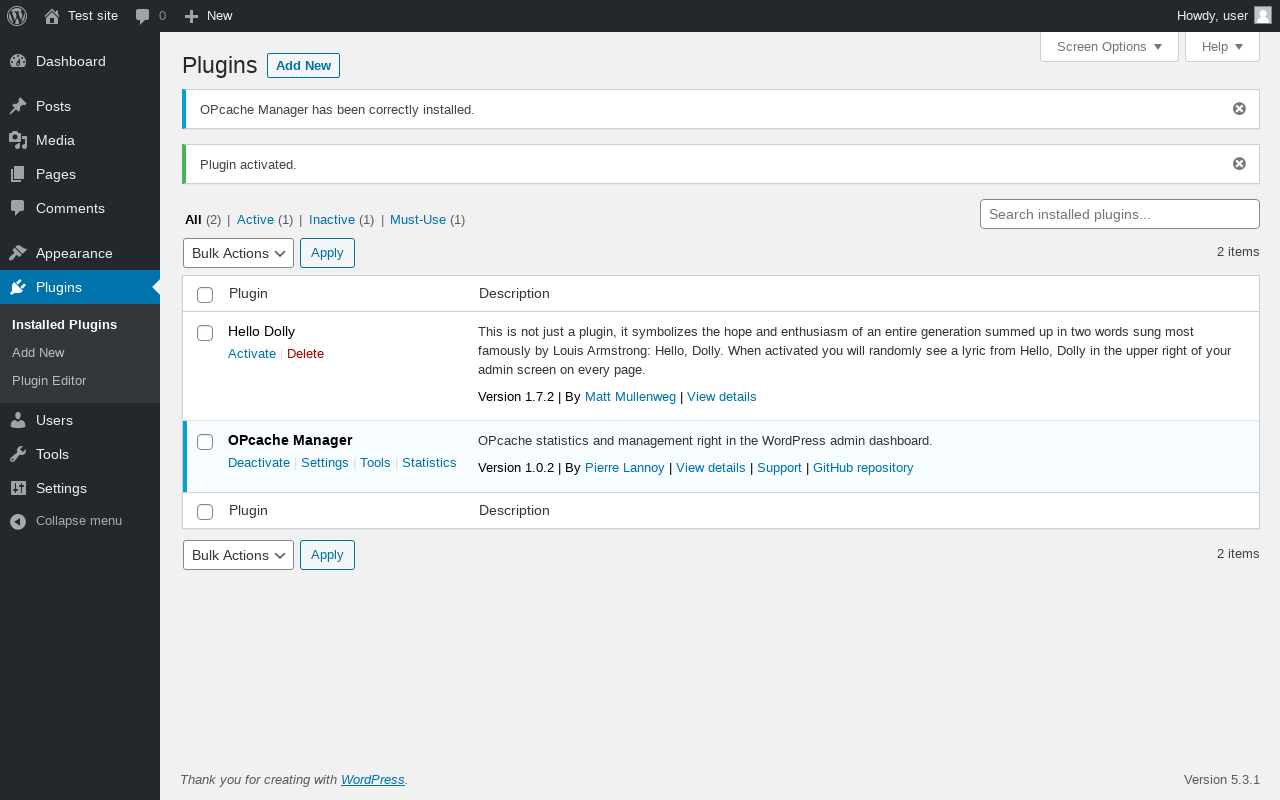
| URL | /wp-admin/plugins.php?plugin_status=all&paged=1&s |
|---|---|
| Requested URL | /wp-admin/plugins.php?action=activate&plugin=opcache-manager%2Fopcache-manager.php&plugin_status=all&paged=1&s&_wpnonce=c381a2dbbd |
| Aspect | after-activation |
| HTTP status | 200 |
| Load time | 0.459 s |
| Memory usage | 3.63 MiB |
| JS errors | None |
| Resource errors | None |
Tools → OPcache Tools
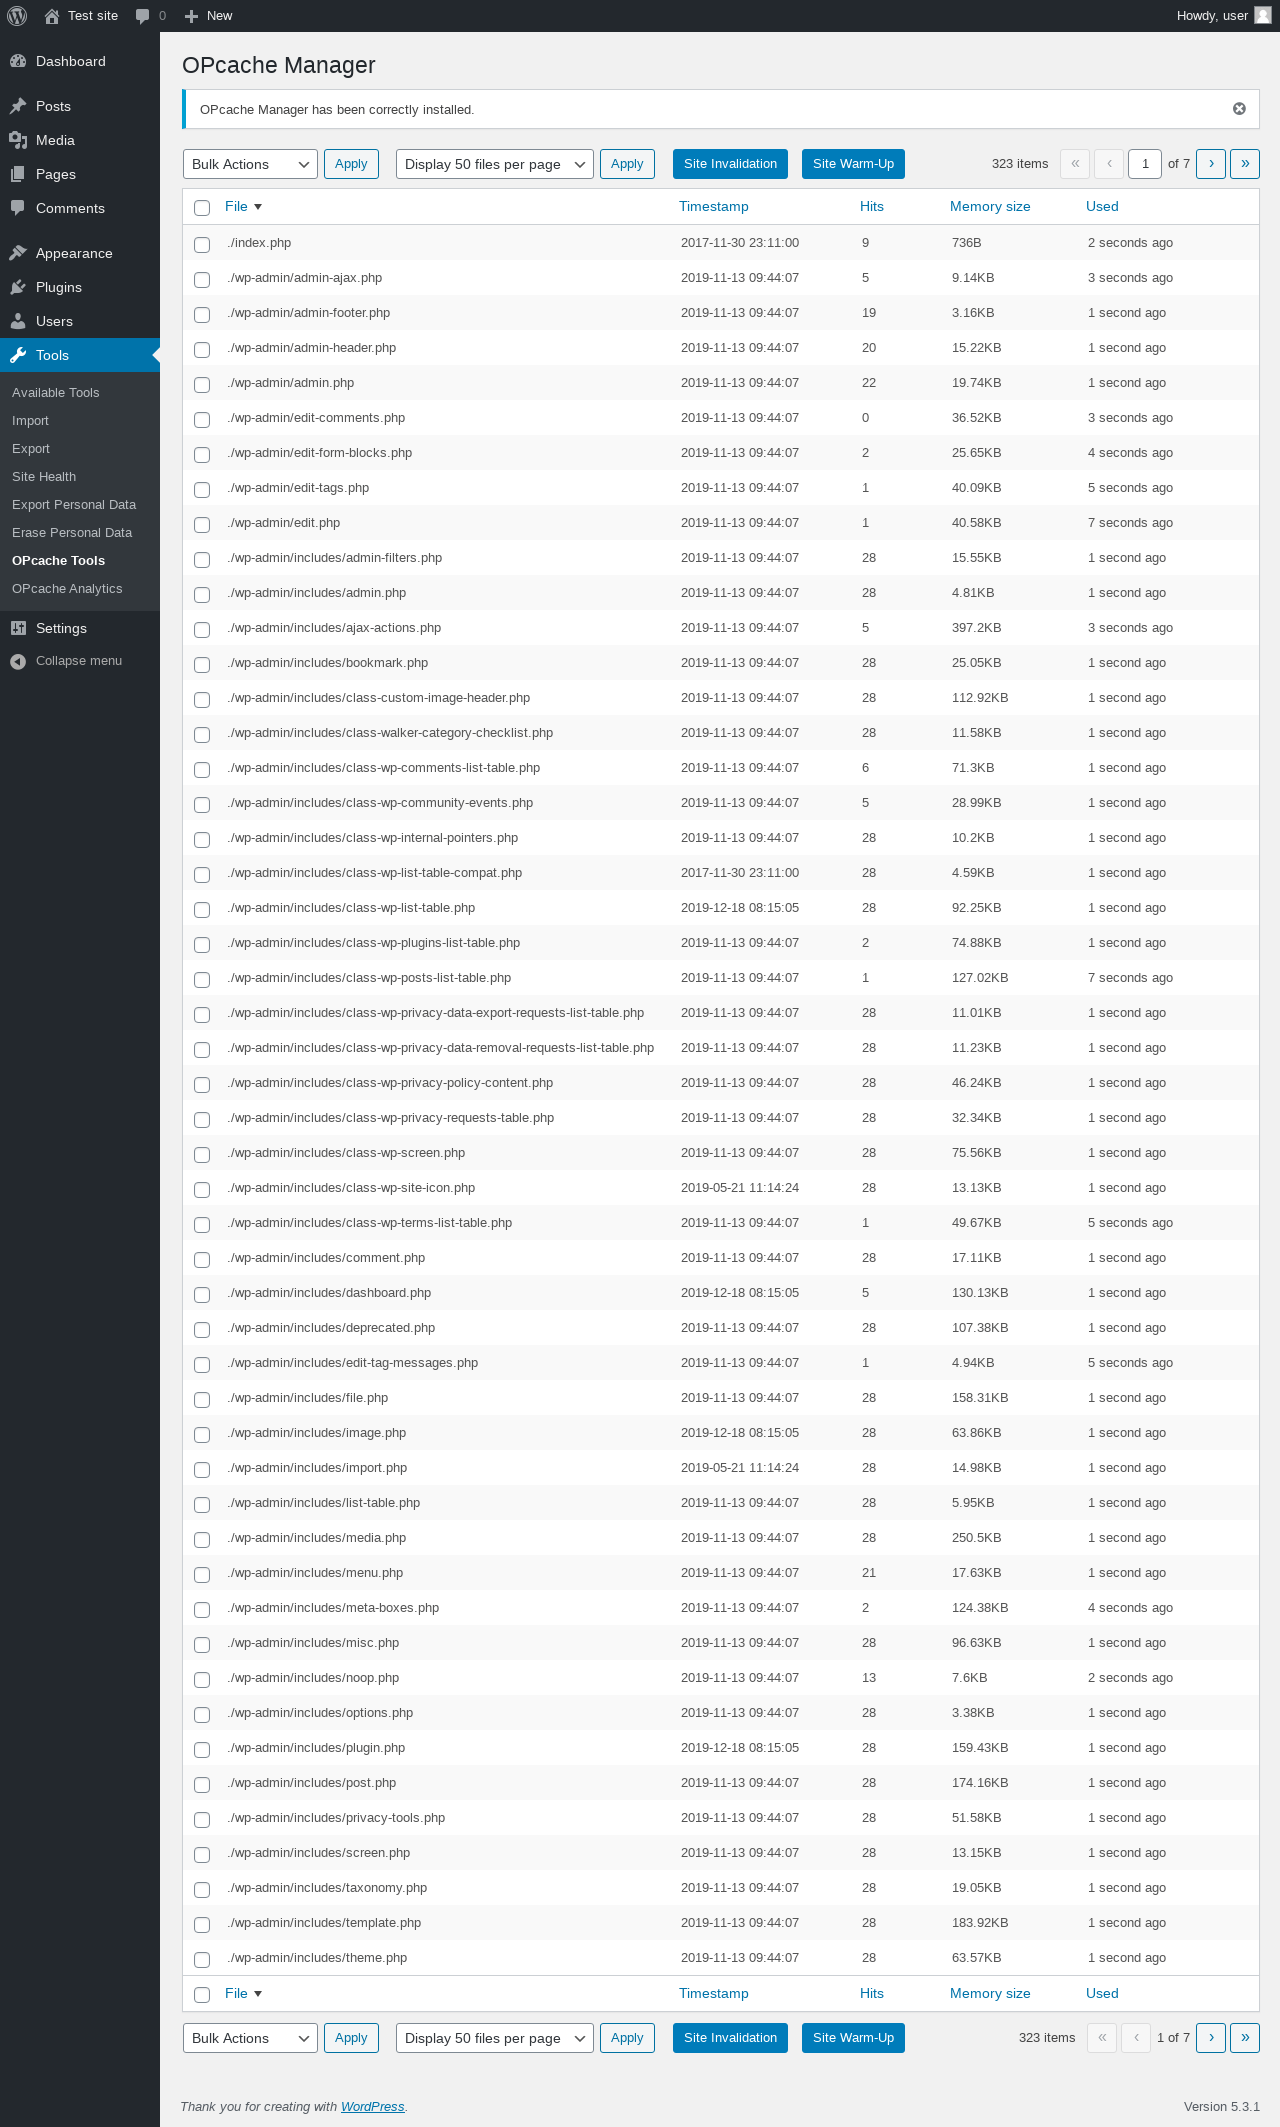
| URL | /wp-admin/tools.php?page=opcm-tools |
|---|---|
| Aspect | menu-item |
| HTTP status | 200 |
| Load time | 0.227 s |
| Memory usage | 3.99 MiB |
| JS errors | None |
| Resource errors | None |
Tools → OPcache Analytics
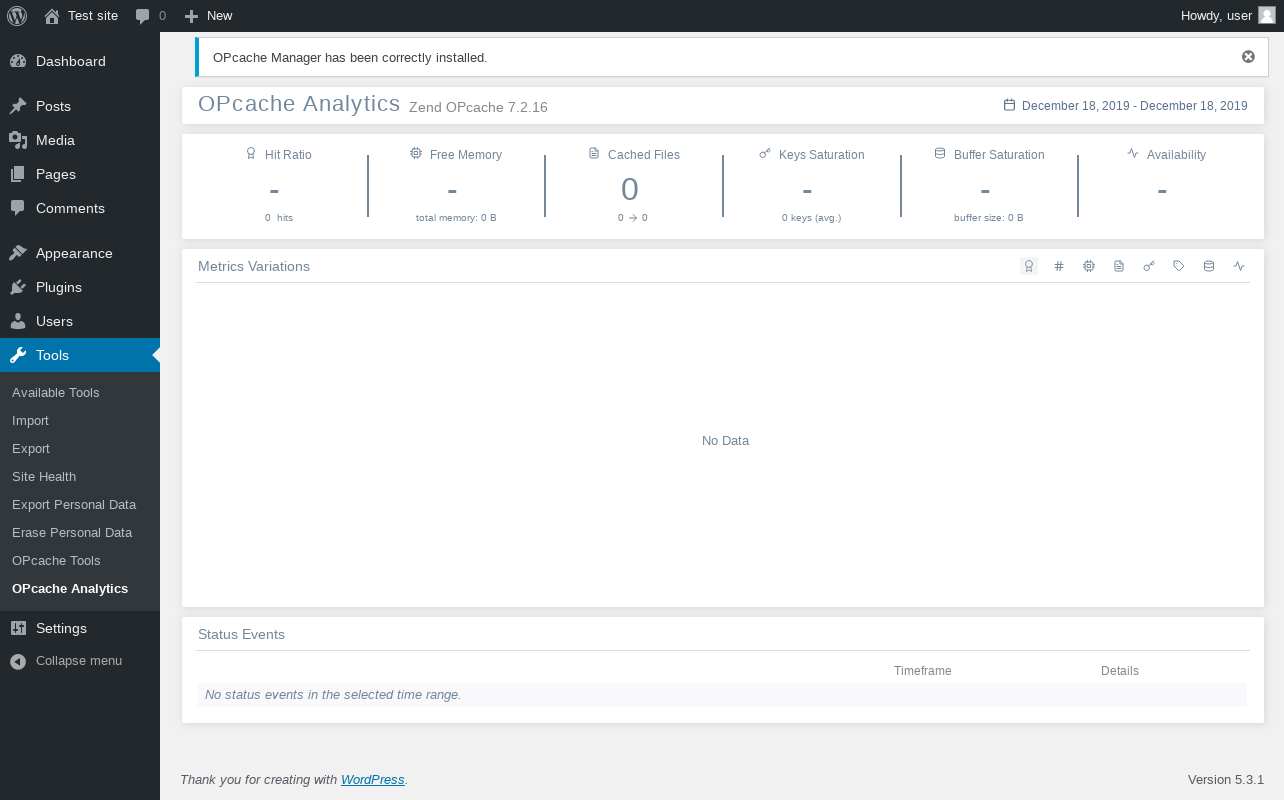
| URL | /wp-admin/tools.php?page=opcm-viewer |
|---|---|
| Aspect | menu-item |
| HTTP status | 200 |
| Load time | 0.624 s |
| Memory usage | 4.59 MiB |
| JS errors | None |
| Resource errors | None |
Settings → OPcache Manager
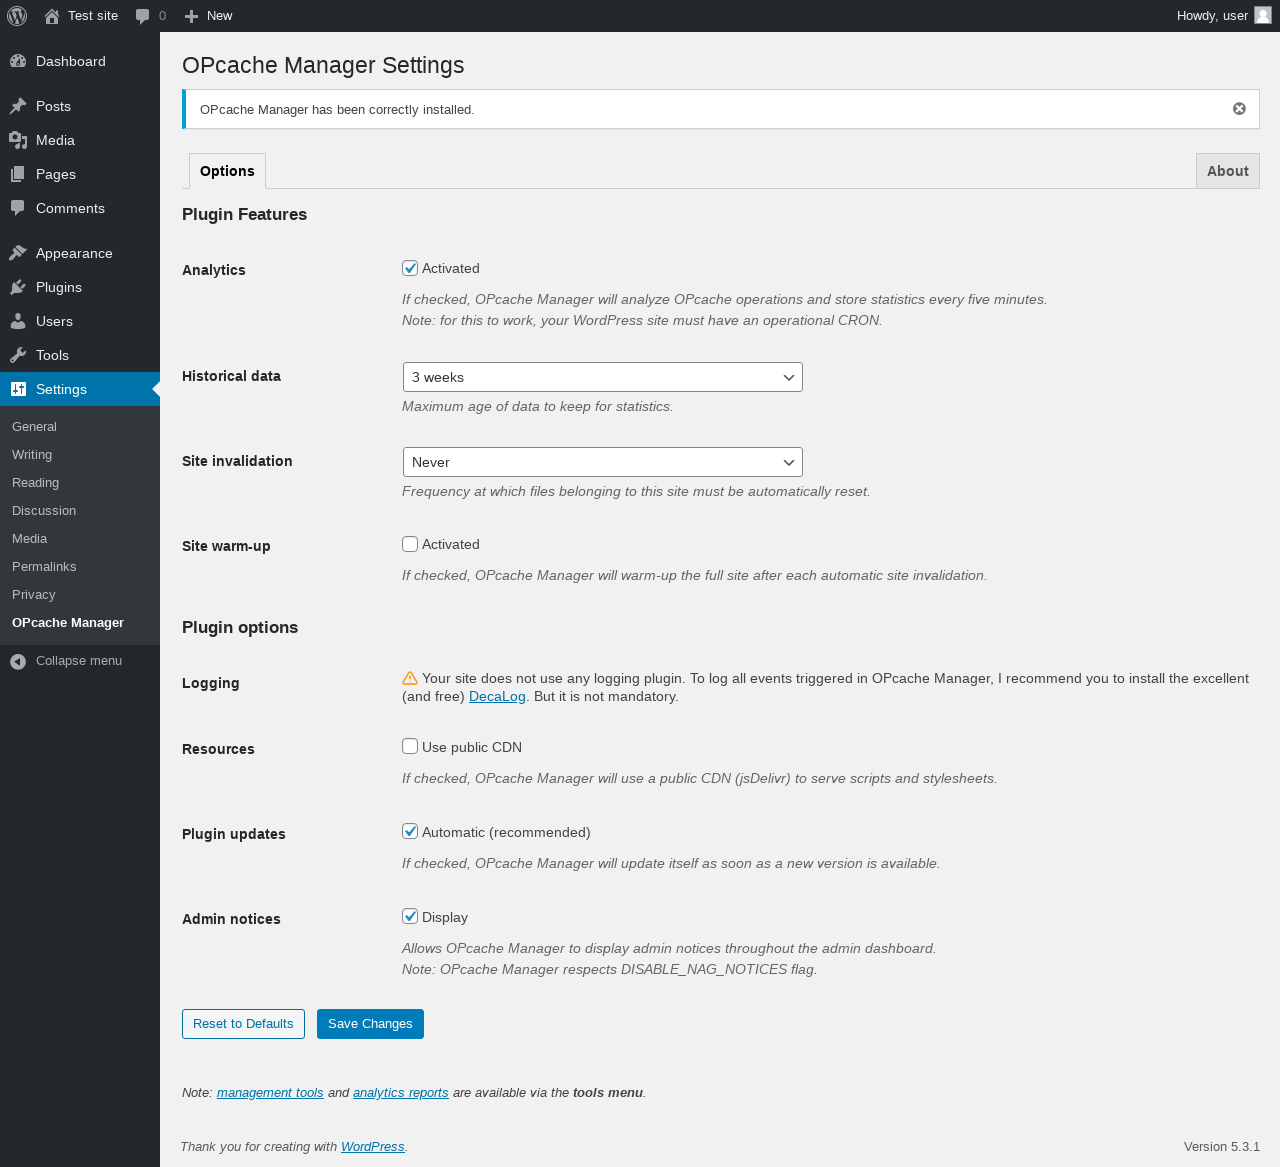
| URL | /wp-admin/options-general.php?page=opcm-settings |
|---|---|
| Aspect | menu-item |
| HTTP status | 200 |
| Load time | 0.175 s |
| Memory usage | 3.78 MiB |
| JS errors | None |
| Resource errors | None |
Settings → OPcache Manager → About
| URL | /wp-admin/options-general.php?page=opcm-settings&tab=about |
|---|---|
| Aspect | menu-item-tab |
| HTTP status | 200 |
| Load time | 0.207 s |
| Memory usage | 4.38 MiB |
| JS errors | None |
| Resource errors | None |
Test site – Just another WordPress site
| URL | / |
|---|---|
| Aspect | front-page |
| HTTP status | 200 |
| Load time | 0.230 s |
| Memory usage | 3.35 MiB |
| JS errors | None |
| Resource errors | None |
Benchmark
| URL | Load time | Memory usage | ||||
|---|---|---|---|---|---|---|
| Inactive | Active | Change | Inactive | Active | Change | |
| /wp-admin/index.php | 0.308 s | 0.260 s | -0.048 s | 3.61 MiB | 3.74 MiB | + 129.42 KiB |
| /wp-admin/edit.php | 0.222 s | 0.255 s | +0.033 s | 3.64 MiB | 3.77 MiB | + 129.42 KiB |
| /wp-admin/post-new.php | 1.306 s | 1.730 s | +0.424 s | 5.36 MiB | 5.49 MiB | + 128.15 KiB |
| /wp-admin/upload.php | 0.509 s | 0.500 s | -0.009 s | 3.48 MiB | 3.6 MiB | + 128.74 KiB |
| /wp-admin/options-writing.php | 0.161 s | 0.160 s | -0.001 s | 3.56 MiB | 3.59 MiB | + 35.63 KiB |
| /wp-admin/media-new.php | 0.208 s | 0.214 s | +0.006 s | 3.46 MiB | 3.59 MiB | + 129.27 KiB |
| /wp-admin/edit-tags.php?taxonomy=category | 0.197 s | 0.209 s | +0.012 s | 3.56 MiB | 3.63 MiB | + 65.37 KiB |
| /wp-admin/post-new.php?post_type=page | 1.373 s | 1.475 s | +0.102 s | 5.35 MiB | 5.47 MiB | + 121.33 KiB |
| /wp-admin/options-discussion.php | 0.249 s | 0.272 s | +0.023 s | 3.46 MiB | 3.59 MiB | + 129.55 KiB |
| /wp-admin/edit-comments.php | 0.297 s | 0.221 s | -0.076 s | 3.57 MiB | 3.69 MiB | + 128.27 KiB |
| / | 0.285 s | 0.216 s | -0.069 s | 3.32 MiB | 3.35 MiB | + 36.57 KiB |
| Average | 0.465 s | 0.501 s | +0.036 s | 3.85 MiB | 3.95 MiB | + 105.61 KiB |
Additions
Things that the plugin adds to the site. This section is not intended to be comprehensive. The test tool only looks for a few specific types of added content.
Database Tables 1
- wp_opcm_statistics
Options wp_options 2
- opcm_nags
- opcm_version
PHP Error Log
The log file is empty.