Material Design 0.5.1
Does Material Design work with WordPress 6.0 and PHP 7.4.8? A smoke test was performed on .
Summary
| No PHP errors, warnings or notices | |
| No JavaScript exceptions | |
| All test pages loaded successfully | |
| No resource errors | |
| Looks good! No problems were detected. |
Memory usage: 1.78 MiB
The average PHP memory usage increased by this amount after activating by the plugin.
Page speed impact:
0.038 seconds
The average page load time increased by this amount after activating the plugin.
| WordPress version | 6.0 |
|---|---|
| PHP version | 7.4.8 |
| MySQL version | 8.0.21 |
| PHP memory limit | 256M |
| Last updated | |
|---|---|
| Active installs | 1,000+ |
| WordPress.org page | https://wordpress.org/plugins/material-design/ |
| Badges |
|
Pages 5
Onboarding Wizard ‹ Test site — WordPress

| URL | /wp-admin/admin.php?page=material-onboarding-wizard |
|---|---|
| Requested URL | /wp-admin/plugins.php?action=activate&plugin=material-design%2Fmaterial-design.php&plugin_status=all&paged=1&s&_wpnonce=a288e8dd3e |
| Aspect | after-activation |
| HTTP status | 200 |
| Load time | 0.429 s |
| Memory usage | 5.46 MiB |
| JS errors | None |
| Resource errors | None |
Material
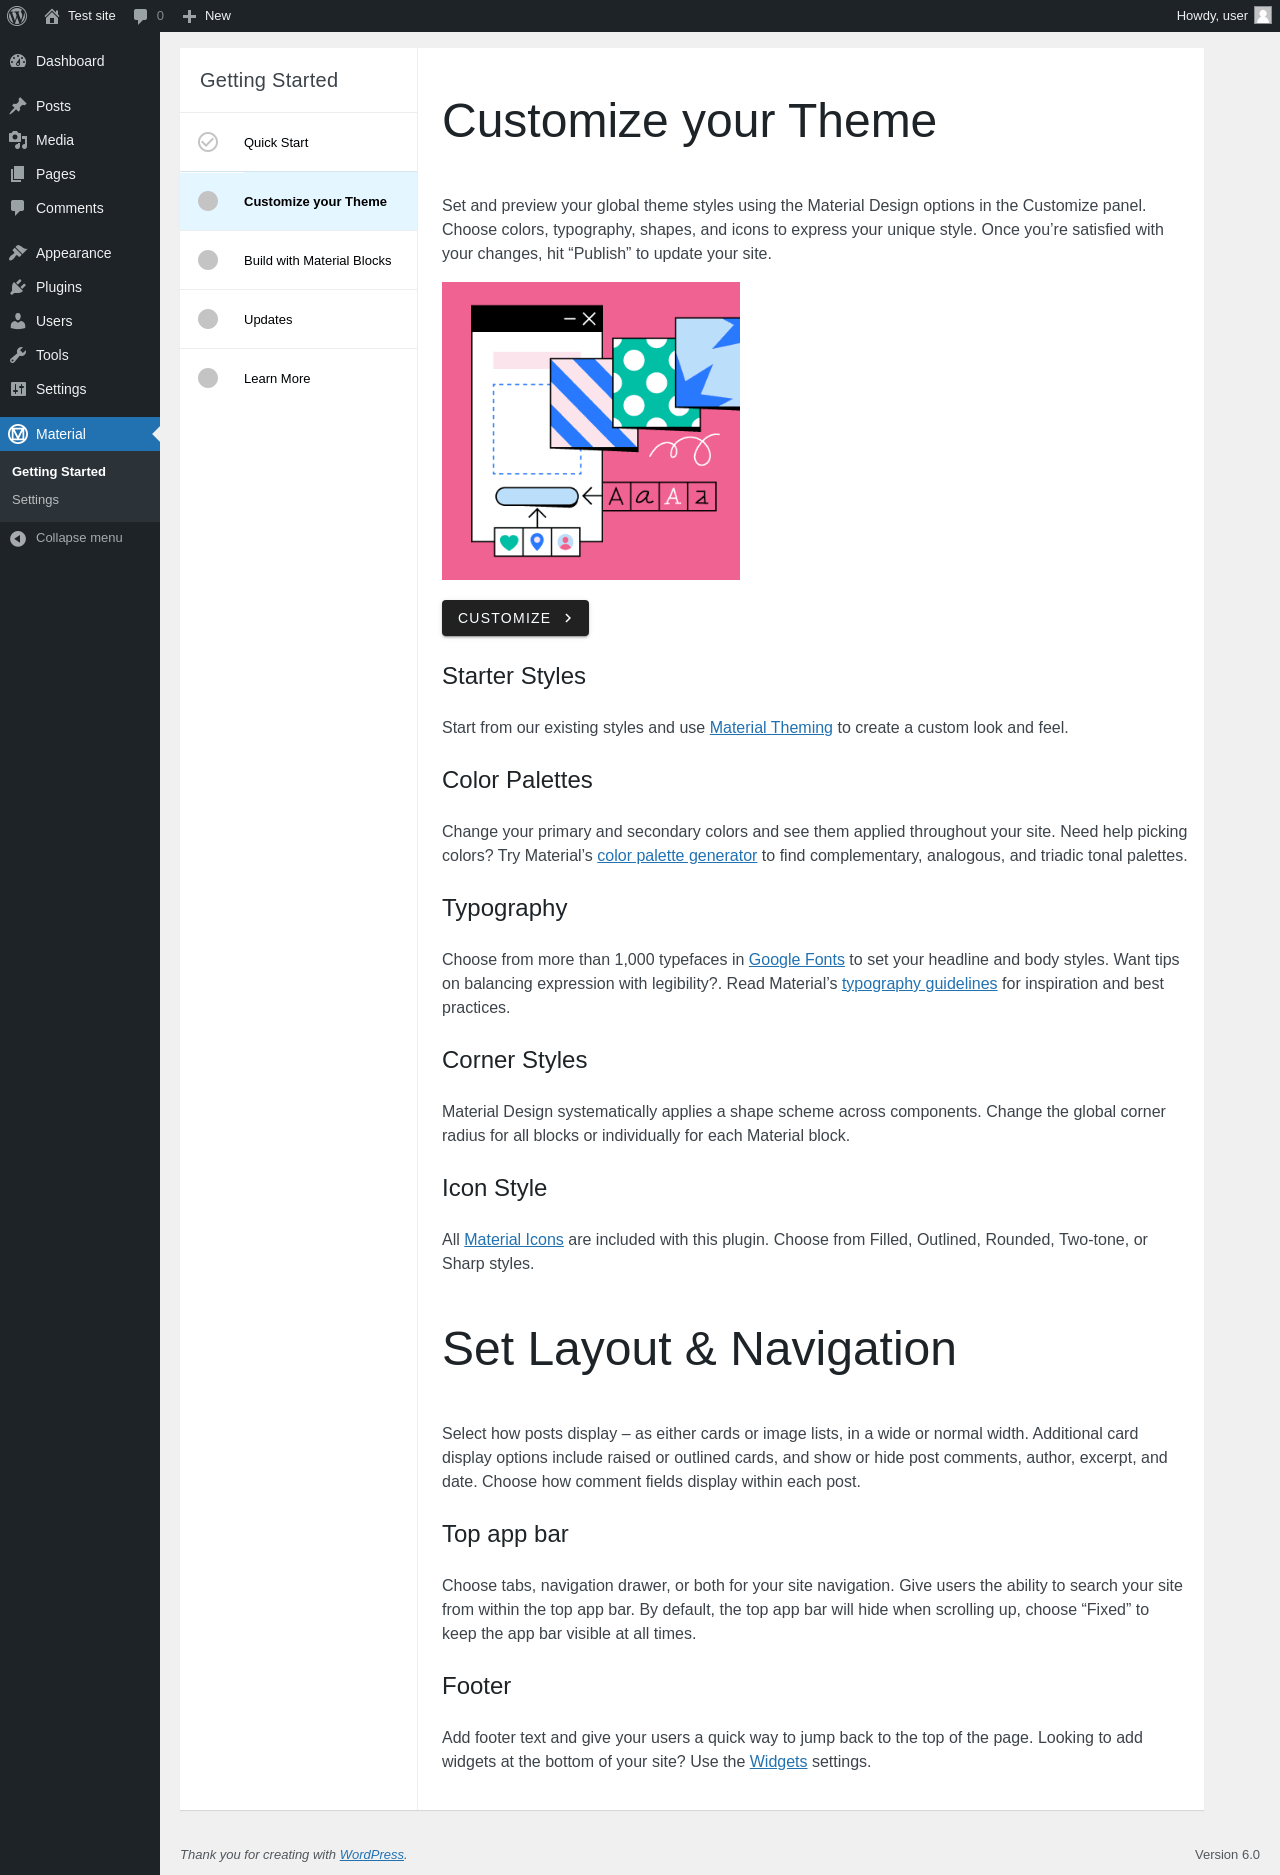
| URL | /wp-admin/admin.php?page=material-settings |
|---|---|
| Aspect | menu-item |
| HTTP status | 200 |
| Load time | 0.458 s |
| Memory usage | 5.46 MiB |
| JS errors | None |
| Resource errors | None |
Material → Settings
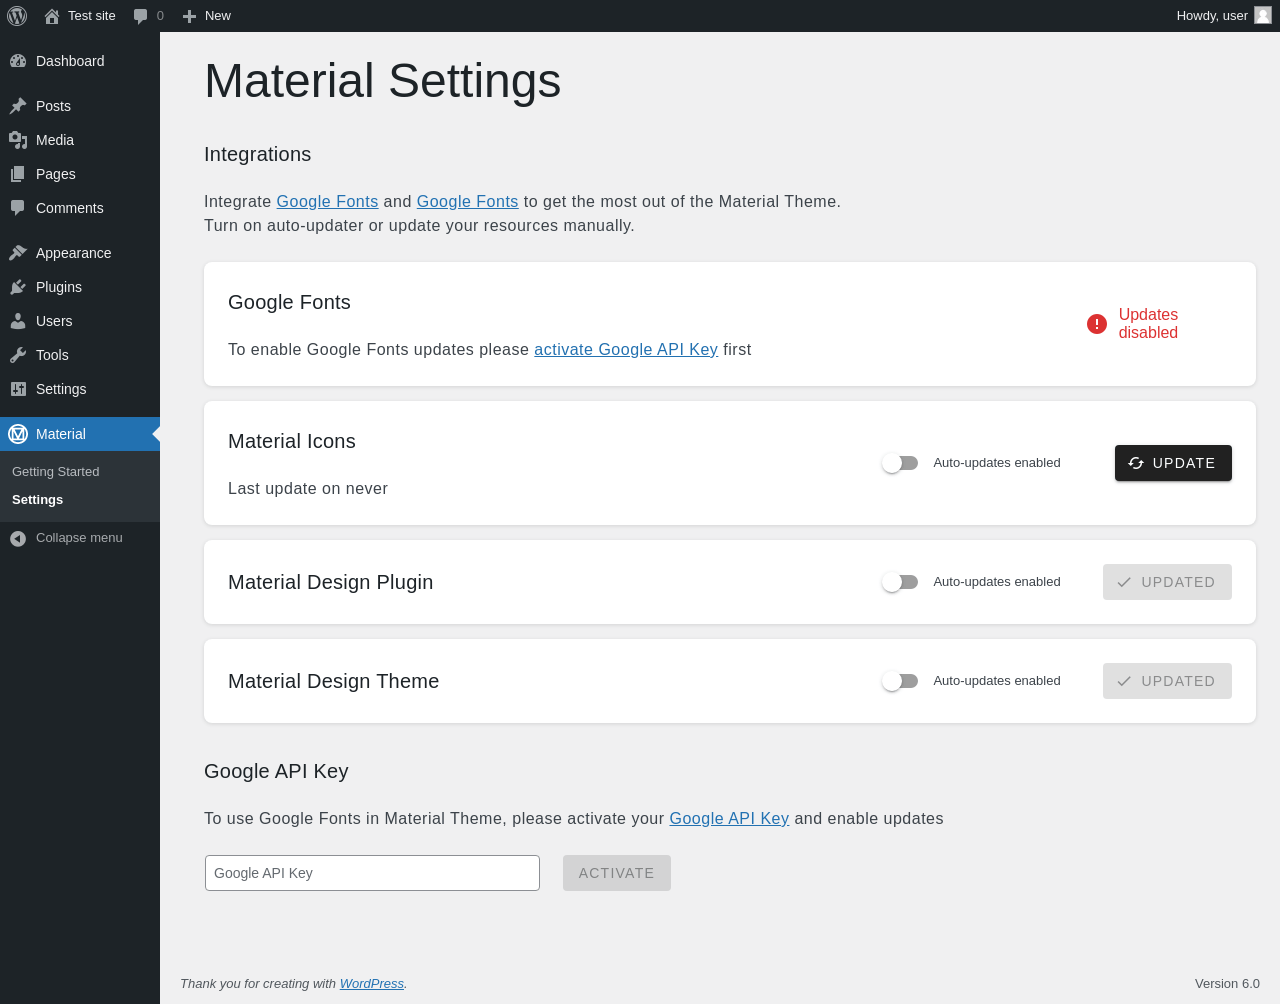
| URL | /wp-admin/admin.php?page=material-settings-page |
|---|---|
| Aspect | menu-item |
| HTTP status | 200 |
| Load time | 0.433 s |
| Memory usage | 5.47 MiB |
| JS errors | None |
| Resource errors | None |
Material → Onboarding Wizard
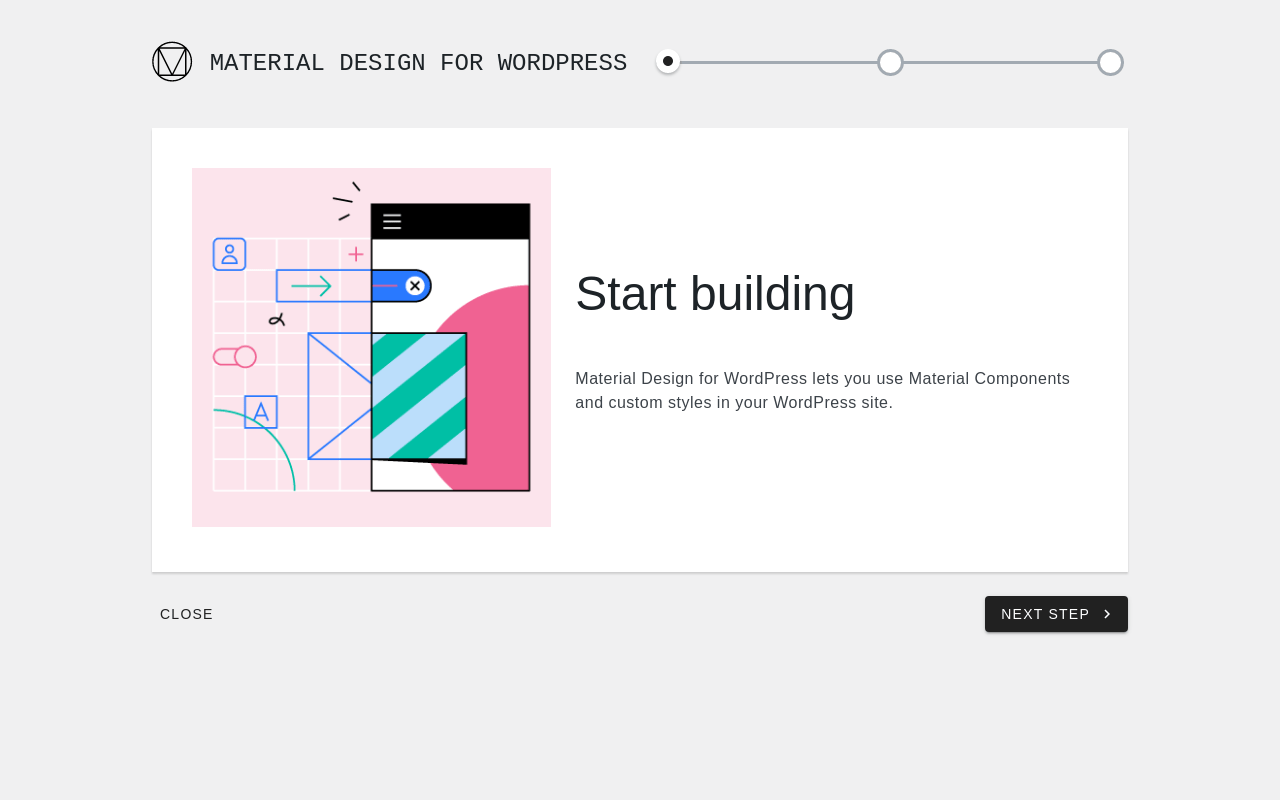
| URL | /wp-admin/admin.php?page=material-onboarding-wizard |
|---|---|
| Aspect | menu-item |
| HTTP status | 200 |
| Load time | 0.268 s |
| Memory usage | 5.46 MiB |
| JS errors | None |
| Resource errors | None |
Test site – Just another WordPress site
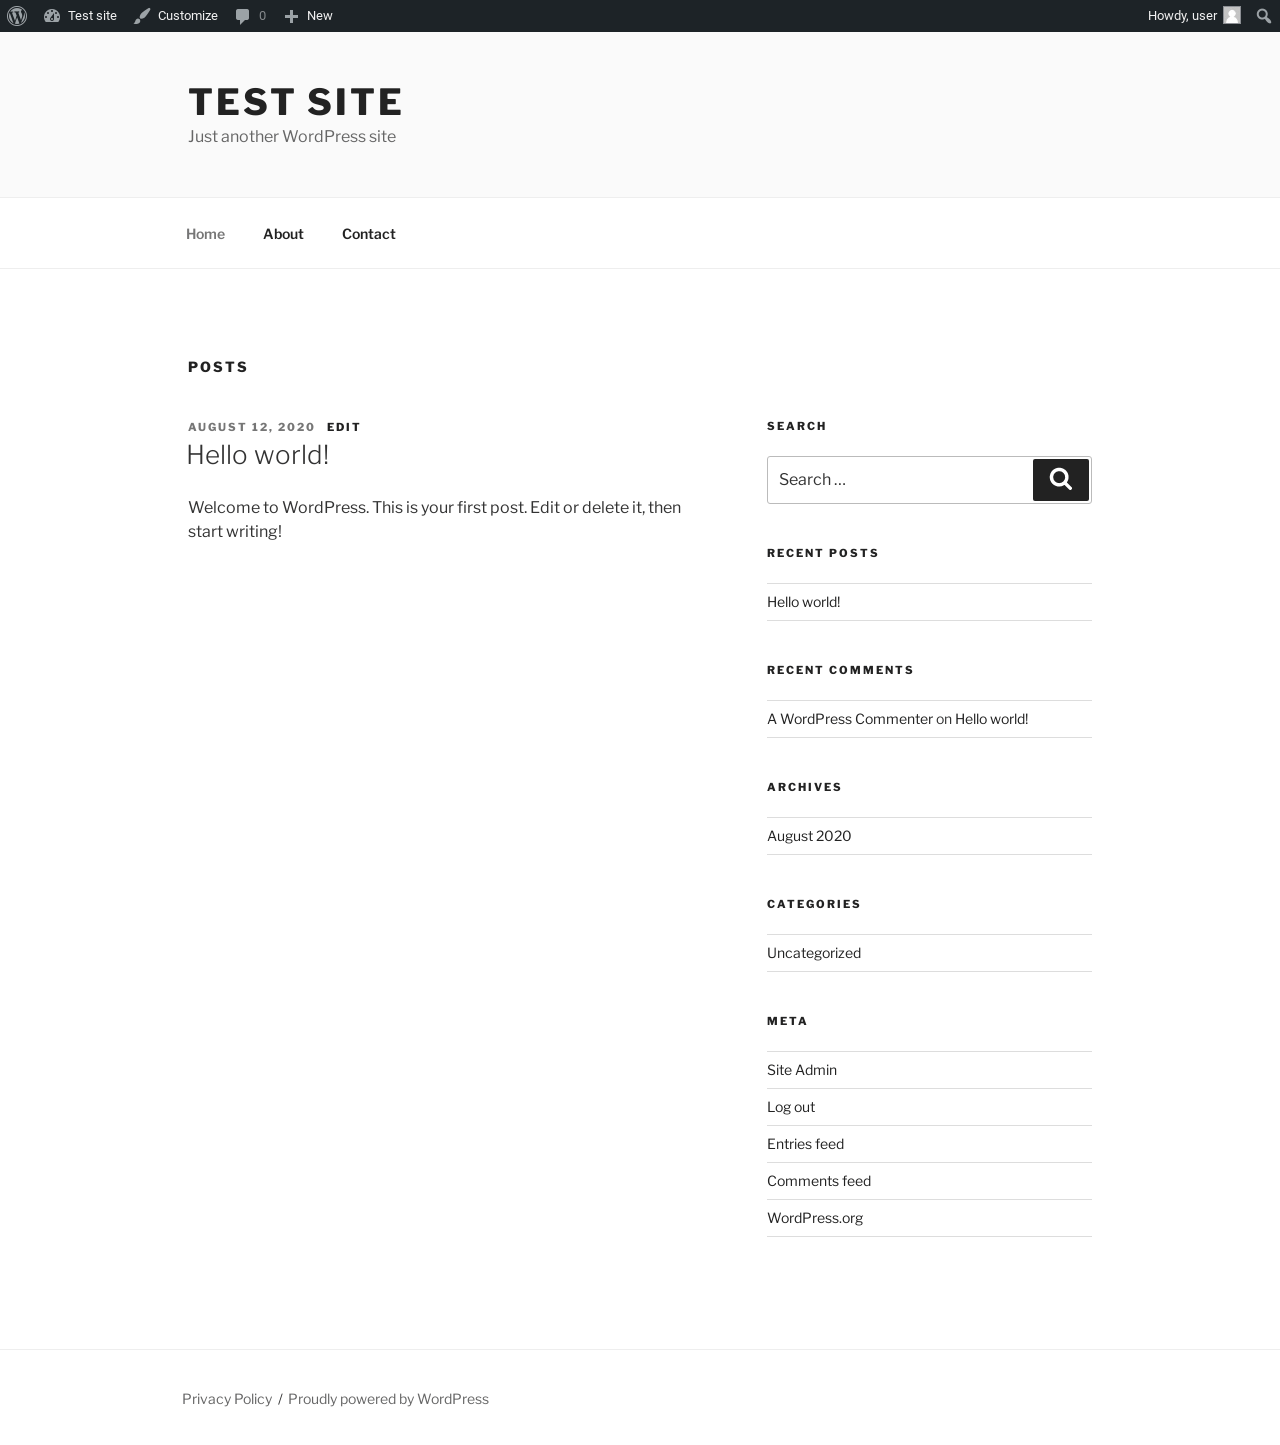
| URL | / |
|---|---|
| Aspect | front-page |
| HTTP status | 200 |
| Load time | 0.321 s |
| Memory usage | 5.25 MiB |
| JS errors | None |
| Resource errors | None |
Benchmark
| URL | Load time | Memory usage | ||||
|---|---|---|---|---|---|---|
| Inactive | Active | Change | Inactive | Active | Change | |
| /wp-admin/index.php | 0.274 s | 0.262 s | -0.012 s | 3.72 MiB | 5.47 MiB | + 1.75 MiB |
| /wp-admin/edit.php | 0.173 s | 0.196 s | +0.023 s | 3.75 MiB | 5.53 MiB | + 1.78 MiB |
| /wp-admin/post-new.php | 0.792 s | 1.208 s | +0.416 s | 5.53 MiB | 7.26 MiB | + 1.72 MiB |
| /wp-admin/upload.php | 0.347 s | 0.409 s | +0.062 s | 3.68 MiB | 5.48 MiB | + 1.8 MiB |
| /wp-admin/options-writing.php | 0.248 s | 0.247 s | -0.001 s | 3.61 MiB | 5.45 MiB | + 1.84 MiB |
| /wp-admin/media-new.php | 0.267 s | 0.177 s | -0.090 s | 3.66 MiB | 5.45 MiB | + 1.79 MiB |
| /wp-admin/edit-tags.php?taxonomy=category | 0.216 s | 0.184 s | -0.032 s | 3.68 MiB | 5.47 MiB | + 1.79 MiB |
| /wp-admin/post-new.php?post_type=page | 1.022 s | 0.926 s | -0.096 s | 5.53 MiB | 7.25 MiB | + 1.72 MiB |
| /wp-admin/options-discussion.php | 0.173 s | 0.245 s | +0.072 s | 3.59 MiB | 5.45 MiB | + 1.86 MiB |
| /wp-admin/edit-comments.php | 0.191 s | 0.204 s | +0.013 s | 3.69 MiB | 5.47 MiB | + 1.78 MiB |
| / | 0.230 s | 0.292 s | +0.062 s | 3.55 MiB | 5.25 MiB | + 1.7 MiB |
| Average | 0.358 s | 0.395 s | +0.038 s | 4 MiB | 5.78 MiB | + 1.78 MiB |
Code Statistics
Note: Third-party libraries and minified JS/CSS files are excluded from these statistics where possible, so the numbers you see here may be lower than those reported by other tools.
| Language | % | Lines of code | Comment lines | Files | |
|---|---|---|---|---|---|
| JSON | 64.7% | 11,880 | 0 | 14 | |
| PHP | 29.6% | 5,433 | 3,839 | 74 | |
| XML | 4.9% | 902 | 174 | 2 | |
| JavaScript | 0.5% | 90 | 1 | 9 | |
| CSS | 0.2% | 28 | 0 | 15 | |
| SVG | 0.1% | 22 | 0 | 12 | |
| Total | 18,355 | 4,014 | 126 | ||
PHP Code Analysis | More results »
| Lines of code | 5,037 |
|---|---|
| Total complexity | 811 |
| Median class complexity | 10.0 |
| Median method complexity | 2.0 |
| Most complex class | MaterialDesign\Plugin\Customizer\Controls |
| Most complex function | MaterialDesign\Plugin\Customizer\Controls::get_frontend_css() |
| Classes | 38 |
|---|---|
| Methods | 263 |
| Functions | 9 |
Additions
Things that the plugin adds to the site. This section is not intended to be comprehensive. The test tool only looks for a few specific types of added content.
Options wp_options 1
- material_plugin_activated
PHP Error Log
The log file is empty.