Material Design 0.4.0
Does Material Design work with WordPress 5.8.2 and PHP 7.4.8? A smoke test was performed on .
Summary
| No PHP errors, warnings or notices | |
| No JavaScript exceptions | |
| All test pages loaded successfully | |
| No resource errors | |
| Looks good! No problems were detected. |
Memory usage: 1.46 MiB
The average PHP memory usage increased by this amount after activating by the plugin.
Page speed impact:
0.108 seconds
The average page load time increased by this amount after activating the plugin.
| WordPress version | 5.8.2 |
|---|---|
| PHP version | 7.4.8 |
| MySQL version | 8.0.21 |
| PHP memory limit | 256M |
| Last updated | |
|---|---|
| Active installs | 1,000+ |
| WordPress.org page | https://wordpress.org/plugins/material-design/ |
| Badges |
|
Pages 5
Onboarding Wizard ‹ Test site — WordPress
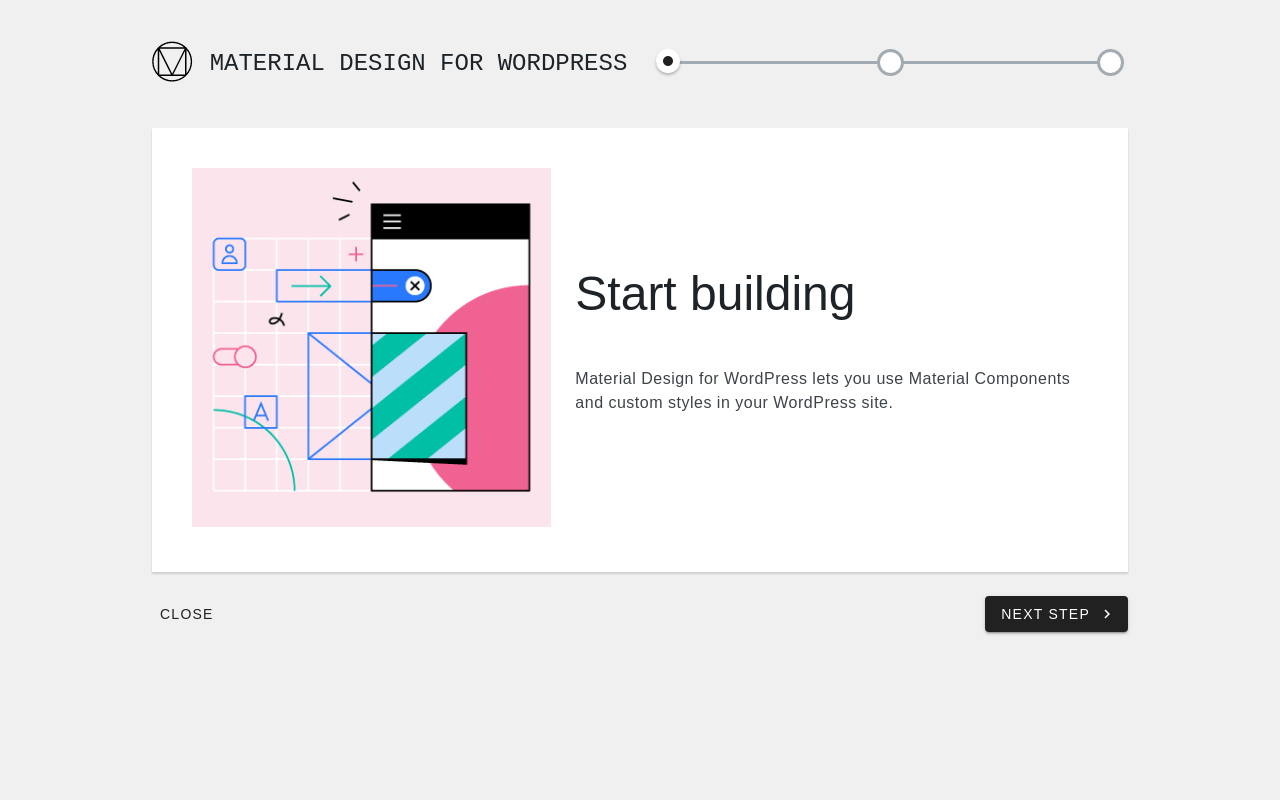
| URL | /wp-admin/admin.php?page=material-onboarding-wizard |
|---|---|
| Requested URL | /wp-admin/plugins.php?action=activate&plugin=material-design%2Fmaterial-design.php&plugin_status=all&paged=1&s&_wpnonce=b1b2bc8a8e |
| Aspect | after-activation |
| HTTP status | 200 |
| Load time | 0.592 s |
| Memory usage | 4.48 MiB |
| JS errors | None |
| Resource errors | None |
Material
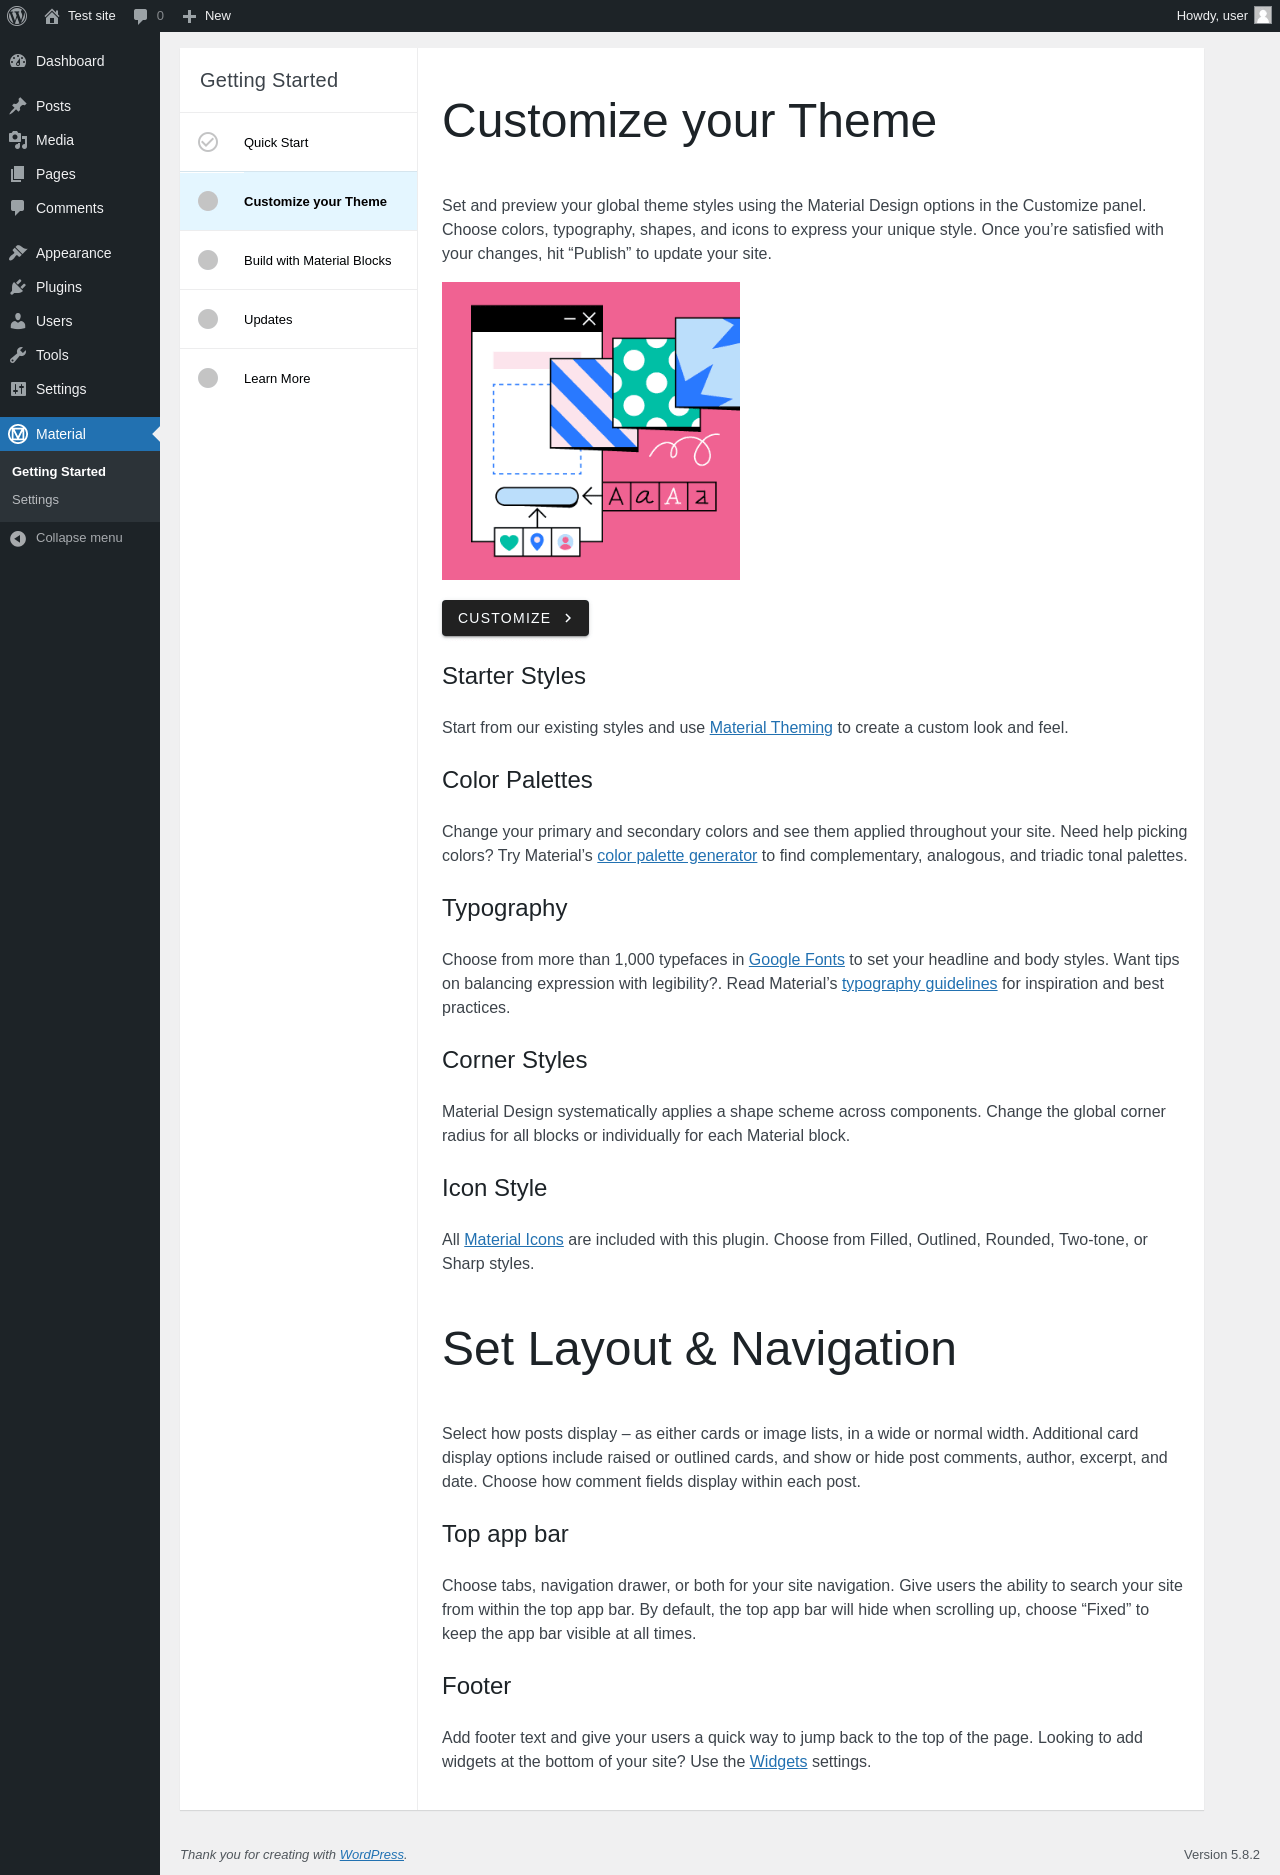
| URL | /wp-admin/admin.php?page=material-settings |
|---|---|
| Aspect | menu-item |
| HTTP status | 200 |
| Load time | 0.324 s |
| Memory usage | 4.49 MiB |
| JS errors | None |
| Resource errors | None |
Material → Settings
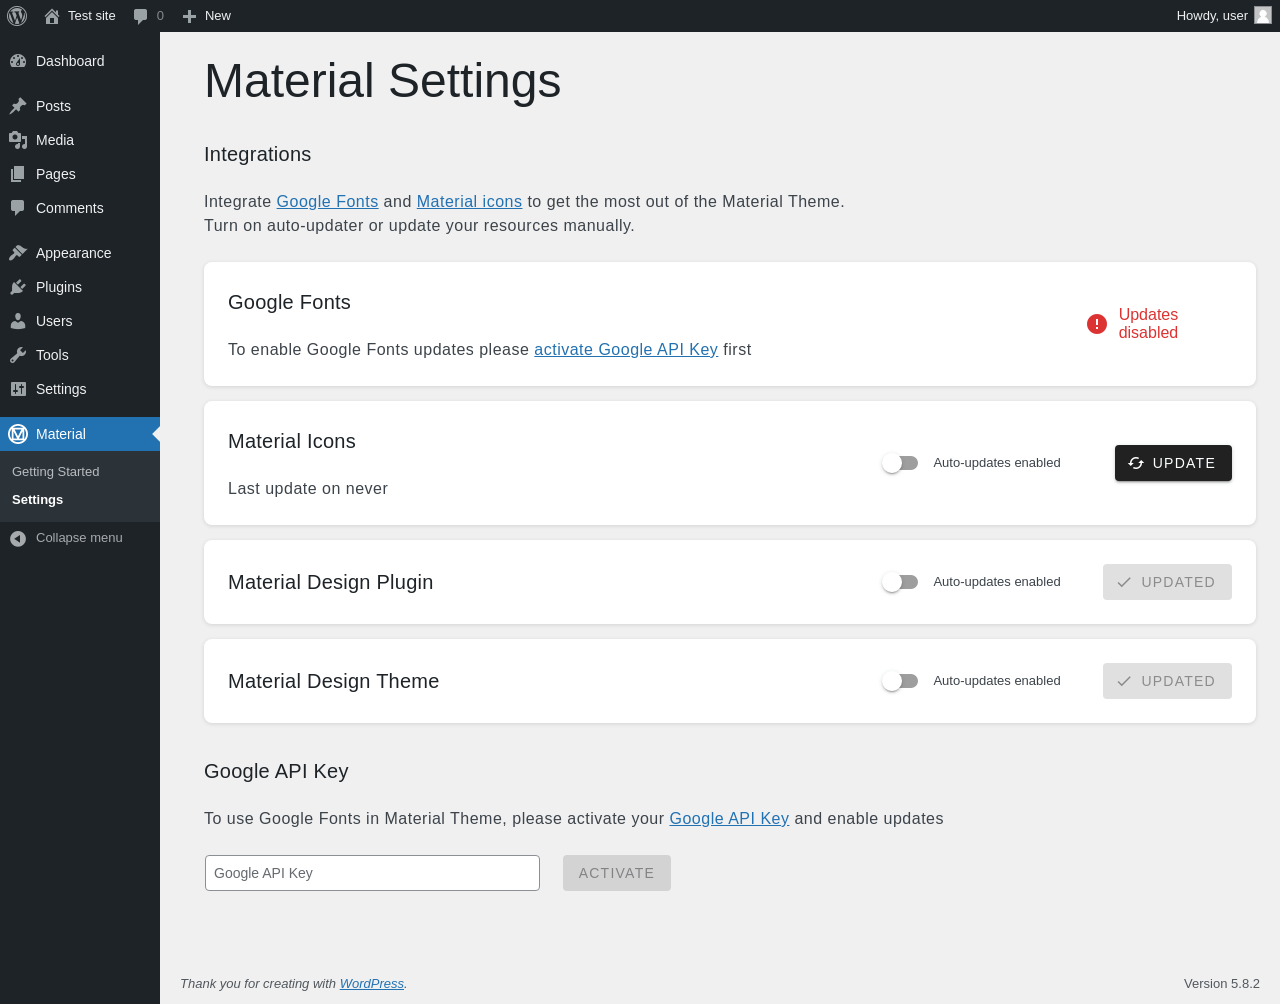
| URL | /wp-admin/admin.php?page=material-settings-page |
|---|---|
| Aspect | menu-item |
| HTTP status | 200 |
| Load time | 0.440 s |
| Memory usage | 4.49 MiB |
| JS errors | None |
| Resource errors | None |
Material → Onboarding Wizard

| URL | /wp-admin/admin.php?page=material-onboarding-wizard |
|---|---|
| Aspect | menu-item |
| HTTP status | 200 |
| Load time | 0.334 s |
| Memory usage | 4.48 MiB |
| JS errors | None |
| Resource errors | None |
Test site – Just another WordPress site
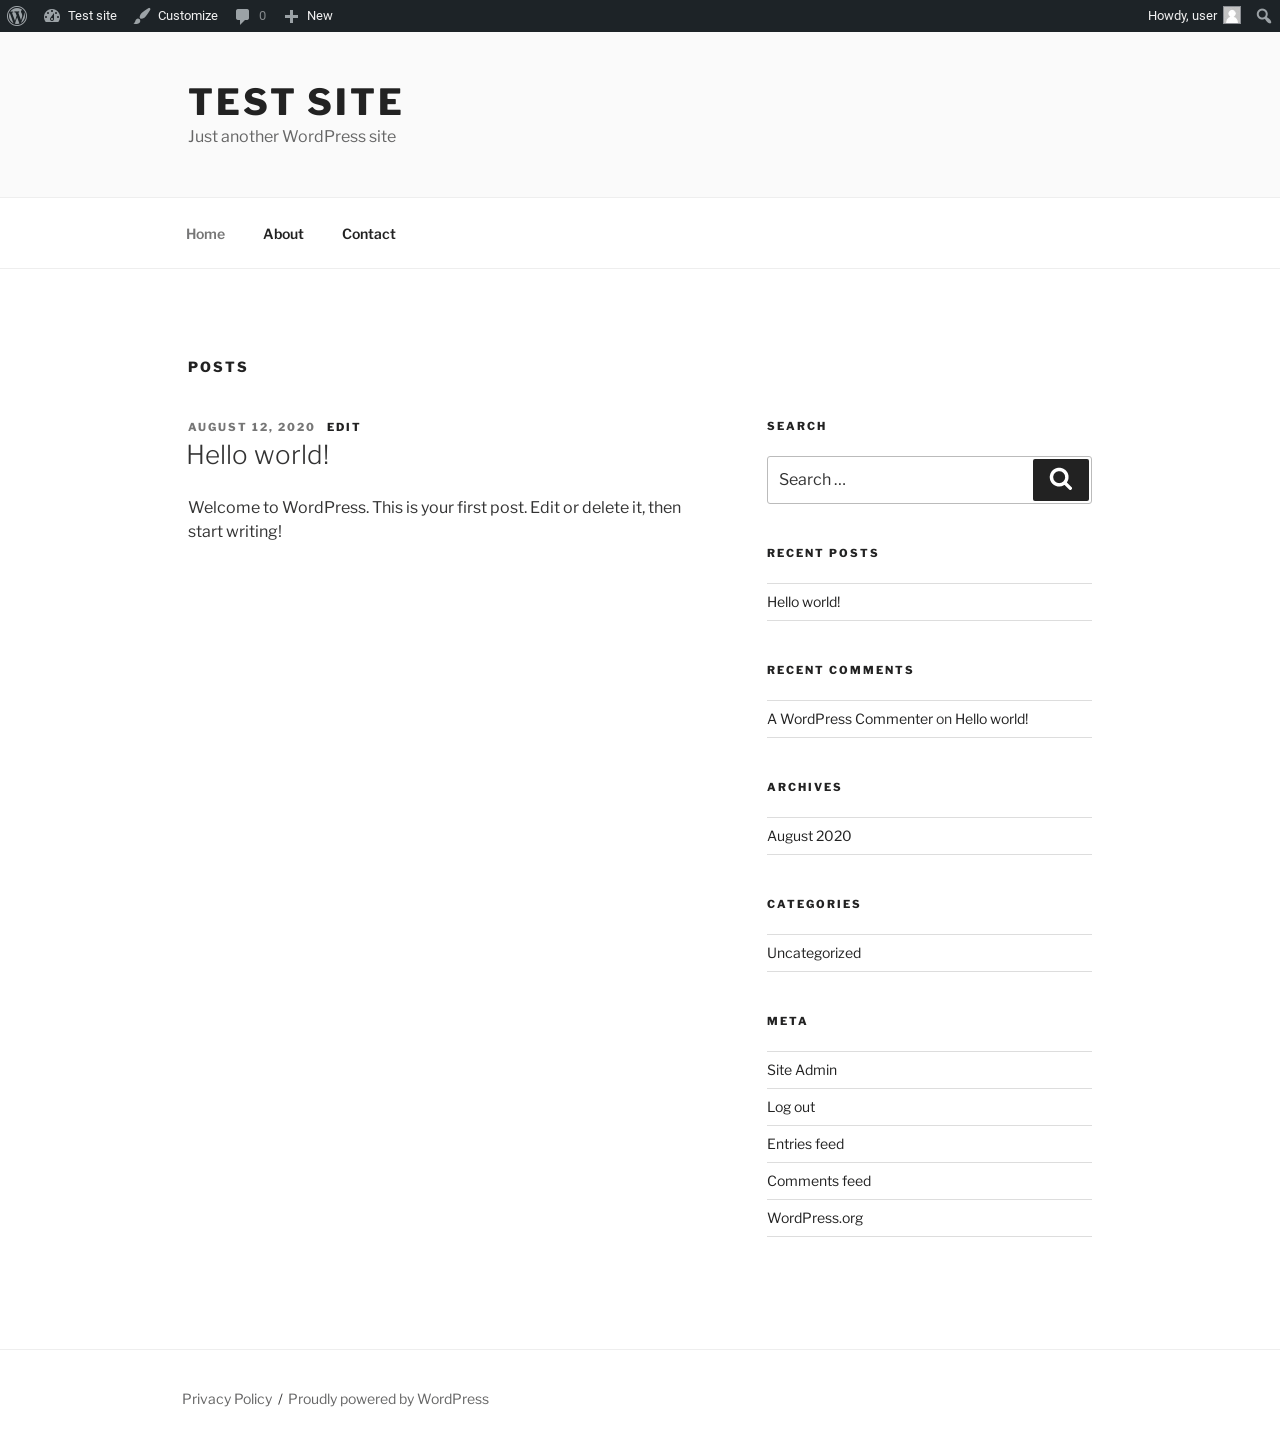
| URL | / |
|---|---|
| Aspect | front-page |
| HTTP status | 200 |
| Load time | 0.424 s |
| Memory usage | 4.34 MiB |
| JS errors | None |
| Resource errors | None |
Benchmark
| URL | Load time | Memory usage | ||||
|---|---|---|---|---|---|---|
| Inactive | Active | Change | Inactive | Active | Change | |
| /wp-admin/index.php | 0.314 s | 0.304 s | -0.010 s | 3.08 MiB | 4.52 MiB | + 1.44 MiB |
| /wp-admin/edit.php | 0.166 s | 0.227 s | +0.061 s | 3.11 MiB | 4.61 MiB | + 1.5 MiB |
| /wp-admin/post-new.php | 0.896 s | 1.668 s | +0.772 s | 5.27 MiB | 6.75 MiB | + 1.48 MiB |
| /wp-admin/upload.php | 0.541 s | 0.494 s | -0.047 s | 3.03 MiB | 4.5 MiB | + 1.47 MiB |
| /wp-admin/options-writing.php | 0.240 s | 0.209 s | -0.031 s | 3.02 MiB | 4.47 MiB | + 1.45 MiB |
| /wp-admin/media-new.php | 0.255 s | 0.187 s | -0.068 s | 3.01 MiB | 4.47 MiB | + 1.47 MiB |
| /wp-admin/edit-tags.php?taxonomy=category | 0.174 s | 0.206 s | +0.032 s | 3.04 MiB | 4.49 MiB | + 1.45 MiB |
| /wp-admin/post-new.php?post_type=page | 0.856 s | 1.199 s | +0.343 s | 5.26 MiB | 6.74 MiB | + 1.48 MiB |
| /wp-admin/options-discussion.php | 0.215 s | 0.280 s | +0.065 s | 3 MiB | 4.47 MiB | + 1.47 MiB |
| /wp-admin/edit-comments.php | 0.190 s | 0.230 s | +0.040 s | 3.04 MiB | 4.5 MiB | + 1.45 MiB |
| / | 0.286 s | 0.319 s | +0.033 s | 2.96 MiB | 4.34 MiB | + 1.38 MiB |
| Average | 0.376 s | 0.484 s | +0.108 s | 3.44 MiB | 4.9 MiB | + 1.46 MiB |
Code Statistics
Note: Third-party libraries and minified JS/CSS files are excluded from these statistics where possible, so the numbers you see here may be lower than those reported by other tools.
| Language | % | Lines of code | Comment lines | Files | |
|---|---|---|---|---|---|
| JSON | 54.6% | 9,527 | 0 | 14 | |
| PHP | 30.1% | 5,249 | 3,708 | 72 | |
| JavaScript | 9.8% | 1,715 | 624 | 10 | |
| XML | 5.2% | 902 | 174 | 2 | |
| SVG | 0.1% | 22 | 0 | 12 | |
| CSS | 0.1% | 20 | 0 | 16 | |
| Total | 17,435 | 4,506 | 126 | ||
PHP Code Analysis | More results »
| Lines of code | 4,860 |
|---|---|
| Total complexity | 790 |
| Median class complexity | 10.0 |
| Median method complexity | 2.0 |
| Most complex class | MaterialDesign\Plugin\Customizer\Controls |
| Most complex function | MaterialDesign\Plugin\Customizer\Controls::get_frontend_css() |
| Classes | 36 |
|---|---|
| Methods | 251 |
| Functions | 11 |
Additions
Things that the plugin adds to the site. This section is not intended to be comprehensive. The test tool only looks for a few specific types of added content.
Options wp_options 1
- material_plugin_activated
PHP Error Log
The log file is empty.