Graphina - Charts and Graphs For Elementor 3.1.9
Does "Graphina - Charts and Graphs For Elementor" work with WordPress 6.9 and PHP 8.1.12? A smoke test was performed on .
Summary
| 4 | PHP deprecation warnings |
| No JavaScript exceptions | |
| All test pages loaded successfully | |
| No resource errors |
Memory usage: 1.33 KiB
The average PHP memory usage increased by this amount after activating by the plugin.
Page speed impact:
insignificant.
The plugin didn't make the site noticeably slower.
| WordPress version | 6.9 |
|---|---|
| PHP version | 8.1.12 |
| MySQL version | 10.6.10 |
| PHP memory limit | 512M |
| Last updated | |
|---|---|
| Active installs | 10,000+ |
| WordPress.org page | https://wordpress.org/plugins/graphina-elementor-charts-and-graphs/ |
| Badges |
|
Pages 2
Plugins ‹ Test site — WordPress
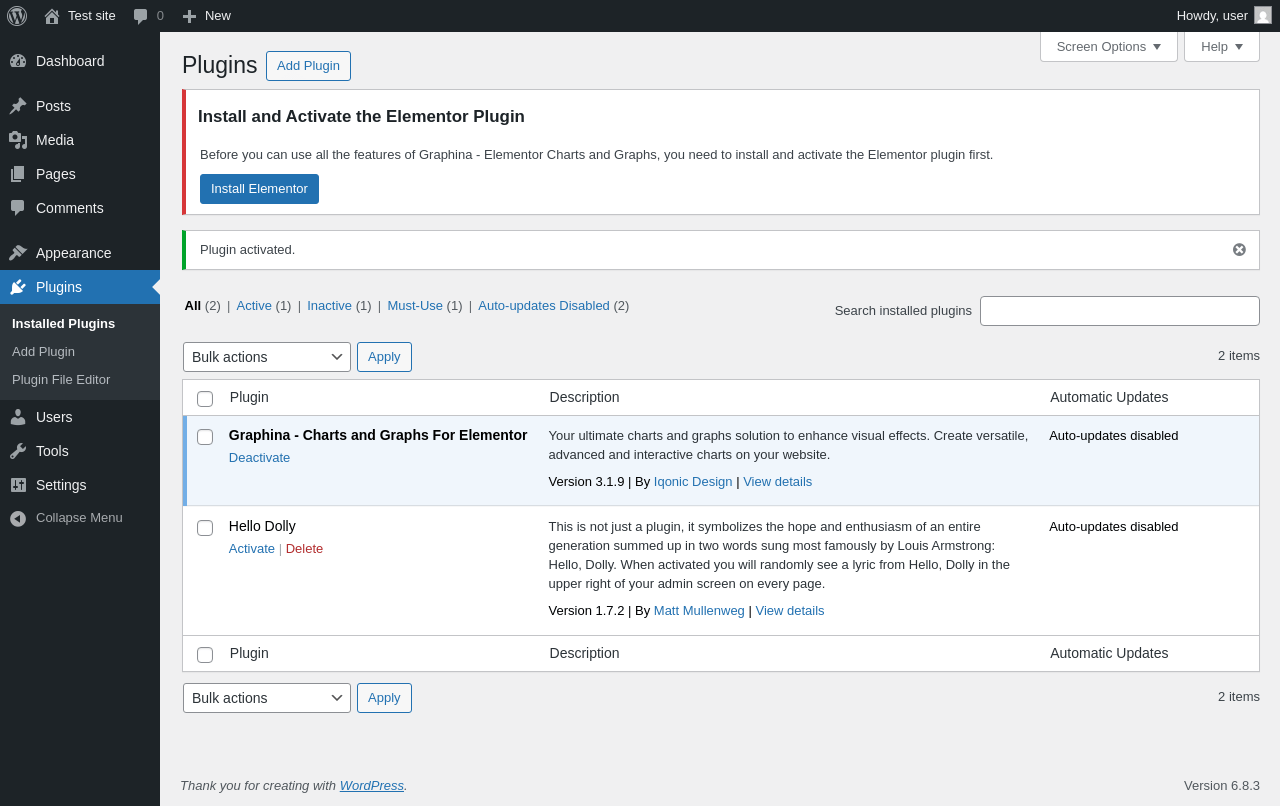
| URL | /wp-admin/plugins.php?plugin_status=all&paged=1&s |
|---|---|
| Requested URL | /wp-admin/plugins.php?action=activate&plugin=graphina-elementor-charts-and-graphs%2Fgraphina-charts-for-elementor.php&plugin_status=all&paged=1&s&_wpnonce=9f09a7949e |
| Aspect | after-activation |
| HTTP status | 200 |
| Load time | 0.321 s |
| Memory usage | 3.73 MiB |
| JS errors | None |
| Resource errors | None |
Test site – Just another WordPress site
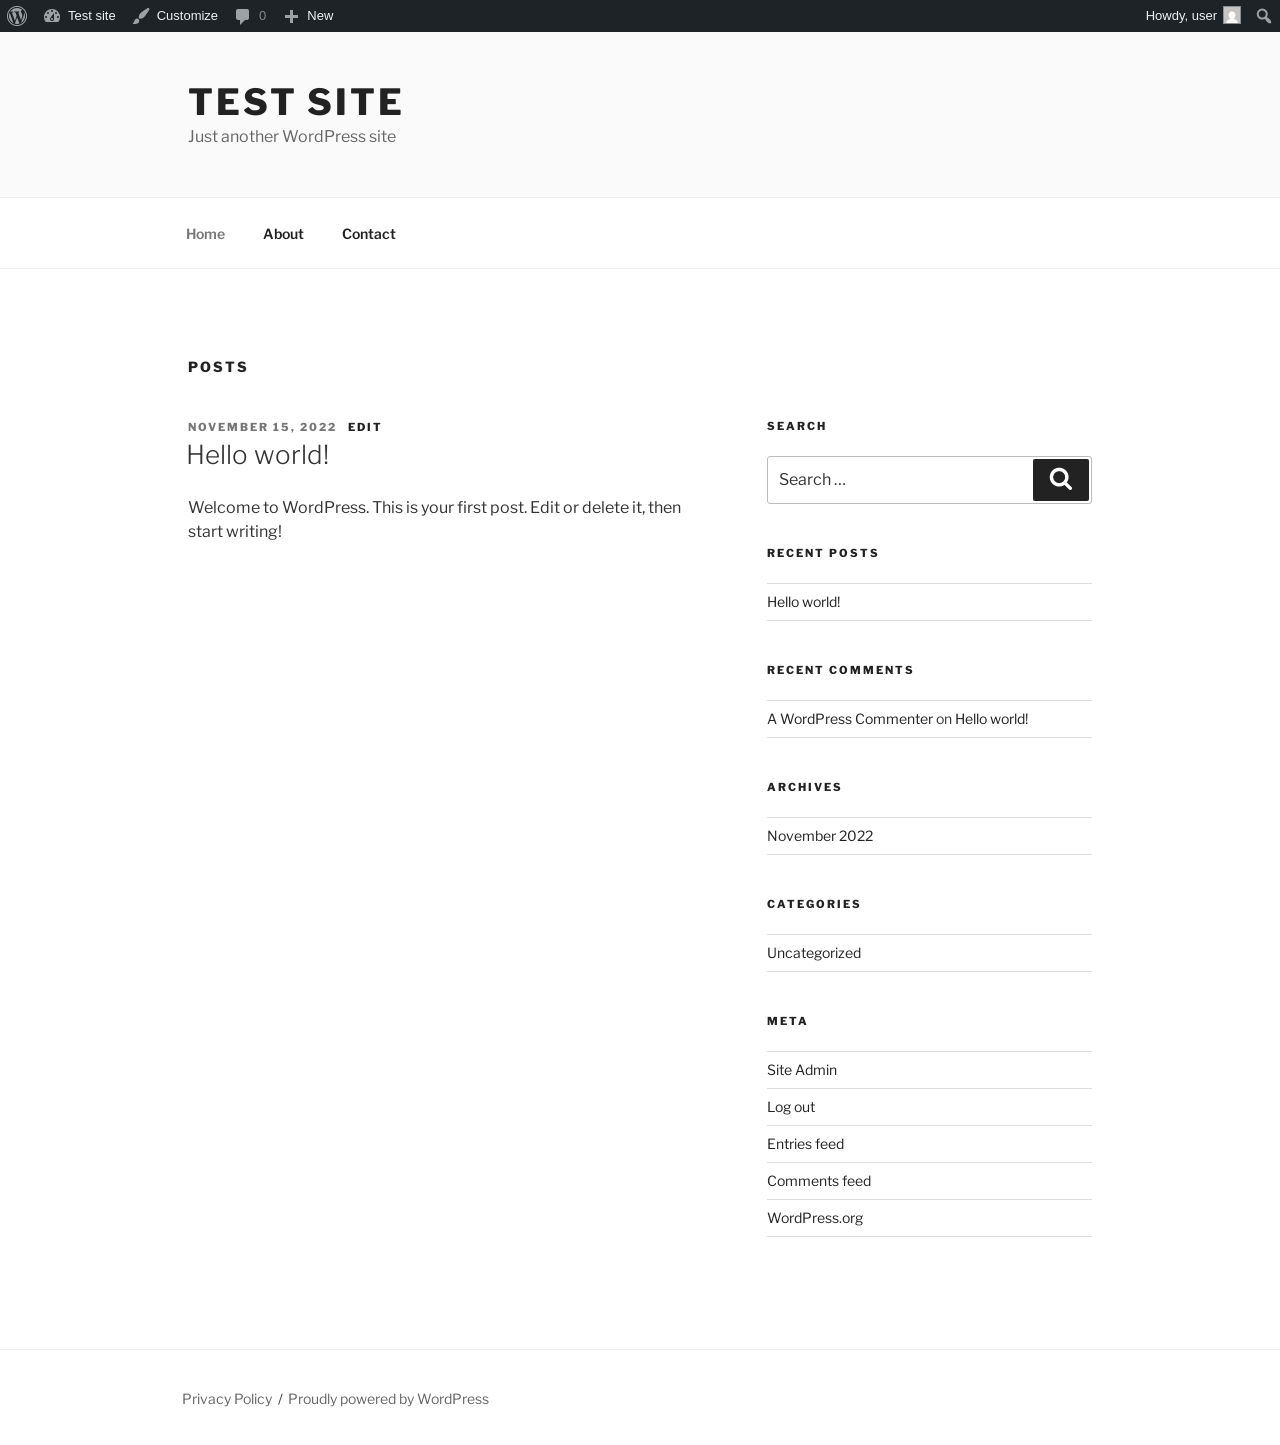
| URL | / |
|---|---|
| Aspect | front-page |
| HTTP status | 200 |
| Load time | 0.163 s |
| Memory usage | 4.11 MiB |
| JS errors | None |
| Resource errors | None |
Benchmark
| URL | Load time | Memory usage | ||||
|---|---|---|---|---|---|---|
| Inactive | Active | Change | Inactive | Active | Change | |
| /wp-admin/index.php | 0.365 s | 0.325 s | -0.040 s | 3.77 MiB | 3.78 MiB | + 10.18 KiB |
| /wp-admin/edit.php | 0.344 s | 0.289 s | -0.055 s | 3.78 MiB | 3.79 MiB | + 5.69 KiB |
| /wp-admin/post-new.php | 0.840 s | 0.885 s | +0.045 s | 6.3 MiB | 6.32 MiB | + 12.57 KiB |
| /wp-admin/upload.php | 0.624 s | 0.437 s | -0.187 s | 3.74 MiB | 3.72 MiB | - 11.73 KiB |
| /wp-admin/options-writing.php | 0.322 s | 0.291 s | -0.031 s | 3.71 MiB | 3.7 MiB | - 7.73 KiB |
| /wp-admin/media-new.php | 0.497 s | 0.316 s | -0.181 s | 3.7 MiB | 3.7 MiB | + 472 bytes |
| /wp-admin/edit-tags.php?taxonomy=category | 0.292 s | 0.292 s | +0.000 s | 3.71 MiB | 3.72 MiB | + 11.13 KiB |
| /wp-admin/post-new.php?post_type=page | 0.730 s | 0.577 s | -0.153 s | 6.29 MiB | 6.3 MiB | + 10 KiB |
| /wp-admin/options-discussion.php | 0.459 s | 0.332 s | -0.127 s | 3.71 MiB | 3.7 MiB | - 11.23 KiB |
| /wp-admin/edit-comments.php | 0.307 s | 0.352 s | +0.045 s | 3.73 MiB | 3.72 MiB | - 11.73 KiB |
| / | 0.406 s | 0.182 s | -0.224 s | 4.1 MiB | 4.11 MiB | + 6.98 KiB |
| Average | 0.471 s | 0.389 s | -0.083 s | 4.23 MiB | 4.23 MiB | + 1.33 KiB |
Code Statistics
Note: Third-party libraries and minified JS/CSS files are excluded from these statistics where possible, so the numbers you see here may be lower than those reported by other tools.
| Language | % | Lines of code | Comment lines | Files | |
|---|---|---|---|---|---|
| PHP | 62.8% | 26,321 | 4,512 | 89 | |
| SVG | 23.5% | 9,871 | 29 | 38 | |
| JavaScript | 11.1% | 4,640 | 398 | 40 | |
| CSS | 2.5% | 1,031 | 34 | 3 | |
| JSON | 0.2% | 75 | 0 | 2 | |
| Total | 41,938 | 4,973 | 172 | ||
PHP Code Analysis | More results »
| Lines of code | 23,455 |
|---|---|
| Total complexity | 4,741 |
| Median class complexity | 102.0 |
| Median method complexity | 1.0 |
| Most complex class | Graphina\Charts\Elementor\GraphinaElementorControls |
| Most complex function | Graphina\Elementor\Widget\LineChart::graphina_prepare_chart_common_options() |
| Classes | 33 |
|---|---|
| Methods | 379 |
| Functions | 70 |
Additions
Things that the plugin adds to the site. This section is not intended to be comprehensive. The test tool only looks for a few specific types of added content.
No new entries found.
PHP Error Log 4 lines
[03-Dec-2025 15:55:18 UTC] PHP Deprecated: Function WP_Dependencies->add_data() was called with an argument that is <strong>deprecated</strong> since version 6.9.0! IE conditional comments are ignored by all supported browsers. in /wp-includes/functions.php on line 6131
[03-Dec-2025 15:55:18 UTC] PHP Deprecated: Function WP_Dependencies->add_data() was called with an argument that is <strong>deprecated</strong> since version 6.9.0! IE conditional comments are ignored by all supported browsers. in /wp-includes/functions.php on line 6131
[03-Dec-2025 15:55:27 UTC] PHP Deprecated: Function WP_Dependencies->add_data() was called with an argument that is <strong>deprecated</strong> since version 6.9.0! IE conditional comments are ignored by all supported browsers. in /wp-includes/functions.php on line 6131
[03-Dec-2025 15:55:27 UTC] PHP Deprecated: Function WP_Dependencies->add_data() was called with an argument that is <strong>deprecated</strong> since version 6.9.0! IE conditional comments are ignored by all supported browsers. in /wp-includes/functions.php on line 6131