Graphina - Elementor Charts and Graphs 3.1.4
Does "Graphina - Elementor Charts and Graphs" work with WordPress 6.8.2 and PHP 8.1.12? A smoke test was performed on .
Summary
| No PHP errors, warnings or notices | |
| No JavaScript exceptions | |
| All test pages loaded successfully | |
| No resource errors | |
| Looks good! No problems were detected. |
Memory usage: -4.73 KiB
The average PHP memory usage increased by this amount after activating by the plugin.
Page speed impact:
insignificant.
The plugin didn't make the site noticeably slower.
| WordPress version | 6.8.2 |
|---|---|
| PHP version | 8.1.12 |
| MySQL version | 10.6.10 |
| PHP memory limit | 512M |
| Last updated | |
|---|---|
| Active installs | 10,000+ |
| WordPress.org page | https://wordpress.org/plugins/graphina-elementor-charts-and-graphs/ |
| Badges |
|
Pages 2
Plugins ‹ Test site — WordPress
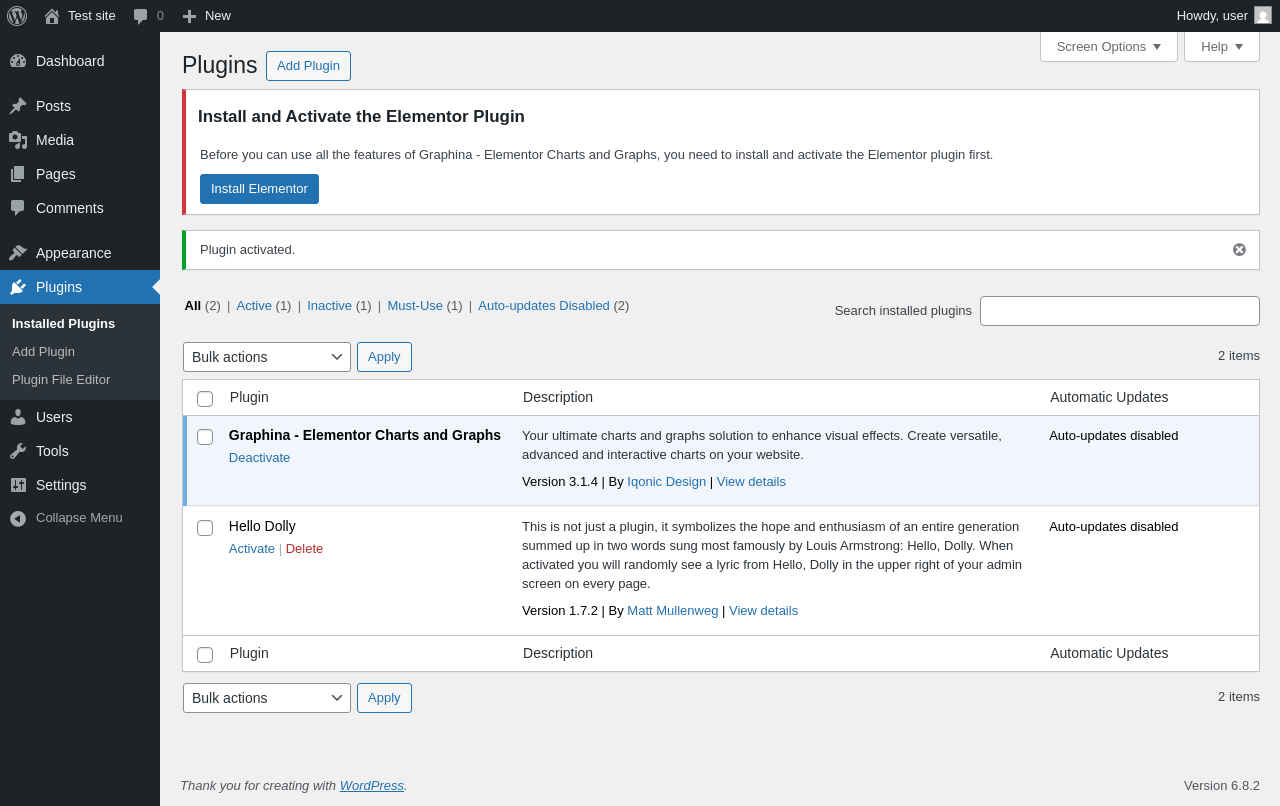
| URL | /wp-admin/plugins.php?plugin_status=all&paged=1&s |
|---|---|
| Requested URL | /wp-admin/plugins.php?action=activate&plugin=graphina-elementor-charts-and-graphs%2Fgraphina-charts-for-elementor.php&plugin_status=all&paged=1&s&_wpnonce=7a883deb1d |
| Aspect | after-activation |
| HTTP status | 200 |
| Load time | 0.243 s |
| Memory usage | 3.53 MiB |
| JS errors | None |
| Resource errors | None |
Test site – Just another WordPress site
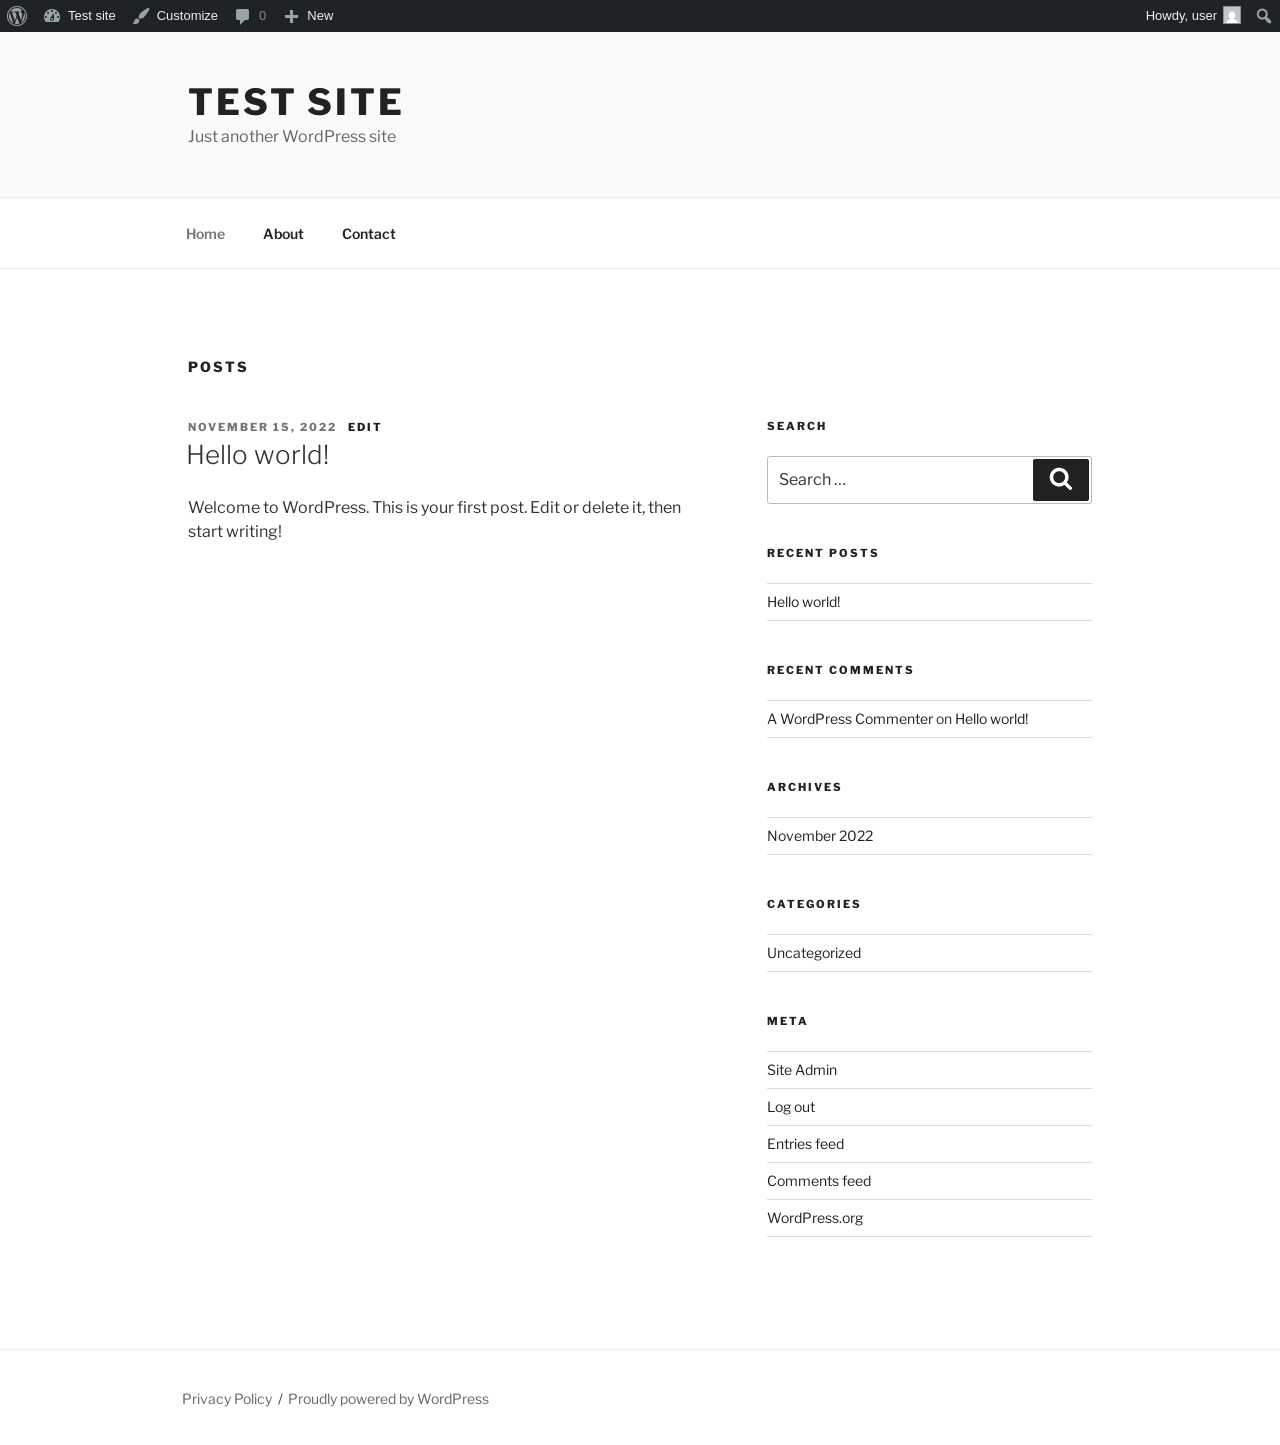
| URL | / |
|---|---|
| Aspect | front-page |
| HTTP status | 200 |
| Load time | 0.176 s |
| Memory usage | 3.44 MiB |
| JS errors | None |
| Resource errors | None |
Benchmark
| URL | Load time | Memory usage | ||||
|---|---|---|---|---|---|---|
| Inactive | Active | Change | Inactive | Active | Change | |
| /wp-admin/index.php | 0.294 s | 0.336 s | +0.042 s | 3.51 MiB | 3.52 MiB | + 10.84 KiB |
| /wp-admin/edit.php | 0.198 s | 0.188 s | -0.010 s | 3.57 MiB | 3.58 MiB | + 6.36 KiB |
| /wp-admin/post-new.php | 0.780 s | 0.611 s | -0.169 s | 6.06 MiB | 6.07 MiB | + 10.78 KiB |
| /wp-admin/upload.php | 0.564 s | 0.386 s | -0.178 s | 3.52 MiB | 3.51 MiB | - 11.05 KiB |
| /wp-admin/options-writing.php | 0.226 s | 0.341 s | +0.115 s | 3.5 MiB | 3.49 MiB | - 7.05 KiB |
| /wp-admin/media-new.php | 0.285 s | 0.243 s | -0.042 s | 3.49 MiB | 3.49 MiB | + 1.14 KiB |
| /wp-admin/edit-tags.php?taxonomy=category | 0.244 s | 0.191 s | -0.053 s | 3.5 MiB | 3.52 MiB | + 11.81 KiB |
| /wp-admin/post-new.php?post_type=page | 0.602 s | 0.638 s | +0.036 s | 6.05 MiB | 6.06 MiB | + 6.31 KiB |
| /wp-admin/options-discussion.php | 0.480 s | 0.244 s | -0.236 s | 3.5 MiB | 3.49 MiB | - 10.55 KiB |
| /wp-admin/edit-comments.php | 0.397 s | 0.206 s | -0.191 s | 3.52 MiB | 3.51 MiB | - 11.05 KiB |
| / | 0.342 s | 0.200 s | -0.142 s | 3.5 MiB | 3.44 MiB | - 59.55 KiB |
| Average | 0.401 s | 0.326 s | -0.075 s | 3.98 MiB | 3.97 MiB | - 4.73 KiB |
Code Statistics
Note: Third-party libraries and minified JS/CSS files are excluded from these statistics where possible, so the numbers you see here may be lower than those reported by other tools.
| Language | % | Lines of code | Comment lines | Files | |
|---|---|---|---|---|---|
| PHP | 62.0% | 25,366 | 4,477 | 88 | |
| SVG | 24.1% | 9,871 | 29 | 38 | |
| JavaScript | 11.2% | 4,598 | 398 | 40 | |
| CSS | 2.5% | 1,031 | 34 | 3 | |
| JSON | 0.2% | 68 | 0 | 2 | |
| Total | 40,934 | 4,938 | 171 | ||
PHP Code Analysis | More results »
| Lines of code | 22,669 |
|---|---|
| Total complexity | 4,392 |
| Median class complexity | 102.0 |
| Median method complexity | 1.0 |
| Most complex class | Graphina\Charts\Elementor\GraphinaElementorControls |
| Most complex function | Graphina\Elementor\Widget\LineChart::graphina_prepare_chart_common_options() |
| Classes | 33 |
|---|---|
| Methods | 379 |
| Functions | 70 |
Additions
Things that the plugin adds to the site. This section is not intended to be comprehensive. The test tool only looks for a few specific types of added content.
No new entries found.
PHP Error Log
The log file is empty.