Google Analytics Dashboard for WP (GADWP) 7.1.0
Does "Google Analytics Dashboard for WP (GADWP)" work with WordPress 5.8.1 and PHP 7.4.8? A smoke test was performed on .
Summary
| No PHP errors, warnings or notices | |
| 1 | JavaScript exceptions |
| All test pages loaded successfully | |
| No resource errors |
Memory usage: 340.08 KiB
The average PHP memory usage increased by this amount after activating by the plugin.
Page speed impact:
0.072 seconds
The average page load time increased by this amount after activating the plugin.
| WordPress version | 5.8.1 |
|---|---|
| PHP version | 7.4.8 |
| MySQL version | 8.0.21 |
| PHP memory limit | 256M |
| Last updated | |
|---|---|
| Active installs | 300,000+ |
| WordPress.org page | https://wordpress.org/plugins/google-analytics-dashboard-for-wp/ |
| Badges |
|
Pages 6
Welcome to ExactMetrics ‹ Test site — WordPress

| URL | /wp-admin/index.php?page=exactmetrics-getting-started&exactmetrics-redirect=1#/ |
|---|---|
| Requested URL | /wp-admin/plugins.php?action=activate&plugin=google-analytics-dashboard-for-wp%2Fgadwp.php&plugin_status=all&paged=1&s&_wpnonce=d4e7e19534 |
| Aspect | after-activation |
| HTTP status | 200 |
| Load time | 1.159 s |
| Memory usage | 3.29 MiB |
| JS errors | None |
| Resource errors | None |
Dashboard → ExactMetrics
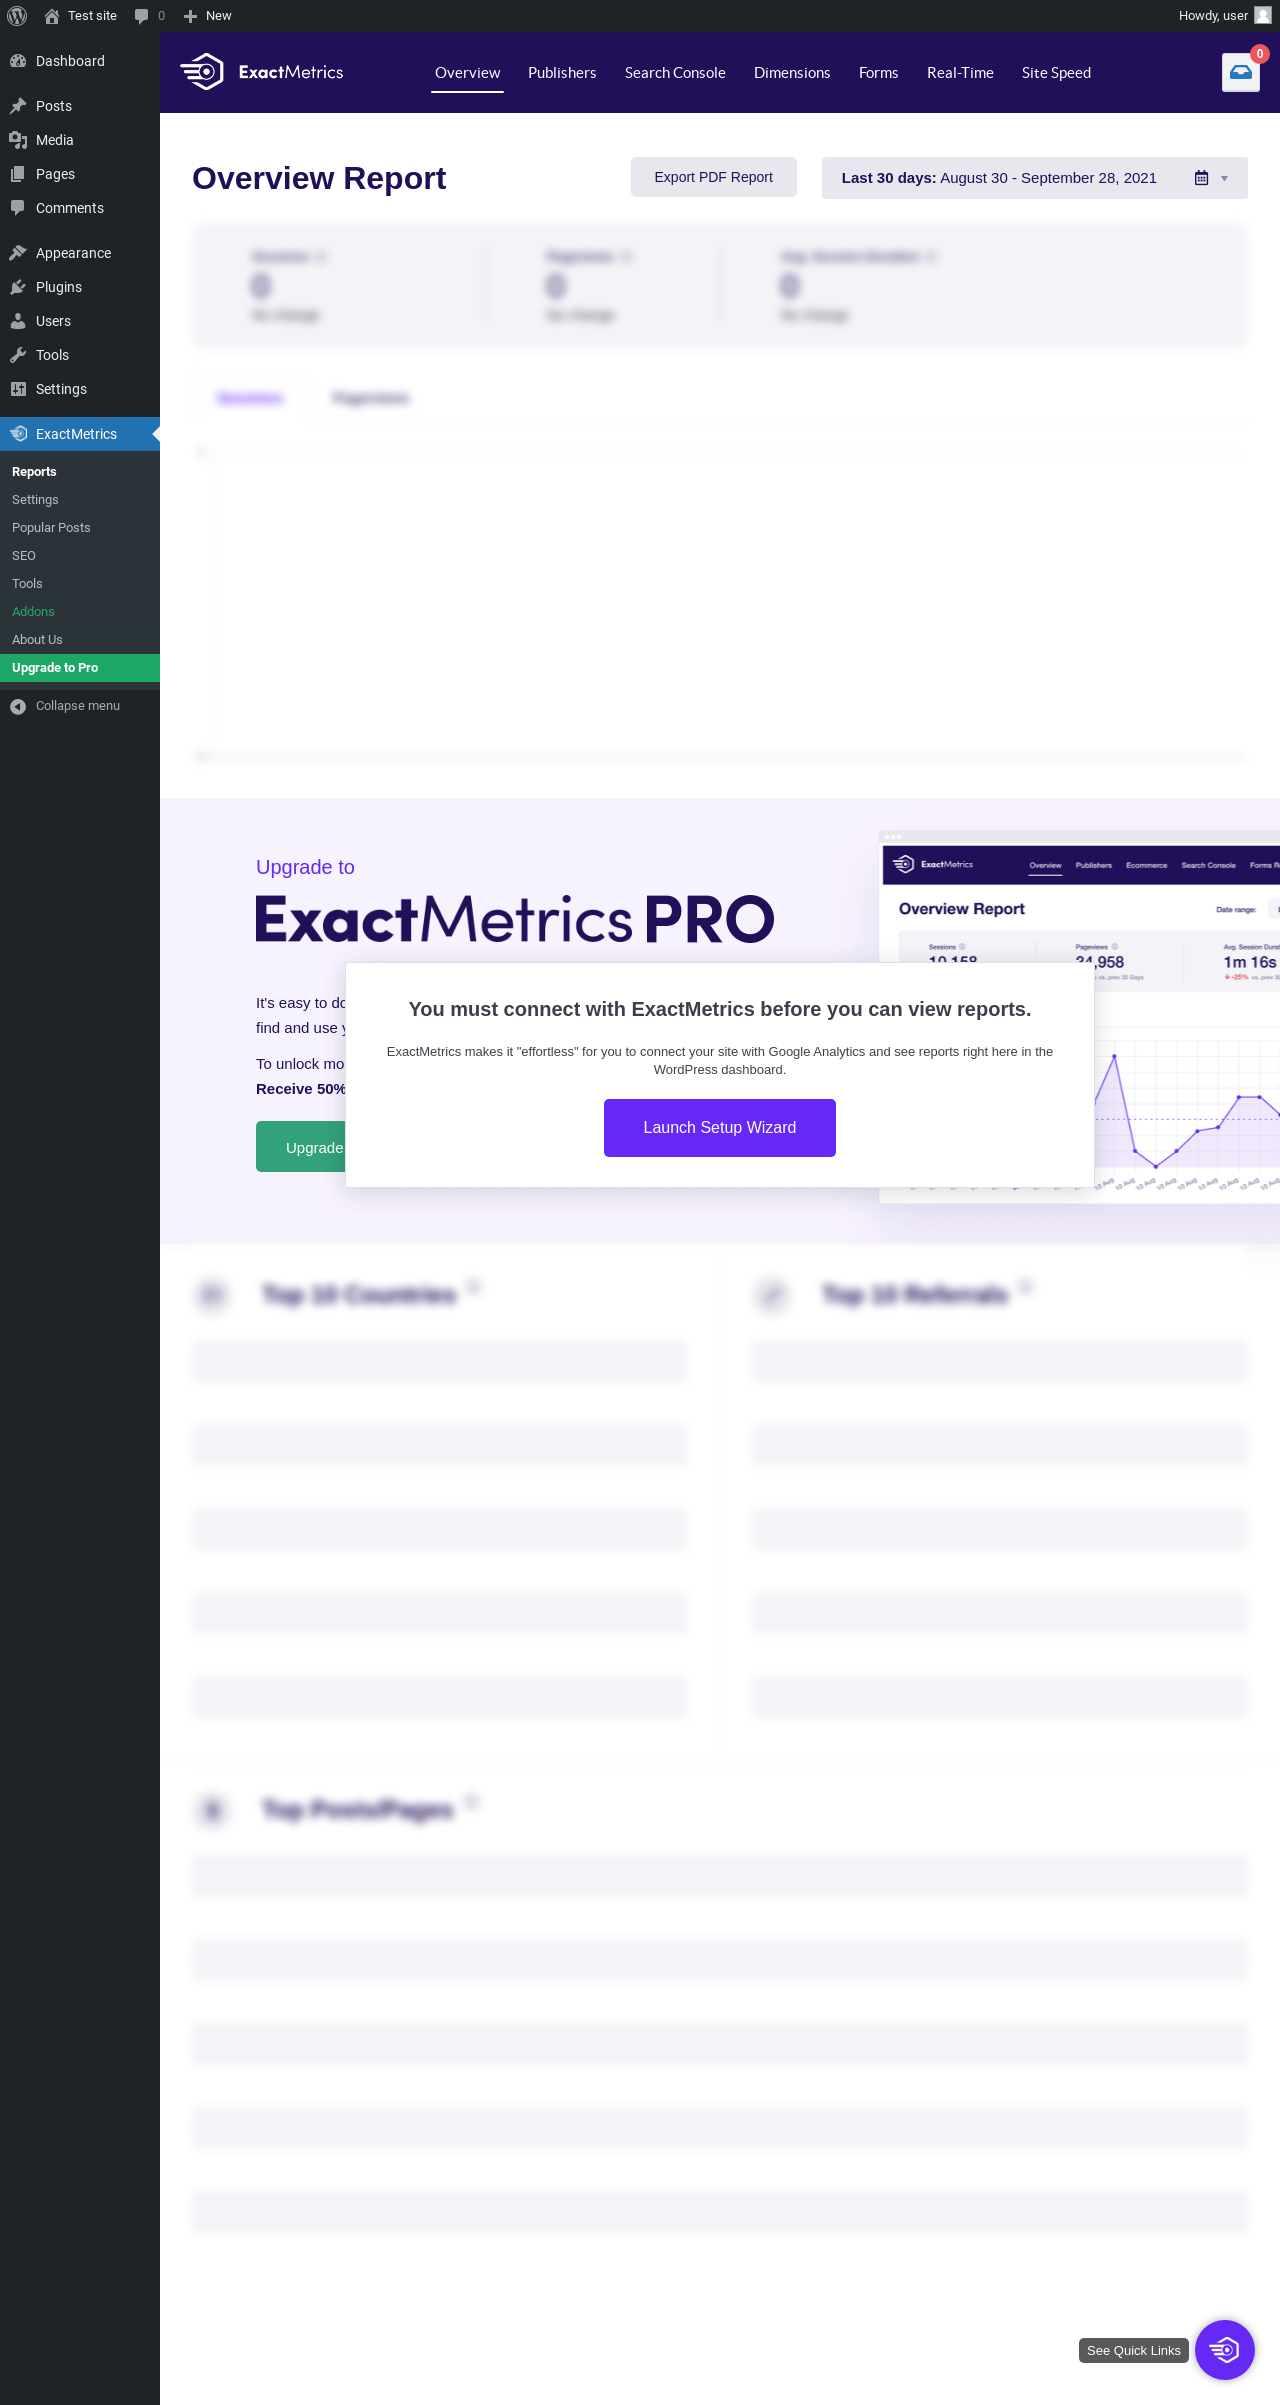
| URL | /wp-admin/admin.php?page=exactmetrics_reports#/ |
|---|---|
| Requested URL | /wp-admin/admin.php?page=exactmetrics_reports |
| Aspect | menu-item |
| HTTP status | 200 |
| Load time | 0.711 s |
| Memory usage | 3.3 MiB |
| JS errors | None |
| Resource errors | None |
ExactMetrics → Settings

| URL | /wp-admin/admin.php?page=exactmetrics_settings#/ |
|---|---|
| Requested URL | /wp-admin/admin.php?page=exactmetrics_settings |
| Aspect | menu-item |
| HTTP status | 200 |
| Load time | 1.043 s |
| Memory usage | 3.3 MiB |
| JS errors | None |
| Resource errors | None |
Test site – Just another WordPress site

| URL | / |
|---|---|
| Aspect | front-page |
| HTTP status | 200 |
| Load time | 0.299 s |
| Memory usage | 3.04 MiB |
| JS errors | None |
| Resource errors | None |
Dashboard ‹ Test site — WordPress
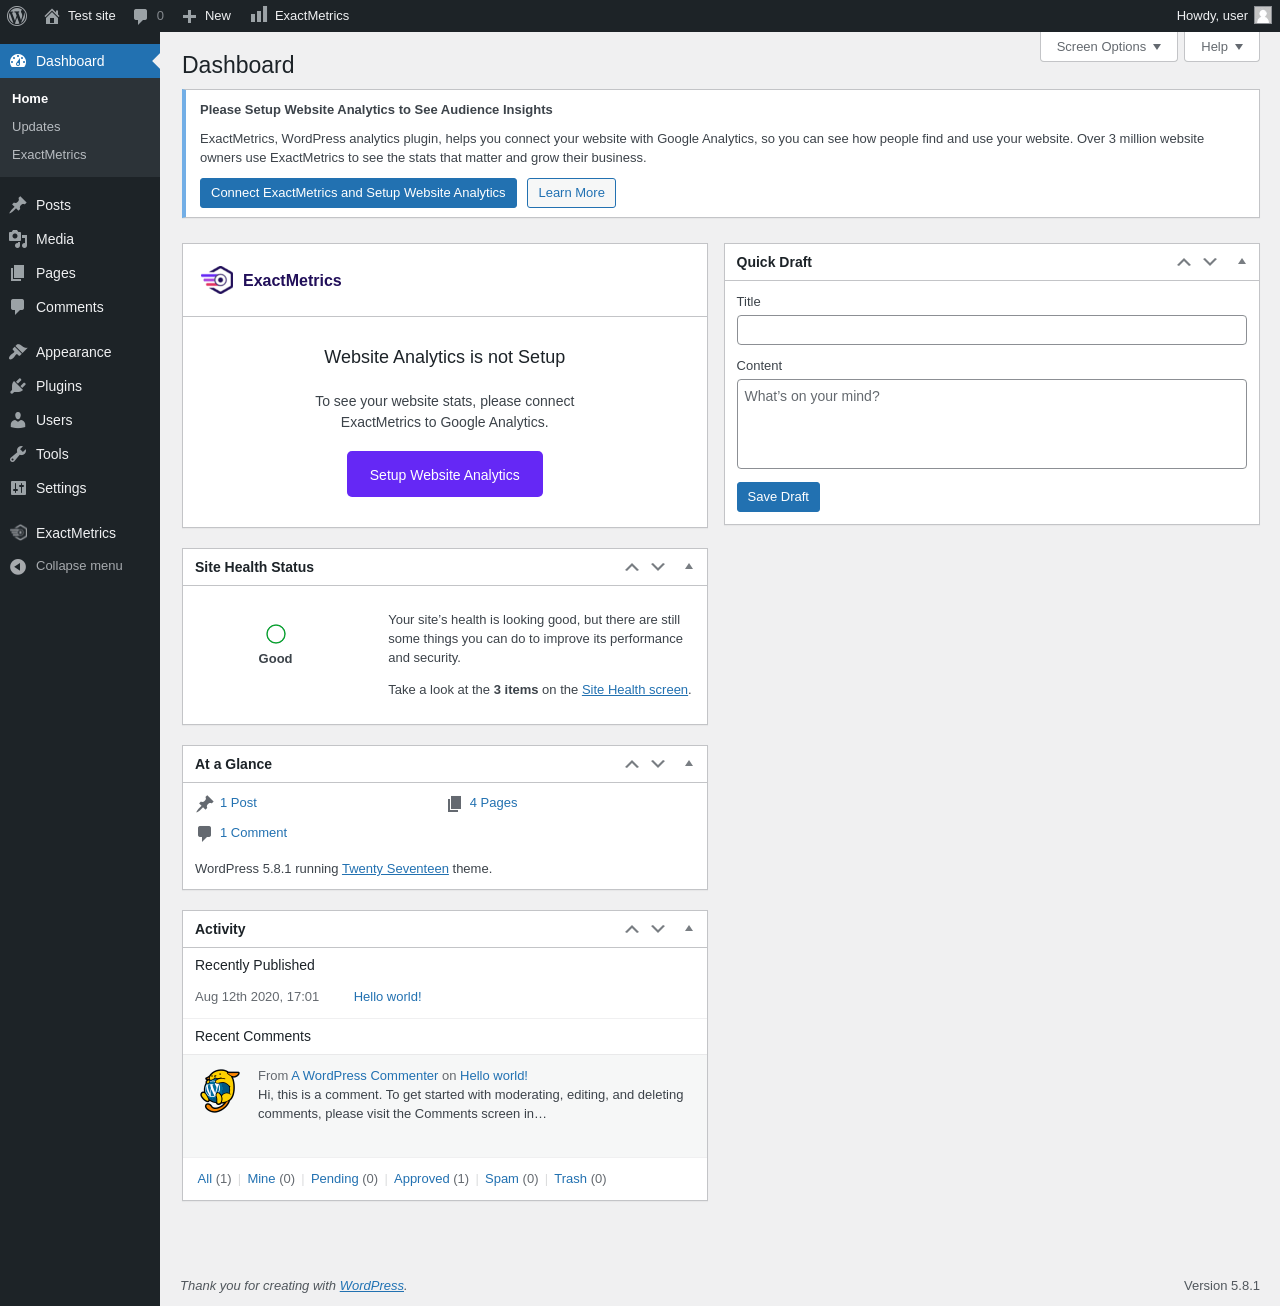
| URL | /wp-admin/index.php |
|---|---|
| Aspect | new-meta-boxes |
| HTTP status | 200 |
| Load time | 0.416 s |
| Memory usage | 3.45 MiB |
| JS errors | None |
| Resource errors | None |
Widgets ‹ Test site — WordPress

| URL | /wp-admin/widgets.php |
|---|---|
| Aspect | new-sidebar-widgets |
| HTTP status | 200 |
| Load time | 1.750 s |
| Memory usage | 4.85 MiB |
| JS errors | |
| Resource errors | None |
Benchmark
| URL | Load time | Memory usage | ||||
|---|---|---|---|---|---|---|
| Inactive | Active | Change | Inactive | Active | Change | |
| /wp-admin/index.php | 0.308 s | 0.597 s | +0.289 s | 3.08 MiB | 3.45 MiB | + 373.21 KiB |
| /wp-admin/edit.php | 0.182 s | 0.272 s | +0.090 s | 3.11 MiB | 3.48 MiB | + 380.13 KiB |
| /wp-admin/post-new.php | 0.759 s | 1.051 s | +0.292 s | 5.27 MiB | 5.66 MiB | + 398.09 KiB |
| /wp-admin/upload.php | 0.504 s | 0.688 s | +0.184 s | 3.03 MiB | 3.38 MiB | + 357.84 KiB |
| /wp-admin/options-writing.php | 0.165 s | 0.193 s | +0.028 s | 3.02 MiB | 3.36 MiB | + 343.02 KiB |
| /wp-admin/media-new.php | 0.392 s | 0.229 s | -0.163 s | 3.01 MiB | 3.36 MiB | + 358.27 KiB |
| /wp-admin/edit-tags.php?taxonomy=category | 0.177 s | 0.274 s | +0.097 s | 3.04 MiB | 3.41 MiB | + 379.49 KiB |
| /wp-admin/post-new.php?post_type=page | 1.047 s | 0.809 s | -0.238 s | 5.26 MiB | 5.65 MiB | + 397.05 KiB |
| /wp-admin/options-discussion.php | 0.216 s | 0.352 s | +0.136 s | 3 MiB | 3.29 MiB | + 295.84 KiB |
| /wp-admin/edit-comments.php | 0.200 s | 0.234 s | +0.034 s | 3.04 MiB | 3.41 MiB | + 376.88 KiB |
| / | 0.274 s | 0.316 s | +0.042 s | 2.91 MiB | 2.99 MiB | + 81.02 KiB |
| Average | 0.384 s | 0.456 s | +0.072 s | 3.43 MiB | 3.77 MiB | + 340.08 KiB |
Code Statistics
Note: Third-party libraries and minified JS/CSS files are excluded from these statistics where possible, so the numbers you see here may be lower than those reported by other tools.
| Language | % | Lines of code | Comment lines | Files | |
|---|---|---|---|---|---|
| PHP | 95.5% | 37,578 | 8,107 | 112 | |
| JavaScript | 3.5% | 1,358 | 156 | 13 | |
| CSS | 0.7% | 272 | 9 | 18 | |
| SVG | 0.2% | 92 | 0 | 20 | |
| JSON | 0.1% | 20 | 0 | 1 | |
| Markdown | 0.0% | 19 | 0 | 2 | |
| Total | 39,339 | 8,272 | 166 | ||
PHP Code Analysis | More results »
| Lines of code | 14,916 |
|---|---|
| Total complexity | 3,243 |
| Median class complexity | 19.0 |
| Median method complexity | 2.0 |
| Most complex class | ExactMetrics_Rest_Routes |
| Most complex function | ExactMetrics_Install::get_settings_from_gadwp() |
| Classes | 69 |
|---|---|
| Methods | 539 |
| Functions | 163 |
Additions
Things that the plugin adds to the site. This section is not intended to be comprehensive. The test tool only looks for a few specific types of added content.
Options wp_options 8
- exactmetrics_current_version
- exactmetrics_db_version
- exactmetrics_notifications_run
- exactmetrics_over_time
- exactmetrics_review
- exactmetrics_settings
- exactmetrics_usage_tracking_config
- widget_exactmetrics-popular-posts-widget
Sidebar Widgets 1
| ID | Name |
|---|---|
| exactmetrics-popular-posts-widget | Popular Posts - ExactMetrics |
Meta Boxes
{
    "dashboard": {
        "exactmetrics_reports_widget": {
            "title": "ExactMetrics",
            "context": "normal"
        }
    }
}
PHP Error Log
The log file is empty.