Google Analytics Dashboard for WP (GADWP) 6.1.0
Does "Google Analytics Dashboard for WP (GADWP)" work with WordPress 5.4.2 and PHP 7.2.16? A smoke test was performed on .
Summary
Errors
| No PHP errors, warnings or notices | |
| No JavaScript exceptions | |
| All test pages loaded successfully | |
| No resource errors | |
| Looks good! No problems were detected. |
Performance
Memory usage: 286.45 KiB
The average PHP memory usage increased by this amount after activating by the plugin.
Page speed impact:
0.125 seconds
The average page load time increased by this amount after activating the plugin.
Environment
| WordPress version | 5.4.2 |
|---|---|
| PHP version | 7.2.16 |
| MySQL version | 8.0.15 |
| PHP memory limit | 256M |
Plugin Info
| Last updated | |
|---|---|
| Active installs | 300,000+ |
| WordPress.org page | https://wordpress.org/plugins/google-analytics-dashboard-for-wp/ |
| Badges |
|
Pages 5
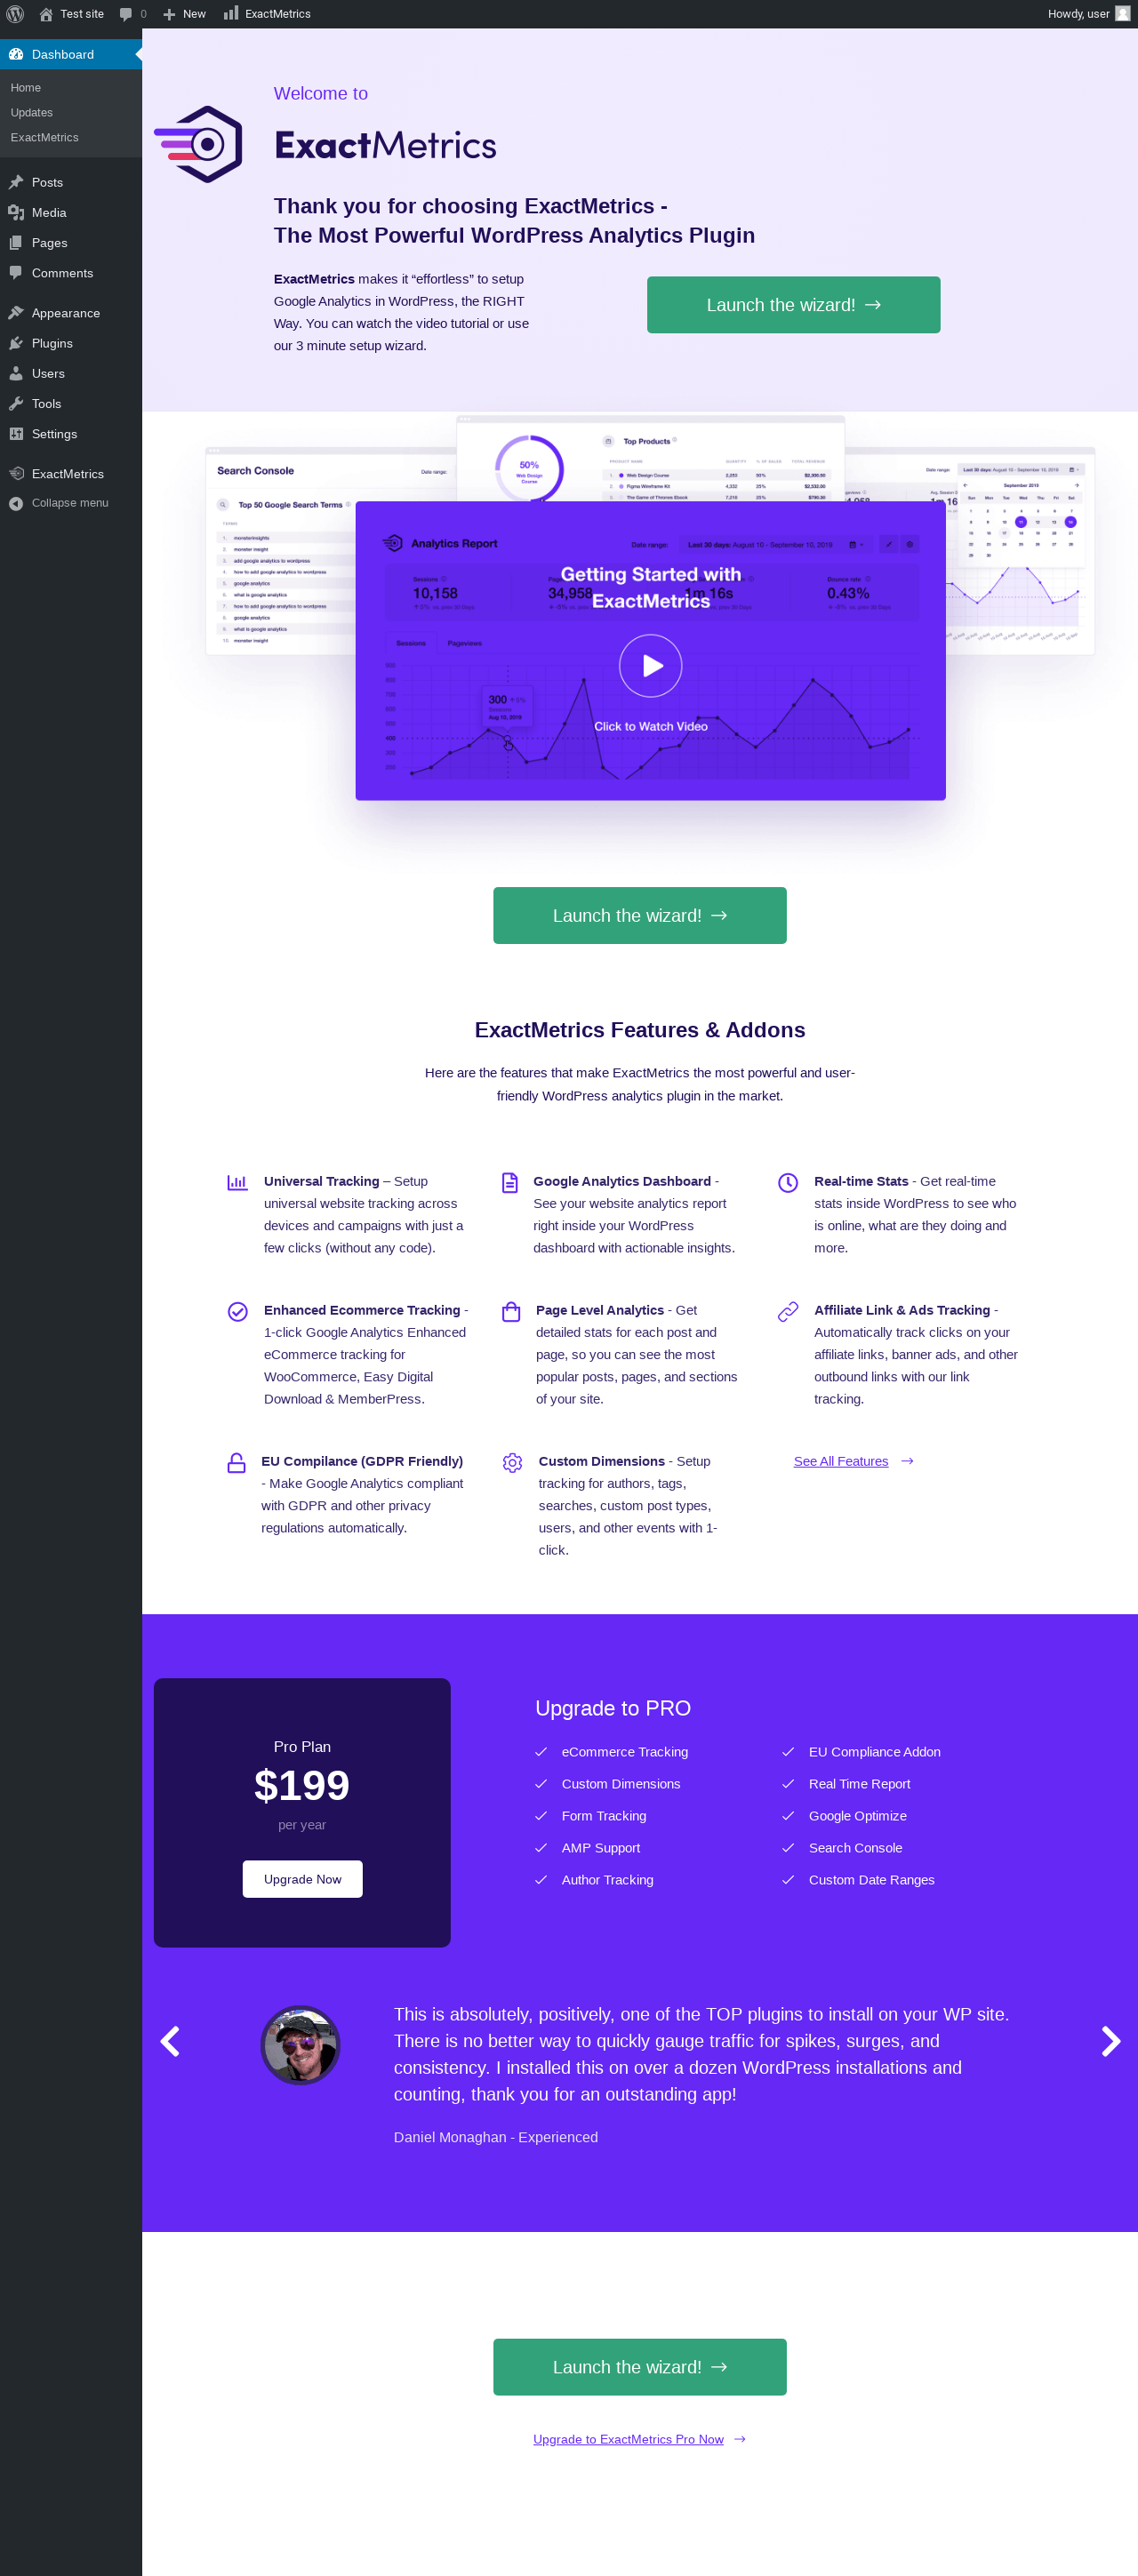
Welcome to ExactMetrics ‹ Test site — WordPress
| URL | /wp-admin/index.php?page=exactmetrics-getting-started&exactmetrics-redirect=1#/ |
|---|---|
| Requested URL | /wp-admin/plugins.php?action=activate&plugin=google-analytics-dashboard-for-wp%2Fgadwp.php&plugin_status=all&paged=1&s&_wpnonce=6a312b89a7 |
| Aspect | after-activation |
| HTTP status | 200 |
| Load time | 1.150 s |
| Memory usage | 3.8 MiB |
| JS errors | None |
| Resource errors | None |
Dashboard → ExactMetrics

| URL | /wp-admin/admin.php?page=exactmetrics_reports#/ |
|---|---|
| Requested URL | /wp-admin/admin.php?page=exactmetrics_reports |
| Aspect | menu-item |
| HTTP status | 200 |
| Load time | 0.556 s |
| Memory usage | 3.81 MiB |
| JS errors | None |
| Resource errors | None |
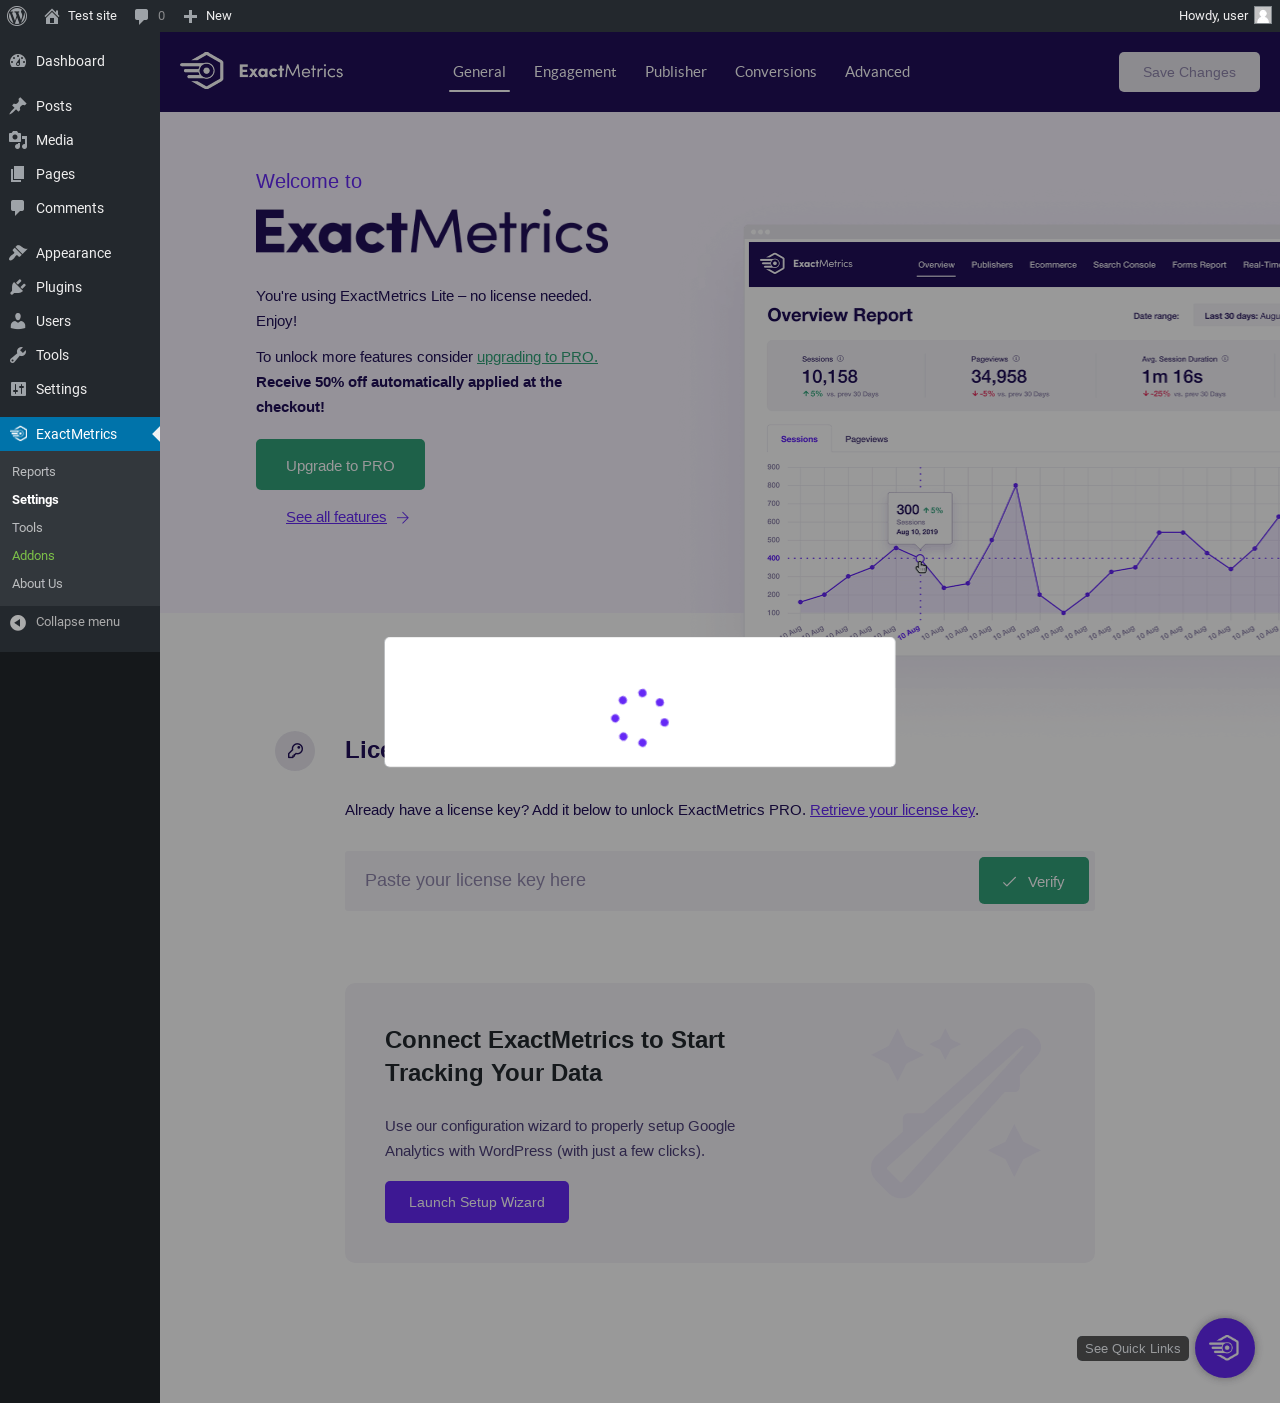
ExactMetrics → Settings
| URL | /wp-admin/admin.php?page=exactmetrics_settings#/ |
|---|---|
| Requested URL | /wp-admin/admin.php?page=exactmetrics_settings |
| Aspect | menu-item |
| HTTP status | 200 |
| Load time | 0.866 s |
| Memory usage | 3.81 MiB |
| JS errors | None |
| Resource errors | None |
Test site – Just another WordPress site

| URL | / |
|---|---|
| Aspect | front-page |
| HTTP status | 200 |
| Load time | 0.450 s |
| Memory usage | 3.44 MiB |
| JS errors | None |
| Resource errors | None |
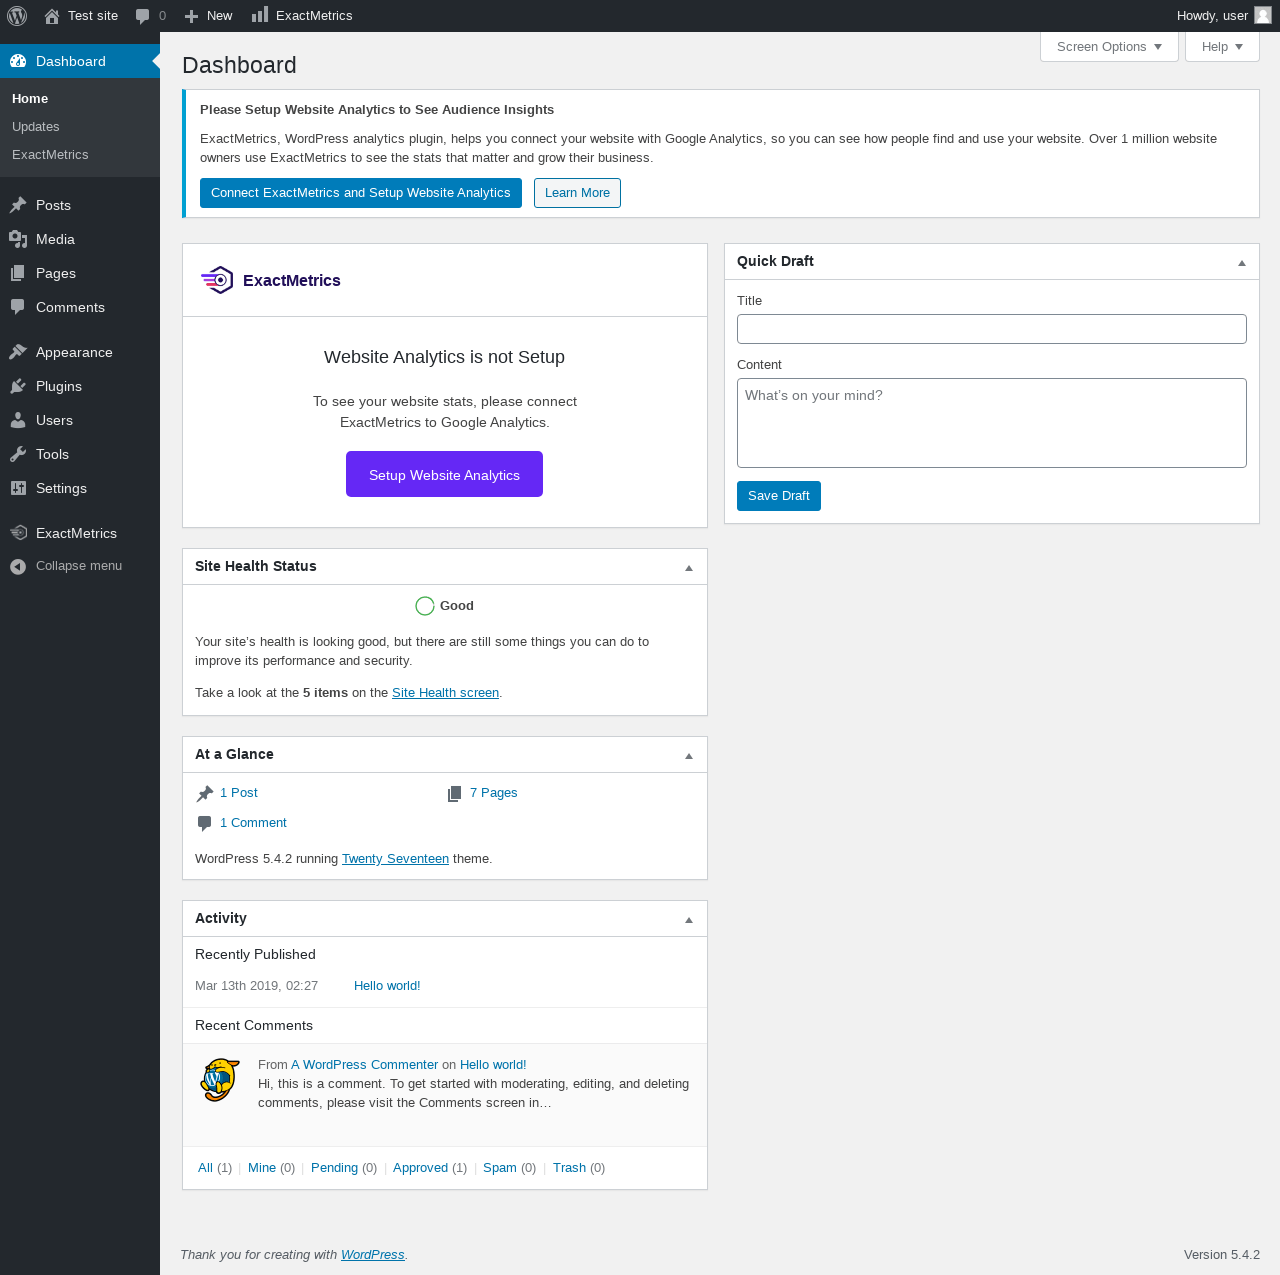
Dashboard ‹ Test site — WordPress
| URL | /wp-admin/index.php |
|---|---|
| Aspect | new-meta-boxes |
| HTTP status | 200 |
| Load time | 0.451 s |
| Memory usage | 3.97 MiB |
| JS errors | None |
| Resource errors | None |
Benchmark
| URL | Load time | Memory usage | ||||
|---|---|---|---|---|---|---|
| Inactive | Active | Change | Inactive | Active | Change | |
| /wp-admin/index.php | 0.341 s | 0.617 s | +0.276 s | 3.64 MiB | 3.97 MiB | + 337.3 KiB |
| /wp-admin/edit.php | 0.228 s | 0.348 s | +0.120 s | 3.67 MiB | 3.99 MiB | + 328.88 KiB |
| /wp-admin/post-new.php | 1.251 s | 1.777 s | +0.526 s | 5.43 MiB | 5.76 MiB | + 336.41 KiB |
| /wp-admin/upload.php | 0.493 s | 0.538 s | +0.045 s | 3.5 MiB | 3.82 MiB | + 327.84 KiB |
| /wp-admin/options-writing.php | 0.170 s | 0.201 s | +0.031 s | 3.58 MiB | 3.81 MiB | + 236.95 KiB |
| /wp-admin/media-new.php | 0.462 s | 0.227 s | -0.235 s | 3.48 MiB | 3.8 MiB | + 330.52 KiB |
| /wp-admin/edit-tags.php?taxonomy=category | 0.182 s | 0.235 s | +0.053 s | 3.58 MiB | 3.91 MiB | + 330.21 KiB |
| /wp-admin/post-new.php?post_type=page | 1.135 s | 1.555 s | +0.420 s | 5.42 MiB | 5.74 MiB | + 329.59 KiB |
| /wp-admin/options-discussion.php | 0.295 s | 0.400 s | +0.105 s | 3.48 MiB | 3.81 MiB | + 331.18 KiB |
| /wp-admin/edit-comments.php | 0.198 s | 0.260 s | +0.062 s | 3.59 MiB | 3.91 MiB | + 329.16 KiB |
| / | 0.334 s | 0.311 s | -0.023 s | 3.43 MiB | 3.37 MiB | - 67.15 KiB |
| Average | 0.463 s | 0.588 s | +0.125 s | 3.89 MiB | 4.17 MiB | + 286.45 KiB |
Additions
Things that the plugin adds to the site. This section is not intended to be comprehensive. The test tool only looks for a few specific types of added content.
Options wp_options 6
- exactmetrics_current_version
- exactmetrics_db_version
- exactmetrics_over_time
- exactmetrics_review
- exactmetrics_settings
- exactmetrics_usage_tracking_config
Meta Boxes
{
    "dashboard": {
        "exactmetrics_reports_widget": {
            "title": "ExactMetrics",
            "context": "normal"
        }
    }
}
PHP Error Log
The log file is empty.
See also: All tests for this plugin, How to Hide Google Analytics Dashboard for WP (GADWP) Admin Menus and Widgets