Photo Gallery by Supsystic 1.15.9
Does Photo Gallery by Supsystic work with WordPress 6.0.1 and PHP 7.4.8? A smoke test was performed on .
Summary
| 13 | Unrecognized messages in the PHP error log |
| No JavaScript exceptions | |
| All test pages loaded successfully | |
| No resource errors |
Memory usage: 431.98 KiB
The average PHP memory usage increased by this amount after activating by the plugin.
Page speed impact:
0.055 seconds
The average page load time increased by this amount after activating the plugin.
| WordPress version | 6.0.1 |
|---|---|
| PHP version | 7.4.8 |
| MySQL version | 8.0.21 |
| PHP memory limit | 256M |
| Last updated | |
|---|---|
| Active installs | 30,000+ |
| WordPress.org page | https://wordpress.org/plugins/gallery-by-supsystic/ |
| Badges |
|
Pages 9
Plugins ‹ Test site — WordPress

| URL | /wp-admin/plugins.php?plugin_status=all&paged=1&s |
|---|---|
| Requested URL | /wp-admin/plugins.php?action=activate&plugin=gallery-by-supsystic%2Findex.php&plugin_status=all&paged=1&s&_wpnonce=3c84d42ab2 |
| Aspect | after-activation |
| HTTP status | 200 |
| Load time | 1.251 s |
| Memory usage | 4.25 MiB |
| JS errors | None |
| Resource errors | None |
Photo Gallery by Supsystic

| URL | /wp-admin/admin.php?page=supsystic-gallery&module=promo&action=welcome |
|---|---|
| Requested URL | /wp-admin/admin.php?page=supsystic-gallery |
| Aspect | menu-item |
| HTTP status | 200 |
| Load time | 2.003 s |
| Memory usage | 4.91 MiB |
| JS errors | None |
| Resource errors | None |
Photo Gallery by Supsystic → Overview

| URL | /wp-admin/admin.php?page=supsystic-gallery&module=overview |
|---|---|
| Aspect | menu-item |
| HTTP status | 200 |
| Load time | 1.865 s |
| Memory usage | 6.51 MiB |
| JS errors | None |
| Resource errors | None |
Photo Gallery by Supsystic → New gallery

| URL | /wp-admin/admin.php?page=supsystic-gallery&module=galleries&action=showPresets |
|---|---|
| Aspect | menu-item |
| HTTP status | 200 |
| Load time | 1.293 s |
| Memory usage | 4.99 MiB |
| JS errors | None |
| Resource errors | None |
Photo Gallery by Supsystic → Image Optimize

| URL | /wp-admin/admin.php?page=supsystic-gallery&module=optimization |
|---|---|
| Aspect | menu-item |
| HTTP status | 200 |
| Load time | 0.685 s |
| Memory usage | 7.41 MiB |
| JS errors | None |
| Resource errors | None |
Photo Gallery by Supsystic → Galleries

| URL | /wp-admin/admin.php?page=supsystic-gallery&module=galleries |
|---|---|
| Aspect | menu-item |
| HTTP status | 200 |
| Load time | 0.421 s |
| Memory usage | 6.27 MiB |
| JS errors | None |
| Resource errors | None |
Photo Gallery by Supsystic → Settings

| URL | /wp-admin/admin.php?page=supsystic-gallery&module=settings |
|---|---|
| Aspect | menu-item |
| HTTP status | 200 |
| Load time | 0.798 s |
| Memory usage | 4.7 MiB |
| JS errors | None |
| Resource errors | None |
Test site – Just another WordPress site
| URL | / |
|---|---|
| Aspect | front-page |
| HTTP status | 200 |
| Load time | 0.291 s |
| Memory usage | 3.93 MiB |
| JS errors | None |
| Resource errors | None |
Widgets ‹ Test site — WordPress
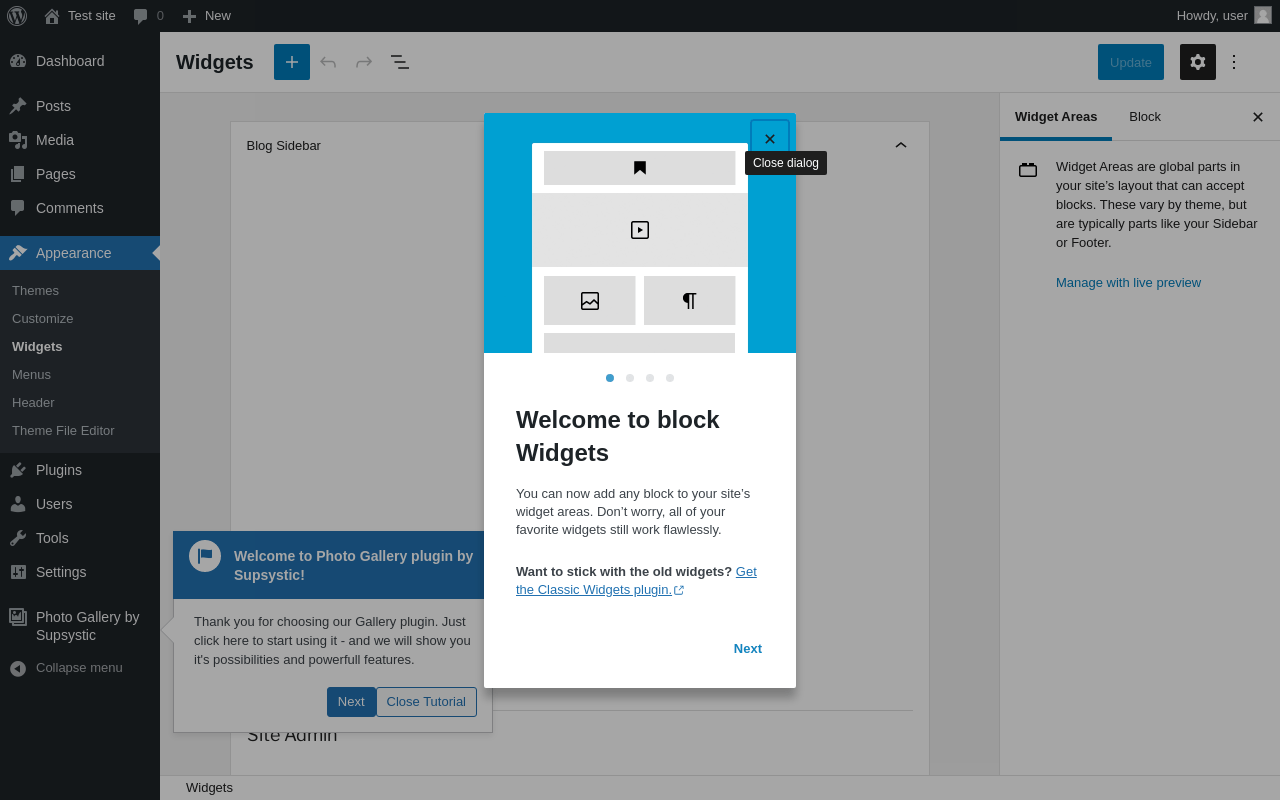
| URL | /wp-admin/widgets.php |
|---|---|
| Aspect | new-sidebar-widgets |
| HTTP status | 200 |
| Load time | 1.702 s |
| Memory usage | 5.93 MiB |
| JS errors |
External errors:
The following JavaScript errors were probably triggered by
WordPress itself, or by compatibility issues in the test runner.
They are not related to the plugin.
|
| Resource errors | None |
Benchmark
| URL | Load time | Memory usage | ||||
|---|---|---|---|---|---|---|
| Inactive | Active | Change | Inactive | Active | Change | |
| /wp-admin/index.php | 0.327 s | 0.377 s | +0.050 s | 3.72 MiB | 4.14 MiB | + 423.97 KiB |
| /wp-admin/edit.php | 0.181 s | 0.288 s | +0.107 s | 3.75 MiB | 4.24 MiB | + 494.59 KiB |
| /wp-admin/post-new.php | 0.827 s | 1.346 s | +0.519 s | 5.55 MiB | 5.95 MiB | + 412.11 KiB |
| /wp-admin/upload.php | 0.406 s | 0.377 s | -0.029 s | 3.68 MiB | 4.08 MiB | + 405.73 KiB |
| /wp-admin/options-writing.php | 0.171 s | 0.245 s | +0.074 s | 3.62 MiB | 4.08 MiB | + 479.3 KiB |
| /wp-admin/media-new.php | 0.417 s | 0.305 s | -0.112 s | 3.66 MiB | 4.08 MiB | + 426.66 KiB |
| /wp-admin/edit-tags.php?taxonomy=category | 0.207 s | 0.310 s | +0.103 s | 3.69 MiB | 4.11 MiB | + 434.34 KiB |
| /wp-admin/post-new.php?post_type=page | 1.231 s | 0.802 s | -0.429 s | 5.54 MiB | 5.94 MiB | + 407.07 KiB |
| /wp-admin/options-discussion.php | 0.209 s | 0.306 s | +0.097 s | 3.6 MiB | 4.08 MiB | + 500.2 KiB |
| /wp-admin/edit-comments.php | 0.210 s | 0.488 s | +0.278 s | 3.69 MiB | 4.12 MiB | + 431.39 KiB |
| / | 0.285 s | 0.227 s | -0.058 s | 3.6 MiB | 3.93 MiB | + 336.41 KiB |
| Average | 0.406 s | 0.461 s | +0.055 s | 4.01 MiB | 4.43 MiB | + 431.98 KiB |
Code Statistics
Note: Third-party libraries and minified JS/CSS files are excluded from these statistics where possible, so the numbers you see here may be lower than those reported by other tools.
| Language | % | Lines of code | Comment lines | Files | |
|---|---|---|---|---|---|
| PO File | 37.8% | 26,414 | 2,663 | 19 | |
| JavaScript | 22.3% | 15,593 | 1,526 | 88 | |
| PHP | 16.3% | 11,395 | 3,488 | 88 | |
| CSS | 12.3% | 8,616 | 420 | 32 | |
| Twig | 11.1% | 7,725 | 216 | 55 | |
| JSON | 0.0% | 30 | 0 | 1 | |
| SVG | 0.0% | 29 | 0 | 1 | |
| Total | 69,802 | 8,313 | 284 | ||
PHP Code Analysis | More results »
| Lines of code | 10,592 |
|---|---|
| Total complexity | 2,118 |
| Median class complexity | 14.0 |
| Median method complexity | 2.0 |
| Most complex class | Mobile_Detect |
| Most complex function | Mobile_Detect::mobileGrade() |
| Classes | 79 |
|---|---|
| Methods | 709 |
| Functions | 1 |
Additions
Things that the plugin adds to the site. This section is not intended to be comprehensive. The test tool only looks for a few specific types of added content.
Database Tables 15
- wp_gg_attributes
- wp_gg_cdn
- wp_gg_folders
- wp_gg_galleries
- wp_gg_galleries_excluded
- wp_gg_galleries_resources
- wp_gg_image_optimize
- wp_gg_membership_presets
- wp_gg_photos
- wp_gg_photos_pos
- wp_gg_photos_settings
- wp_gg_settings_presets
- wp_gg_settings_sets
- wp_gg_stats
- wp_gg_tags
Options wp_options 5
- grid_gallery_last_version
- sg_plugin_version
- sg_welcome_page_was_showed
- sgg_plug_welcome_show
- widget_sggwidget
Sidebar Widgets 1
| ID | Name |
|---|---|
| sggwidget | Gallery by Supsystic Widget |
PHP Error Log 13 lines
[13-Jul-2022 14:19:07 UTC] [ Base_MixpanelBase - line 76 ] : Using token: 6fe8d87bb7308ab9accf8ac8c04ac962
[13-Jul-2022 14:19:07 UTC] [ Base_MixpanelBase - line 173 ] : Using consumer: curl -> ConsumerStrategies_CurlConsumer
[13-Jul-2022 14:19:07 UTC] [ Base_MixpanelBase - line 18 ] : Instantiated new Consumer
[13-Jul-2022 14:19:07 UTC] [ Base_MixpanelBase - line 194 ] : Queued message: {"event":"Welcome Show","properties":{"mp_lib":"php","token":"6fe8d87bb7308ab9accf8ac8c04ac962","time":1657721947}}
[13-Jul-2022 14:19:07 UTC] [ Base_MixpanelBase - line 94 ] : destruct flush attempt #1
[13-Jul-2022 14:19:07 UTC] [ Base_MixpanelBase - line 111 ] : Flush called - queue size: 1
[13-Jul-2022 14:19:07 UTC] [ Base_MixpanelBase - line 107 ] : Making blocking cURL call to https://api.mixpanel.com/track
[13-Jul-2022 14:19:07 UTC] [ Base_MixpanelBase - line 133 ] : Batch of 1 consumed, queue size is now 0
[13-Jul-2022 14:19:07 UTC] [ Base_MixpanelBase - line 94 ] : destruct flush attempt #1
[13-Jul-2022 14:19:07 UTC] [ Base_MixpanelBase - line 111 ] : Flush called - queue size: 0