Photo Gallery by Supsystic 1.15.24
Does Photo Gallery by Supsystic work with WordPress 6.6.2 and PHP 8.1.12? A smoke test was performed on .
Summary
| 13 | Unrecognized messages in the PHP error log |
| No JavaScript exceptions | |
| All test pages loaded successfully | |
| No resource errors |
Memory usage: 260.9 KiB
The average PHP memory usage increased by this amount after activating by the plugin.
Page speed impact:
0.095 seconds
The average page load time increased by this amount after activating the plugin.
| WordPress version | 6.6.2 |
|---|---|
| PHP version | 8.1.12 |
| MySQL version | 10.6.10 |
| PHP memory limit | 512M |
| Last updated | |
|---|---|
| Active installs | 30,000+ |
| WordPress.org page | https://wordpress.org/plugins/gallery-by-supsystic/ |
| Badges |
|
Pages 9
Plugins ‹ Test site — WordPress

| URL | /wp-admin/plugins.php?plugin_status=all&paged=1&s |
|---|---|
| Requested URL | /wp-admin/plugins.php?action=activate&plugin=gallery-by-supsystic%2Findex.php&plugin_status=all&paged=1&s&_wpnonce=ca2f53d15a |
| Aspect | after-activation |
| HTTP status | 200 |
| Load time | 0.721 s |
| Memory usage | 3.88 MiB |
| JS errors | None |
| Resource errors | None |
Photo Gallery by Supsystic
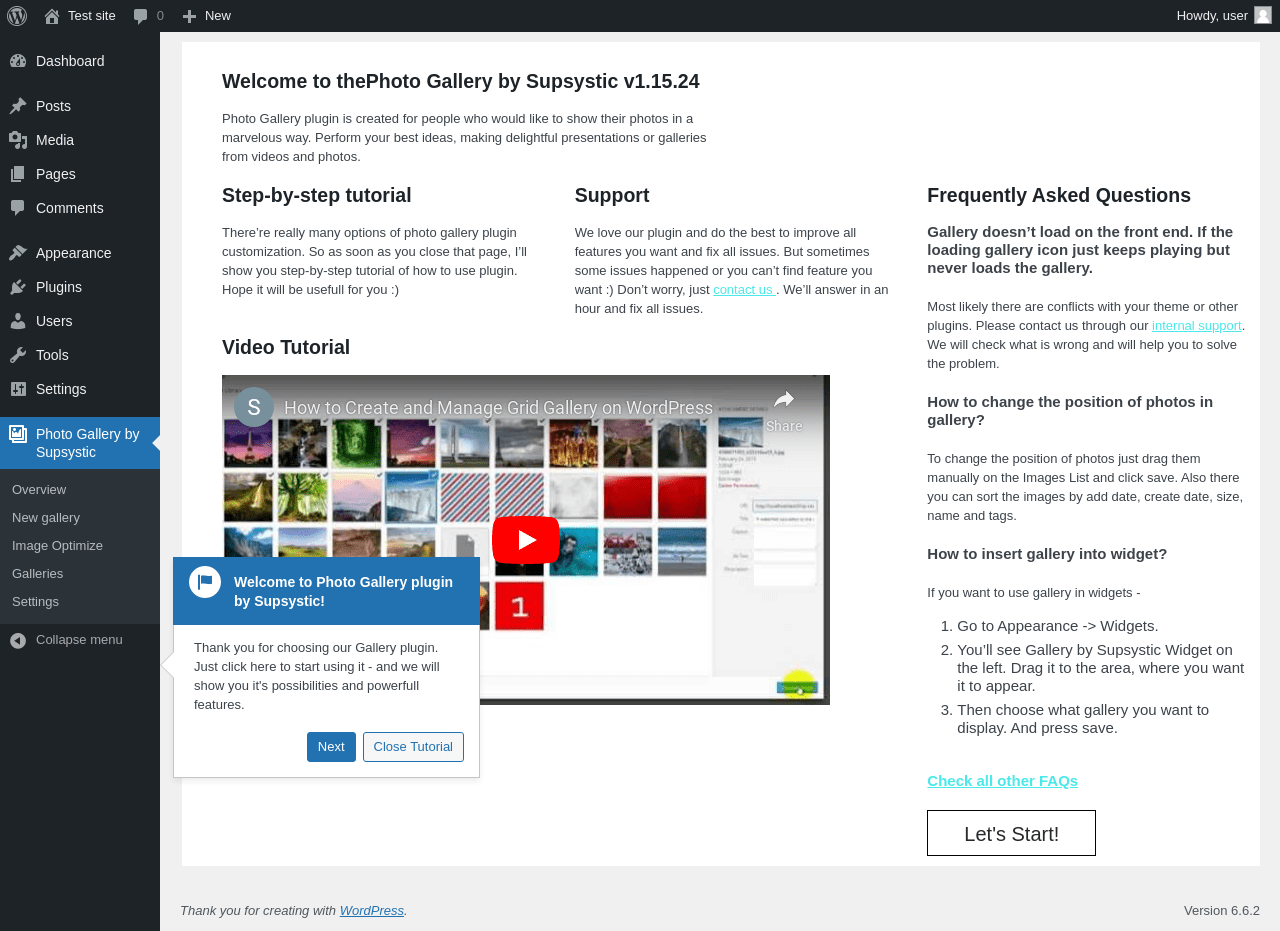
| URL | /wp-admin/admin.php?page=supsystic-gallery&module=promo&action=welcome |
|---|---|
| Requested URL | /wp-admin/admin.php?page=supsystic-gallery |
| Aspect | menu-item |
| HTTP status | 200 |
| Load time | 2.469 s |
| Memory usage | 4.38 MiB |
| JS errors | None |
| Resource errors | None |
Photo Gallery by Supsystic → Overview

| URL | /wp-admin/admin.php?page=supsystic-gallery&module=overview |
|---|---|
| Aspect | menu-item |
| HTTP status | 200 |
| Load time | 4.231 s |
| Memory usage | 6.01 MiB |
| JS errors | None |
| Resource errors | None |
Photo Gallery by Supsystic → New gallery
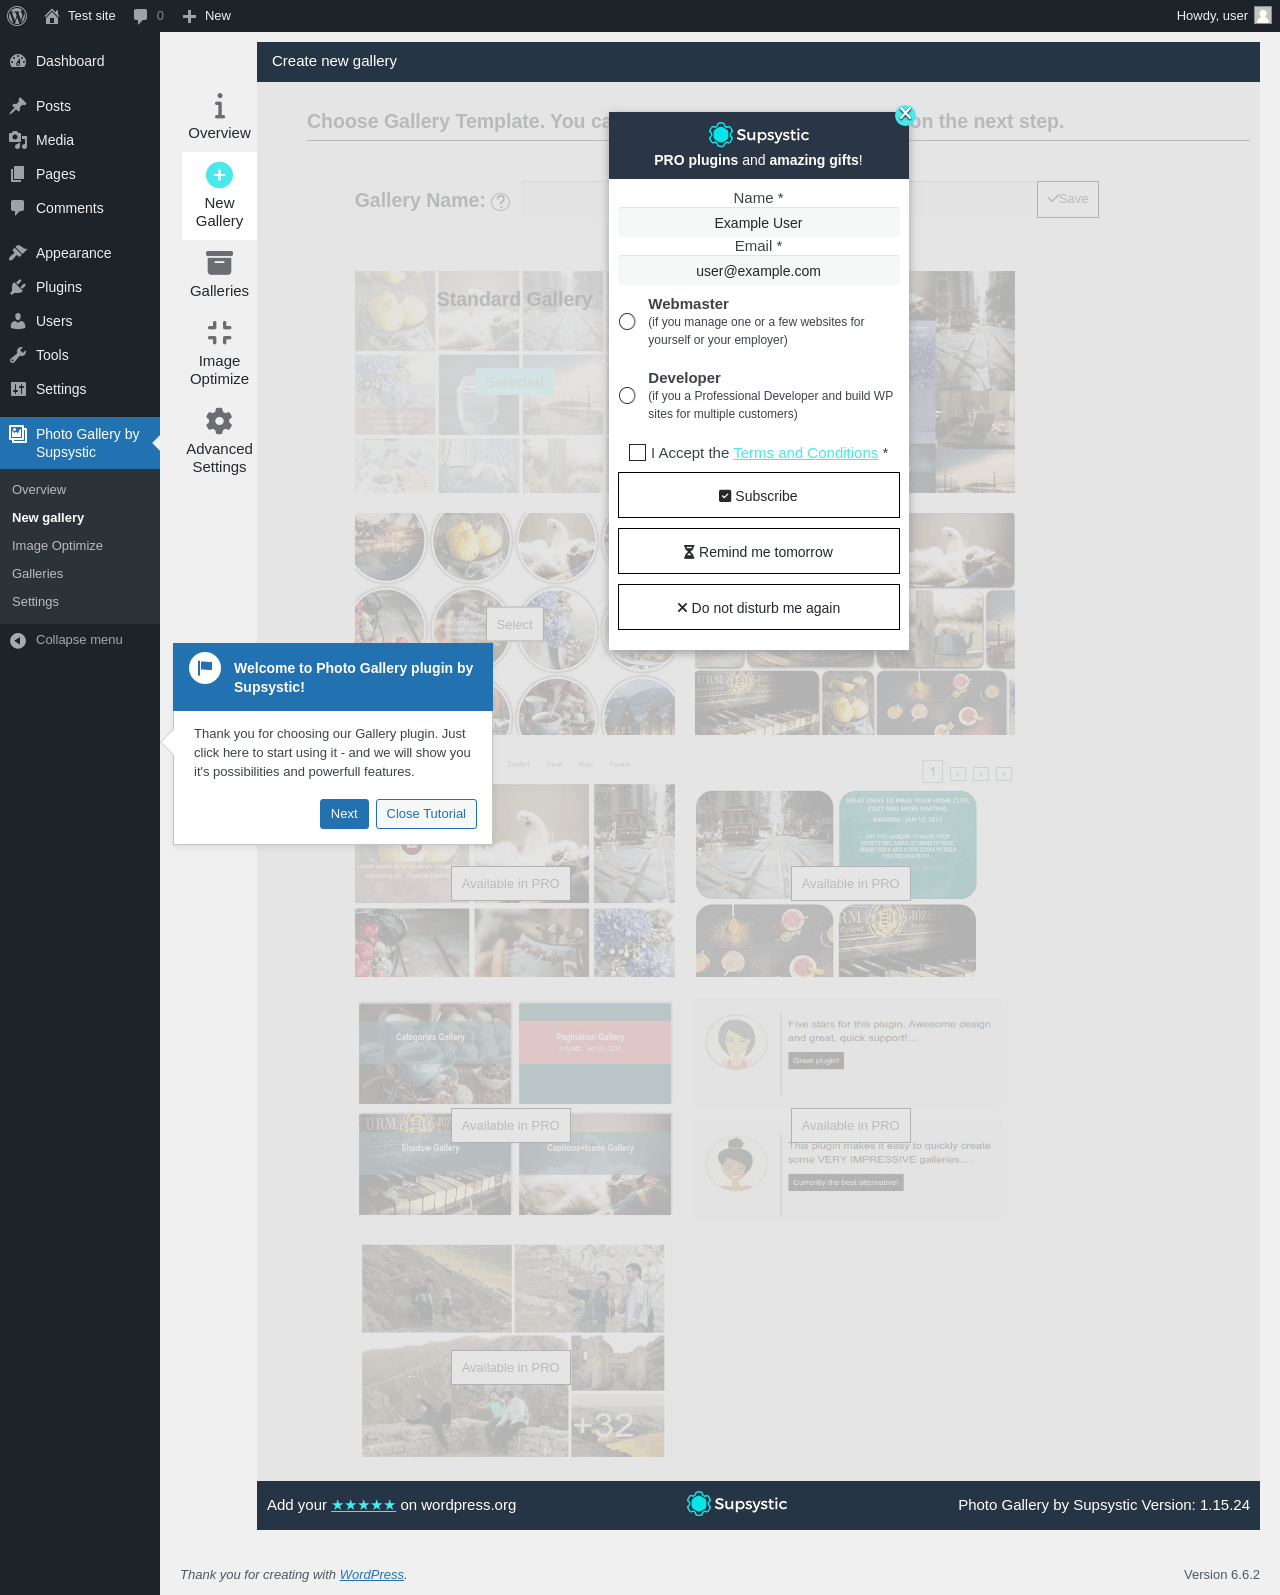
| URL | /wp-admin/admin.php?page=supsystic-gallery&module=galleries&action=showPresets |
|---|---|
| Aspect | menu-item |
| HTTP status | 200 |
| Load time | 1.142 s |
| Memory usage | 4.39 MiB |
| JS errors | None |
| Resource errors | None |
Photo Gallery by Supsystic → Image Optimize

| URL | /wp-admin/admin.php?page=supsystic-gallery&module=optimization |
|---|---|
| Aspect | menu-item |
| HTTP status | 200 |
| Load time | 0.557 s |
| Memory usage | 6.93 MiB |
| JS errors | None |
| Resource errors | None |
Photo Gallery by Supsystic → Galleries

| URL | /wp-admin/admin.php?page=supsystic-gallery&module=galleries |
|---|---|
| Aspect | menu-item |
| HTTP status | 200 |
| Load time | 0.684 s |
| Memory usage | 5.46 MiB |
| JS errors | None |
| Resource errors | None |
Photo Gallery by Supsystic → Settings

| URL | /wp-admin/admin.php?page=supsystic-gallery&module=settings |
|---|---|
| Aspect | menu-item |
| HTTP status | 200 |
| Load time | 0.541 s |
| Memory usage | 4.28 MiB |
| JS errors | None |
| Resource errors | None |
Test site – Just another WordPress site

| URL | / |
|---|---|
| Aspect | front-page |
| HTTP status | 200 |
| Load time | 0.282 s |
| Memory usage | 3.58 MiB |
| JS errors | None |
| Resource errors | None |
Widgets ‹ Test site — WordPress

| URL | /wp-admin/widgets.php |
|---|---|
| Aspect | new-sidebar-widgets |
| HTTP status | 200 |
| Load time | 2.406 s |
| Memory usage | 5.83 MiB |
| JS errors | None |
| Resource errors | None |
Benchmark
| URL | Load time | Memory usage | ||||
|---|---|---|---|---|---|---|
| Inactive | Active | Change | Inactive | Active | Change | |
| /wp-admin/index.php | 0.364 s | 0.573 s | +0.209 s | 3.47 MiB | 3.78 MiB | + 311.62 KiB |
| /wp-admin/edit.php | 0.290 s | 0.403 s | +0.113 s | 3.54 MiB | 3.81 MiB | + 277.06 KiB |
| /wp-admin/post-new.php | 0.825 s | 1.022 s | +0.197 s | 5.75 MiB | 6.01 MiB | + 260.99 KiB |
| /wp-admin/upload.php | 0.651 s | 0.588 s | -0.063 s | 3.49 MiB | 3.71 MiB | + 223 KiB |
| /wp-admin/options-writing.php | 0.256 s | 0.410 s | +0.154 s | 3.41 MiB | 3.7 MiB | + 299.75 KiB |
| /wp-admin/media-new.php | 0.264 s | 0.393 s | +0.129 s | 3.4 MiB | 3.7 MiB | + 313.14 KiB |
| /wp-admin/edit-tags.php?taxonomy=category | 0.250 s | 0.349 s | +0.099 s | 3.47 MiB | 3.72 MiB | + 255.05 KiB |
| /wp-admin/post-new.php?post_type=page | 0.640 s | 0.692 s | +0.052 s | 5.75 MiB | 6 MiB | + 256.58 KiB |
| /wp-admin/options-discussion.php | 0.495 s | 0.644 s | +0.149 s | 3.41 MiB | 3.7 MiB | + 302.06 KiB |
| /wp-admin/edit-comments.php | 0.255 s | 0.359 s | +0.104 s | 3.49 MiB | 3.72 MiB | + 237.75 KiB |
| / | 0.339 s | 0.238 s | -0.101 s | 3.45 MiB | 3.58 MiB | + 132.92 KiB |
| Average | 0.421 s | 0.516 s | +0.095 s | 3.88 MiB | 4.13 MiB | + 260.9 KiB |
Code Statistics
Note: Third-party libraries and minified JS/CSS files are excluded from these statistics where possible, so the numbers you see here may be lower than those reported by other tools.
| Language | % | Lines of code | Comment lines | Files | |
|---|---|---|---|---|---|
| PO File | 37.6% | 26,414 | 2,663 | 19 | |
| JavaScript | 22.0% | 15,448 | 1,688 | 88 | |
| PHP | 16.2% | 11,424 | 3,523 | 88 | |
| CSS | 12.7% | 8,895 | 420 | 33 | |
| Twig | 11.5% | 8,066 | 227 | 57 | |
| JSON | 0.0% | 30 | 0 | 1 | |
| SVG | 0.0% | 29 | 0 | 1 | |
| Total | 70,306 | 8,521 | 287 | ||
PHP Code Analysis | More results »
| Lines of code | 10,627 |
|---|---|
| Total complexity | 2,113 |
| Median class complexity | 14.0 |
| Median method complexity | 2.0 |
| Most complex class | Mobile_Detect |
| Most complex function | Mobile_Detect::mobileGrade() |
| Classes | 79 |
|---|---|
| Methods | 705 |
| Functions | 2 |
Additions
Things that the plugin adds to the site. This section is not intended to be comprehensive. The test tool only looks for a few specific types of added content.
Database Tables 15
- wp_gg_attributes
- wp_gg_cdn
- wp_gg_folders
- wp_gg_galleries
- wp_gg_galleries_excluded
- wp_gg_galleries_resources
- wp_gg_image_optimize
- wp_gg_membership_presets
- wp_gg_photos
- wp_gg_photos_pos
- wp_gg_photos_settings
- wp_gg_settings_presets
- wp_gg_settings_sets
- wp_gg_stats
- wp_gg_tags
Options wp_options 5
- grid_gallery_last_version
- sg_plugin_version
- sg_welcome_page_was_showed
- sgg_plug_welcome_show
- widget_sggwidget
Sidebar Widgets 1
| ID | Name |
|---|---|
| sggwidget | Gallery by Supsystic Widget |
PHP Error Log 13 lines
[11-Sep-2024 01:14:23 UTC] [ Base_MixpanelBase - line 76 ] : Using token: 6fe8d87bb7308ab9accf8ac8c04ac962
[11-Sep-2024 01:14:23 UTC] [ Base_MixpanelBase - line 173 ] : Using consumer: curl -> ConsumerStrategies_CurlConsumer
[11-Sep-2024 01:14:23 UTC] [ Base_MixpanelBase - line 18 ] : Instantiated new Consumer
[11-Sep-2024 01:14:23 UTC] [ Base_MixpanelBase - line 194 ] : Queued message: {"event":"Welcome Show","properties":{"mp_lib":"php","token":"6fe8d87bb7308ab9accf8ac8c04ac962","time":1726017263}}
[11-Sep-2024 01:14:23 UTC] [ Base_MixpanelBase - line 94 ] : destruct flush attempt #1
[11-Sep-2024 01:14:23 UTC] [ Base_MixpanelBase - line 111 ] : Flush called - queue size: 1
[11-Sep-2024 01:14:23 UTC] [ Base_MixpanelBase - line 107 ] : Making blocking cURL call to https://api.mixpanel.com/track
[11-Sep-2024 01:14:23 UTC] [ Base_MixpanelBase - line 133 ] : Batch of 1 consumed, queue size is now 0
[11-Sep-2024 01:14:23 UTC] [ Base_MixpanelBase - line 94 ] : destruct flush attempt #1
[11-Sep-2024 01:14:23 UTC] [ Base_MixpanelBase - line 111 ] : Flush called - queue size: 0