Easy Charts 1.2.2
Does Easy Charts work with WordPress 6.5.2 and PHP 8.1.12? A smoke test was performed on .
Summary
| No PHP errors, warnings or notices | |
| No JavaScript exceptions | |
| All test pages loaded successfully | |
| No resource errors | |
| Looks good! No problems were detected. |
Memory usage: 41.61 KiB
The average PHP memory usage increased by this amount after activating by the plugin.
Page speed impact:
0.020 seconds
The average page load time increased by this amount after activating the plugin.
| WordPress version | 6.5.2 |
|---|---|
| PHP version | 8.1.12 |
| MySQL version | 10.6.10 |
| PHP memory limit | 512M |
| Last updated | |
|---|---|
| Active installs | 2,000+ |
| WordPress.org page | https://wordpress.org/plugins/easy-charts/ |
| Badges |
|
Pages 5
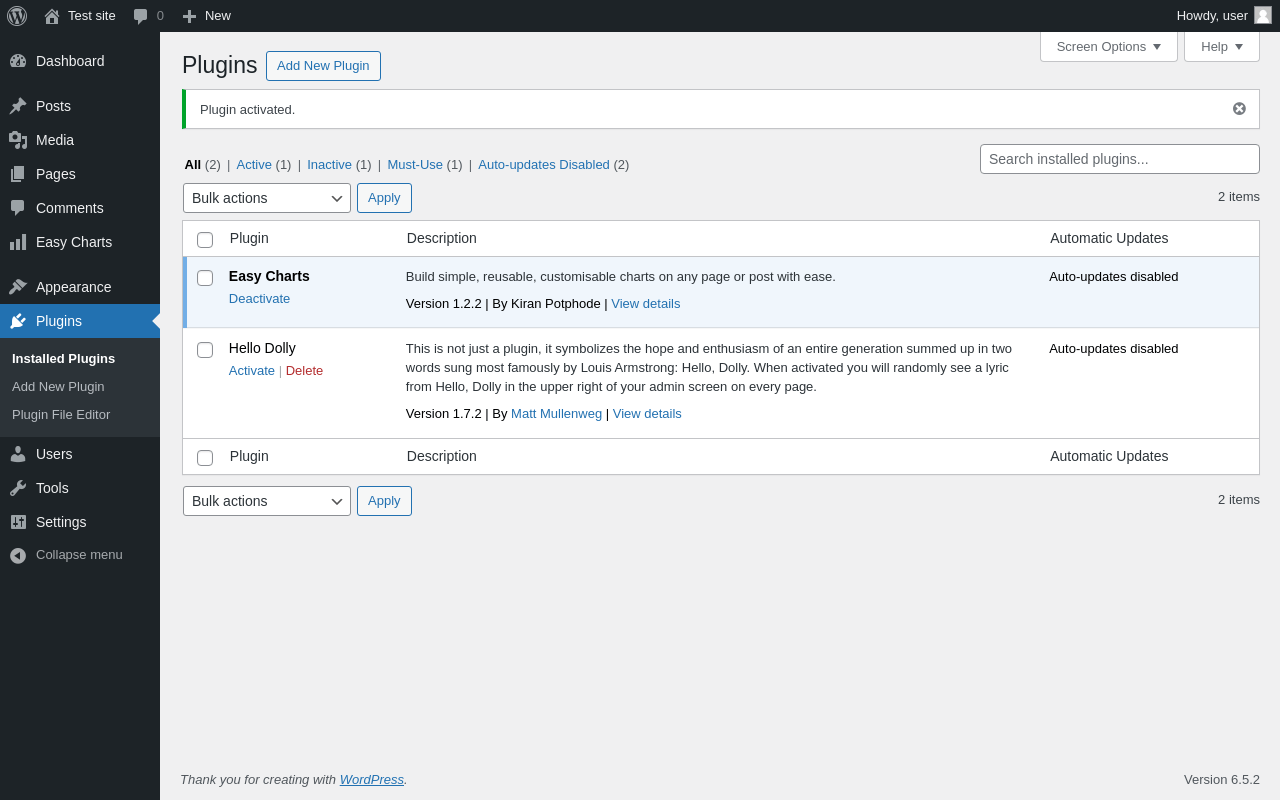
Plugins ‹ Test site — WordPress
| URL | /wp-admin/plugins.php?plugin_status=all&paged=1&s |
|---|---|
| Requested URL | /wp-admin/plugins.php?action=activate&plugin=easy-charts%2Feasy-charts.php&plugin_status=all&paged=1&s&_wpnonce=3815a1f239 |
| Aspect | after-activation |
| HTTP status | 200 |
| Load time | 0.266 s |
| Memory usage | 3.42 MiB |
| JS errors | None |
| Resource errors | None |
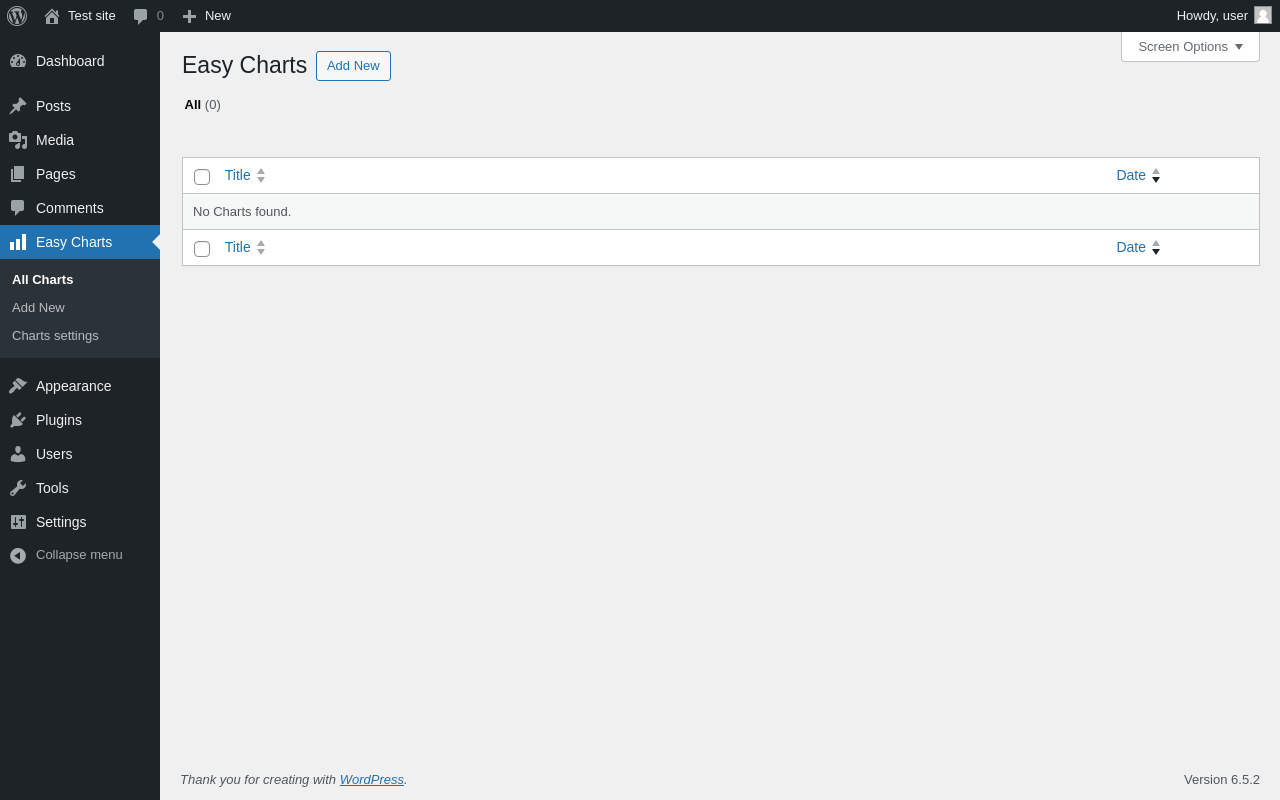
Easy Charts
| URL | /wp-admin/edit.php?post_type=easy_charts |
|---|---|
| Aspect | menu-item |
| HTTP status | 200 |
| Load time | 0.189 s |
| Memory usage | 3.45 MiB |
| JS errors | None |
| Resource errors | None |
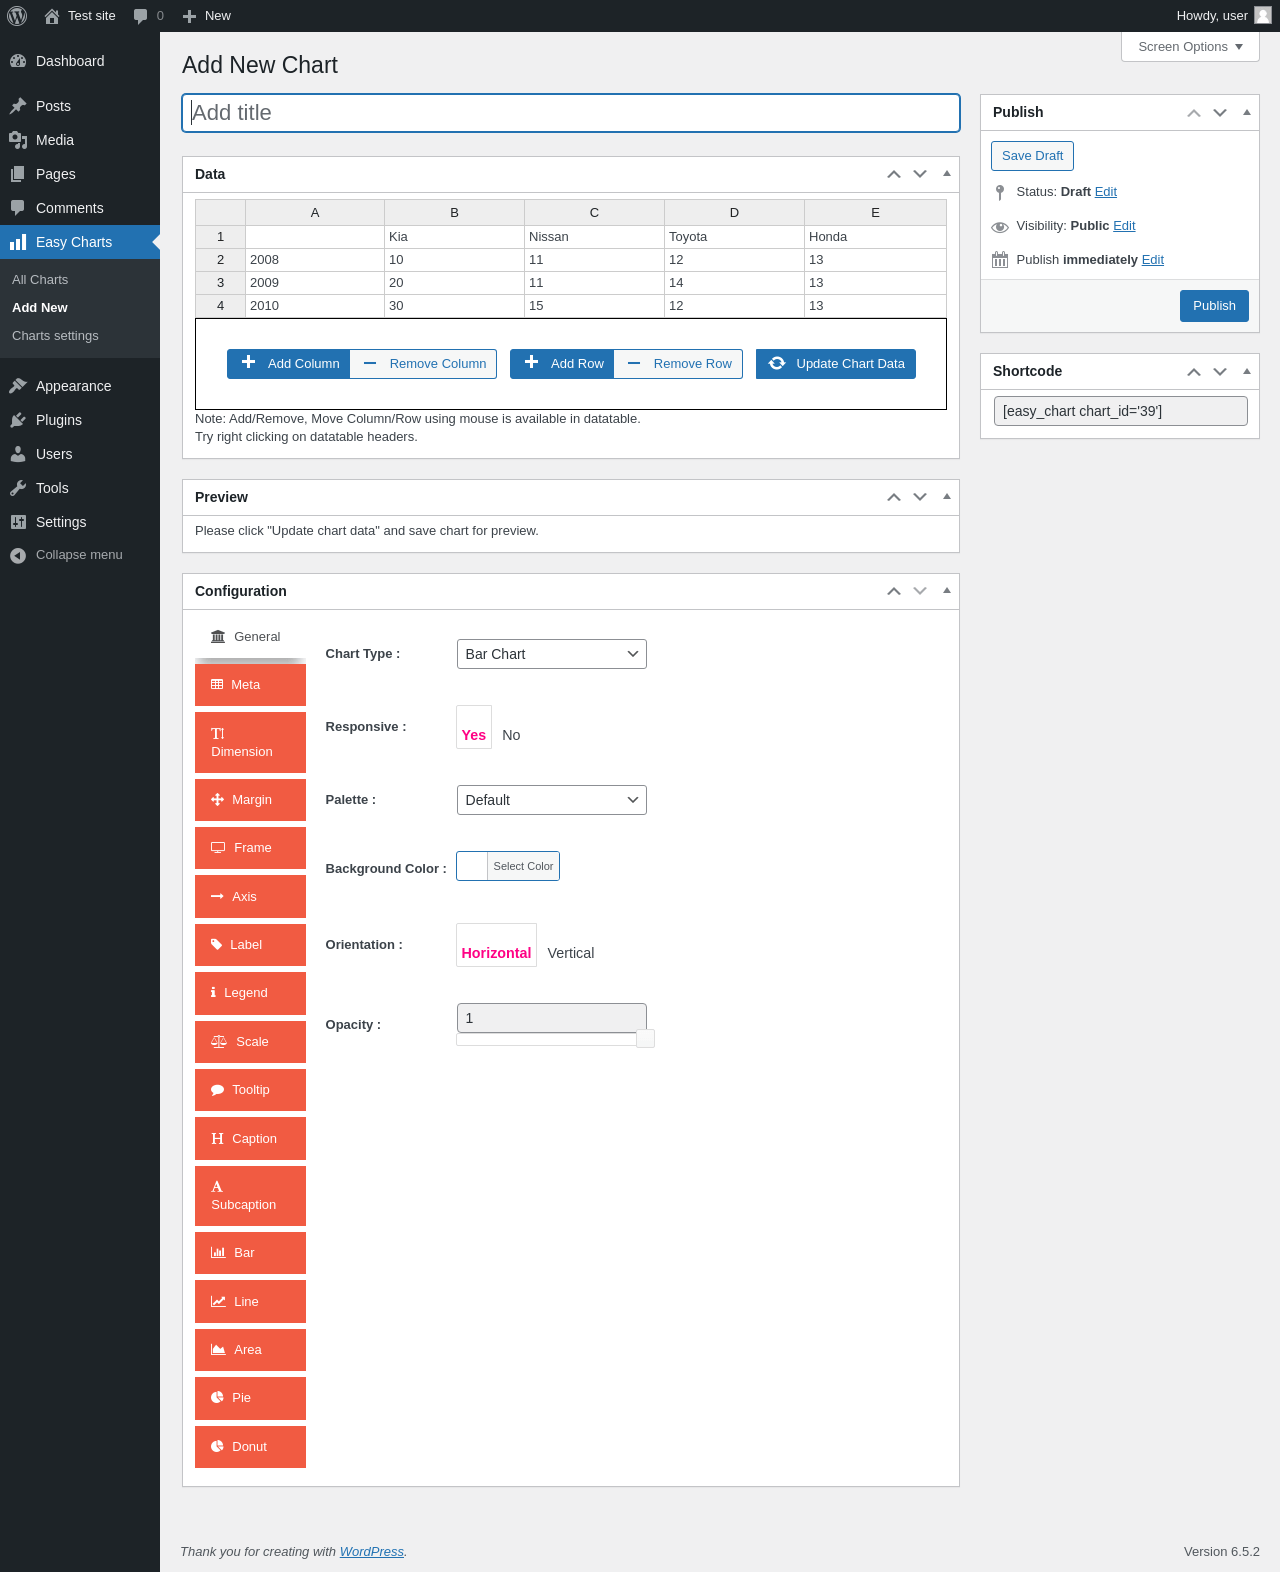
Easy Charts → Add New
| URL | /wp-admin/post-new.php?post_type=easy_charts |
|---|---|
| Aspect | menu-item |
| HTTP status | 200 |
| Load time | 0.757 s |
| Memory usage | 3.73 MiB |
| JS errors | None |
| Resource errors | None |
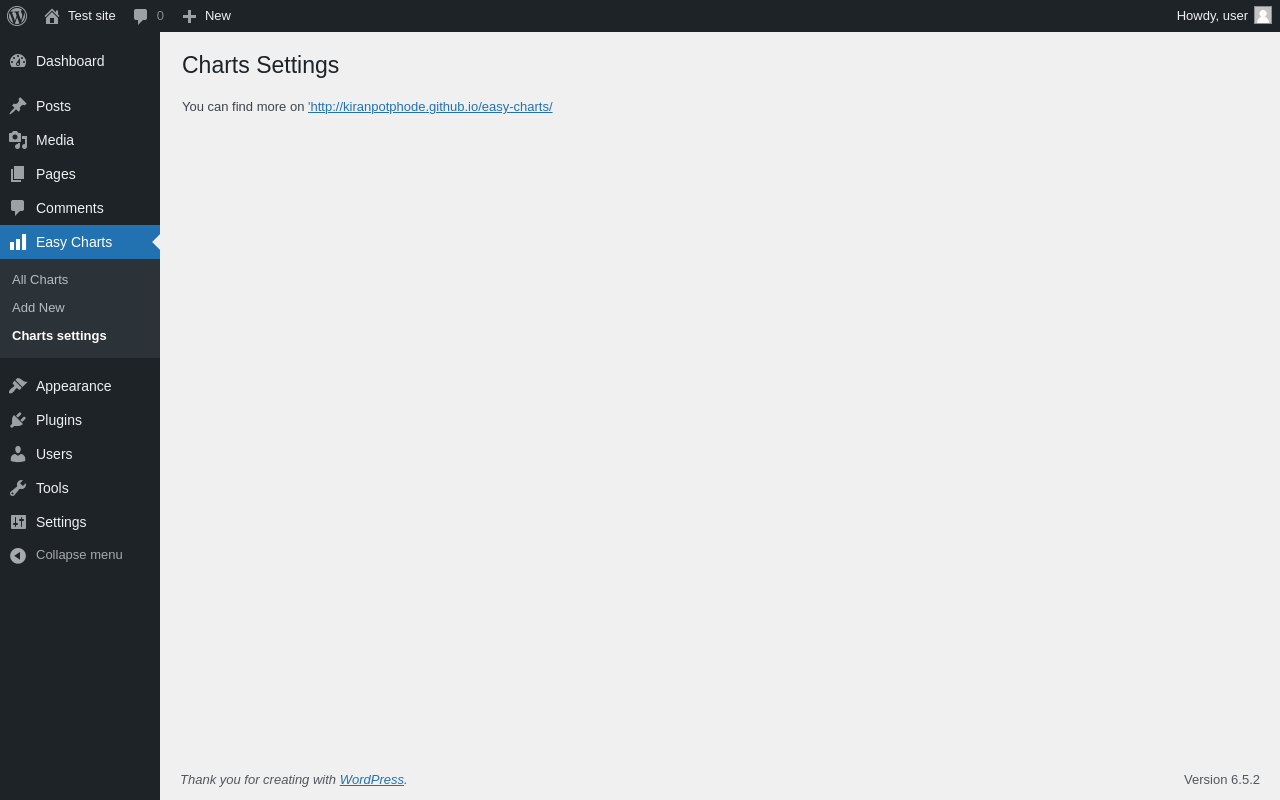
Easy Charts → Charts settings
| URL | /wp-admin/edit.php?post_type=easy_charts&page=easy-charts-settings |
|---|---|
| Aspect | menu-item |
| HTTP status | 200 |
| Load time | 0.203 s |
| Memory usage | 3.41 MiB |
| JS errors | None |
| Resource errors | None |
Test site – Just another WordPress site
| URL | / |
|---|---|
| Aspect | front-page |
| HTTP status | 200 |
| Load time | 0.187 s |
| Memory usage | 3.4 MiB |
| JS errors | None |
| Resource errors | None |
Benchmark
| URL | Load time | Memory usage | ||||
|---|---|---|---|---|---|---|
| Inactive | Active | Change | Inactive | Active | Change | |
| /wp-admin/index.php | 0.464 s | 0.329 s | -0.135 s | 3.44 MiB | 3.48 MiB | + 48.34 KiB |
| /wp-admin/edit.php | 0.230 s | 0.231 s | +0.001 s | 3.46 MiB | 3.51 MiB | + 48.7 KiB |
| /wp-admin/post-new.php | 0.930 s | 1.145 s | +0.215 s | 5.59 MiB | 5.67 MiB | + 83.9 KiB |
| /wp-admin/upload.php | 0.633 s | 0.556 s | -0.077 s | 3.38 MiB | 3.41 MiB | + 31.3 KiB |
| /wp-admin/options-writing.php | 0.241 s | 0.237 s | -0.004 s | 3.37 MiB | 3.4 MiB | + 23.26 KiB |
| /wp-admin/media-new.php | 0.326 s | 0.274 s | -0.052 s | 3.35 MiB | 3.39 MiB | + 43.48 KiB |
| /wp-admin/edit-tags.php?taxonomy=category | 0.202 s | 0.216 s | +0.014 s | 3.37 MiB | 3.42 MiB | + 48.66 KiB |
| /wp-admin/post-new.php?post_type=page | 0.585 s | 0.723 s | +0.138 s | 5.59 MiB | 5.66 MiB | + 79.48 KiB |
| /wp-admin/options-discussion.php | 0.295 s | 0.557 s | +0.262 s | 3.36 MiB | 3.39 MiB | + 31.79 KiB |
| /wp-admin/edit-comments.php | 0.259 s | 0.239 s | -0.020 s | 3.39 MiB | 3.42 MiB | + 31.29 KiB |
| / | 0.339 s | 0.221 s | -0.118 s | 3.42 MiB | 3.4 MiB | - 12.53 KiB |
| Average | 0.409 s | 0.430 s | +0.020 s | 3.79 MiB | 3.83 MiB | + 41.61 KiB |
Code Statistics
Note: Third-party libraries and minified JS/CSS files are excluded from these statistics where possible, so the numbers you see here may be lower than those reported by other tools.
| Language | % | Lines of code | Comment lines | Files | |
|---|---|---|---|---|---|
| JavaScript | 93.3% | 63,792 | 3,256 | 99 | |
| CSS | 3.3% | 2,277 | 261 | 8 | |
| PHP | 2.2% | 1,521 | 785 | 16 | |
| SVG | 1.0% | 655 | 0 | 1 | |
| Sass | 0.1% | 102 | 0 | 1 | |
| Markdown | 0.0% | 24 | 0 | 1 | |
| Total | 68,371 | 4,302 | 126 | ||
PHP Code Analysis | More results »
| Lines of code | 1,040 |
|---|---|
| Total complexity | 141 |
| Median class complexity | 6.0 |
| Median method complexity | 1.0 |
| Most complex class | Easy_Charts |
| Most complex function | Easy_Charts::ec_get_chart_configuration() |
| Classes | 7 |
|---|---|
| Methods | 47 |
| Functions | 3 |
Additions
Things that the plugin adds to the site. This section is not intended to be comprehensive. The test tool only looks for a few specific types of added content.
Custom Post Types 1
| ID | Name |
|---|---|
| easy_charts | Easy Charts |
Meta Boxes
{
    "easy_charts": {
        "easy_charts_data_metabox": {
            "title": "Data",
            "context": "advanced"
        },
        "easy_charts_preview_metabox": {
            "title": "Preview",
            "context": "advanced"
        },
        "easy_charts_configuration_metabox": {
            "title": "Configuration",
            "context": "advanced"
        },
        "easy_charts_shortcode_metabox": {
            "title": "Shortcode",
            "context": "side"
        }
    }
}
PHP Error Log
The log file is empty.