DebugPress: Debugger in Popup report-debugpress-1706016626
Does "DebugPress: Popup debugger for WordPress" work with WordPress 6.4.2 and PHP 8.1.12? A smoke test was performed on .
Summary
| No PHP errors, warnings or notices | |
| No JavaScript exceptions | |
| All test pages loaded successfully | |
| No resource errors | |
| Looks good! No problems were detected. |
Memory usage: 119.35 KiB
The average PHP memory usage increased by this amount after activating by the plugin.
Page speed impact:
0.026 seconds
The average page load time increased by this amount after activating the plugin.
| WordPress version | 6.4.2 |
|---|---|
| PHP version | 8.1.12 |
| MySQL version | 10.6.10 |
| PHP memory limit | 512M |
| Last updated | |
|---|---|
| Active installs | 100+ |
| WordPress.org page | https://wordpress.org/plugins/debugpress/ |
| Badges |
|
Pages 11
Plugins ‹ Test site — WordPress
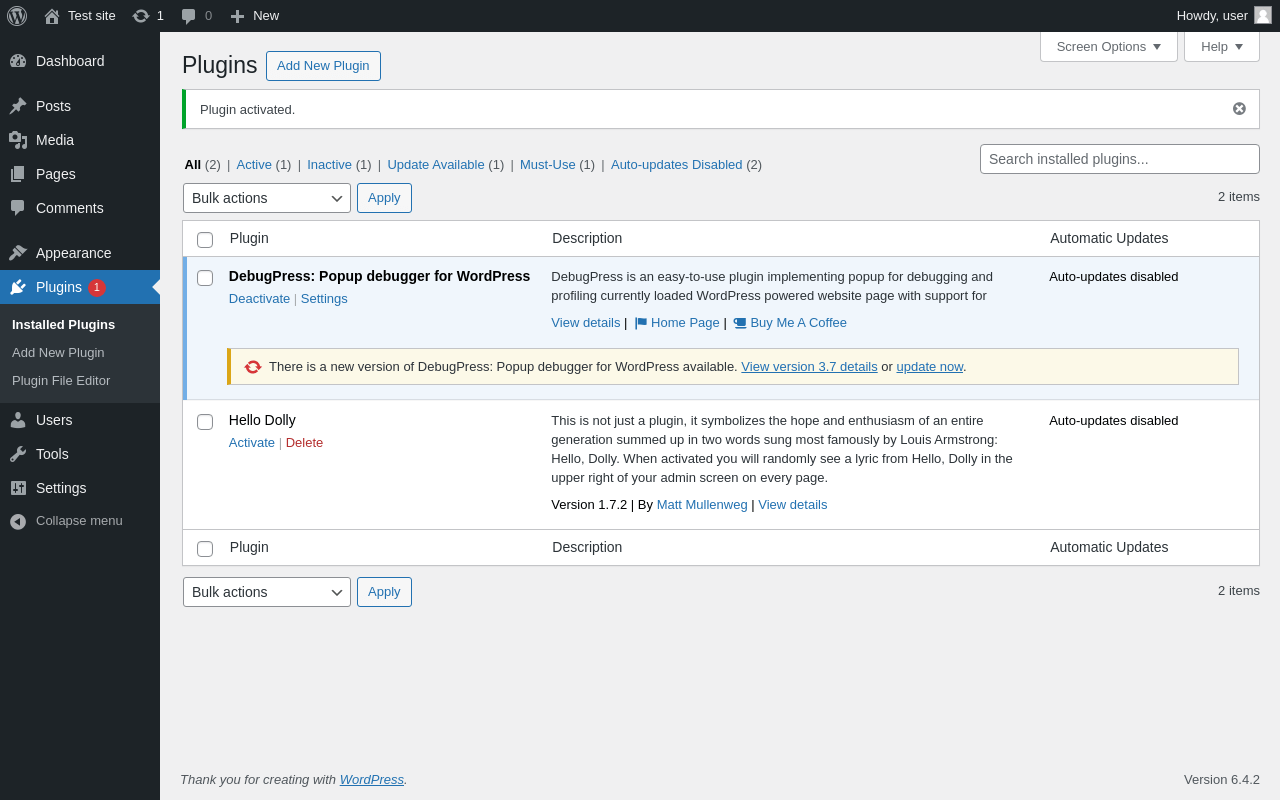
| URL | /wp-admin/plugins.php?plugin_status=all&paged=1&s |
|---|---|
| Requested URL | /wp-admin/plugins.php?action=activate&plugin=debugpress%2Fdebugpress.php&plugin_status=all&paged=1&s&_wpnonce=d4914b8f72 |
| Aspect | after-activation |
| HTTP status | 200 |
| Load time | 0.453 s |
| Memory usage | 3.52 MiB |
| JS errors | None |
| Resource errors | None |
Tools → DebugPress Info
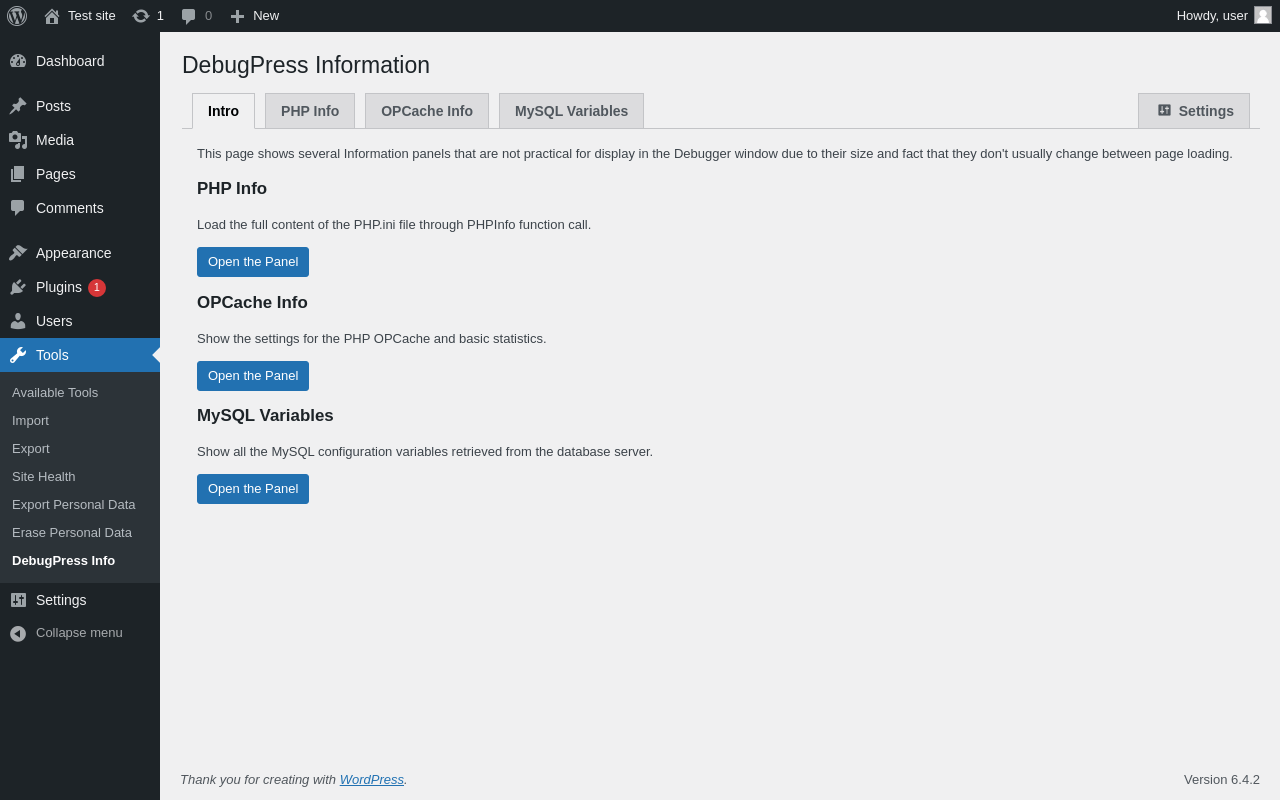
| URL | /wp-admin/tools.php?page=debugpress-info |
|---|---|
| Aspect | menu-item |
| HTTP status | 200 |
| Load time | 0.167 s |
| Memory usage | 3.73 MiB |
| JS errors | None |
| Resource errors | None |
Tools → DebugPress Info → PHP Info

| URL | /wp-admin/tools.php?page=debugpress-info&tab=php |
|---|---|
| Aspect | menu-item-tab |
| HTTP status | 200 |
| Load time | 0.374 s |
| Memory usage | 3.73 MiB |
| JS errors | None |
| Resource errors | None |
Tools → DebugPress Info → OPCache Info
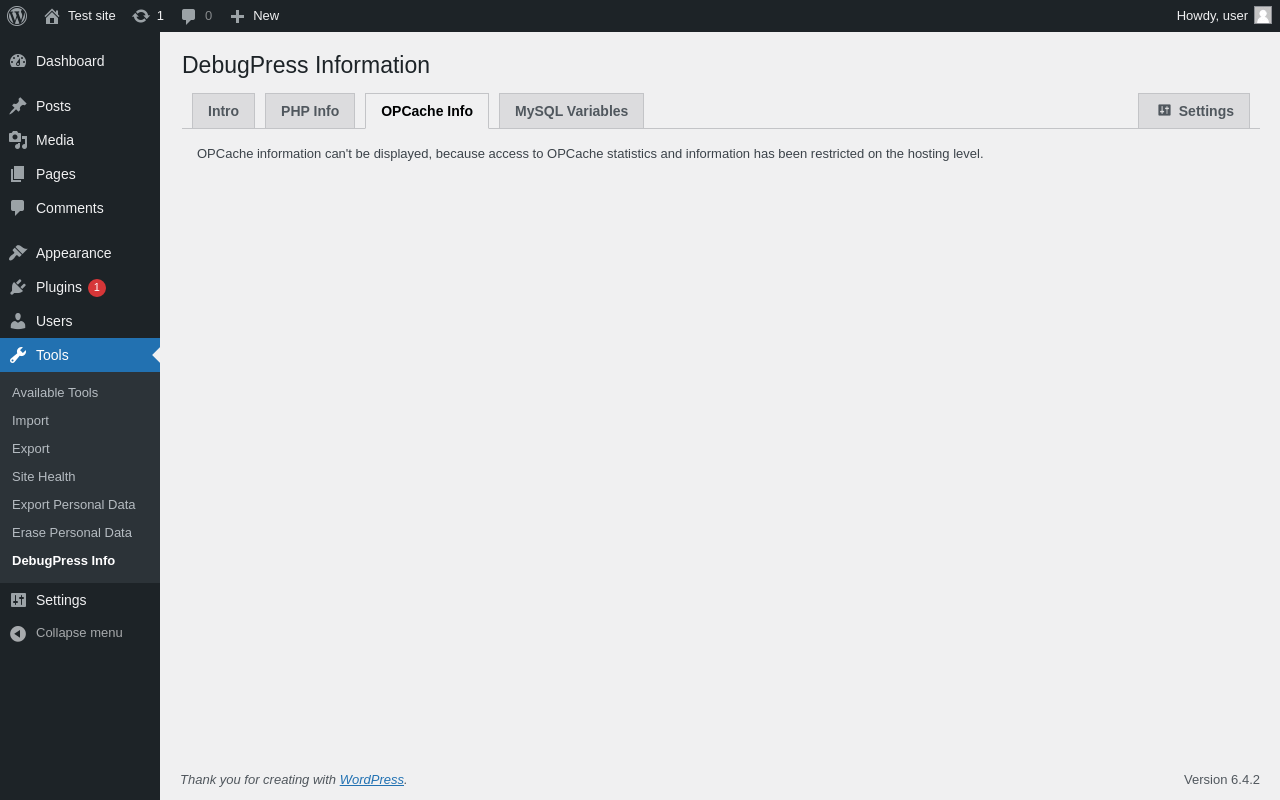
| URL | /wp-admin/tools.php?page=debugpress-info&tab=opcache |
|---|---|
| Aspect | menu-item-tab |
| HTTP status | 200 |
| Load time | 0.174 s |
| Memory usage | 3.73 MiB |
| JS errors | None |
| Resource errors | None |
Tools → DebugPress Info → MySQL Variables

| URL | /wp-admin/tools.php?page=debugpress-info&tab=mysql |
|---|---|
| Aspect | menu-item-tab |
| HTTP status | 200 |
| Load time | 0.315 s |
| Memory usage | 3.79 MiB |
| JS errors | None |
| Resource errors | None |
Settings → DebugPress
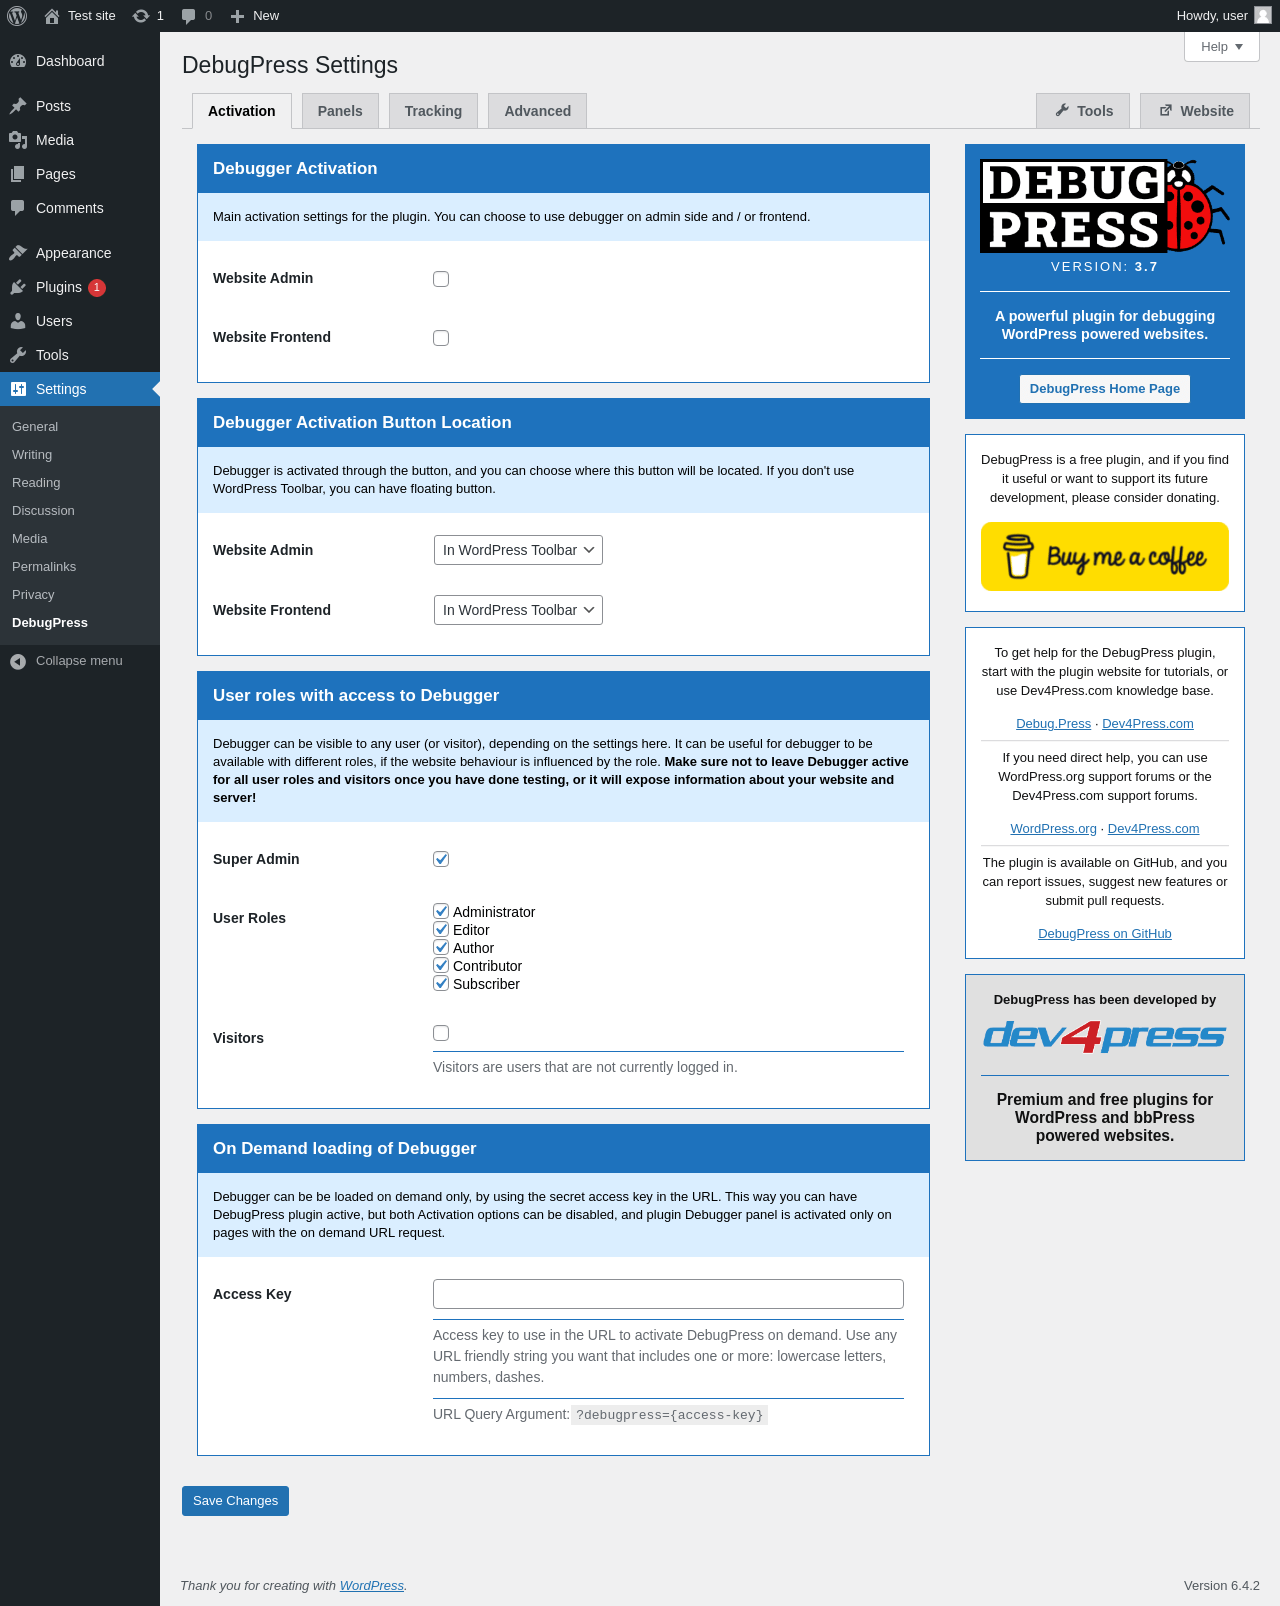
| URL | /wp-admin/options-general.php?page=debugpress |
|---|---|
| Aspect | menu-item |
| HTTP status | 200 |
| Load time | 0.254 s |
| Memory usage | 3.47 MiB |
| JS errors | None |
| Resource errors | None |
Settings → DebugPress → Panels
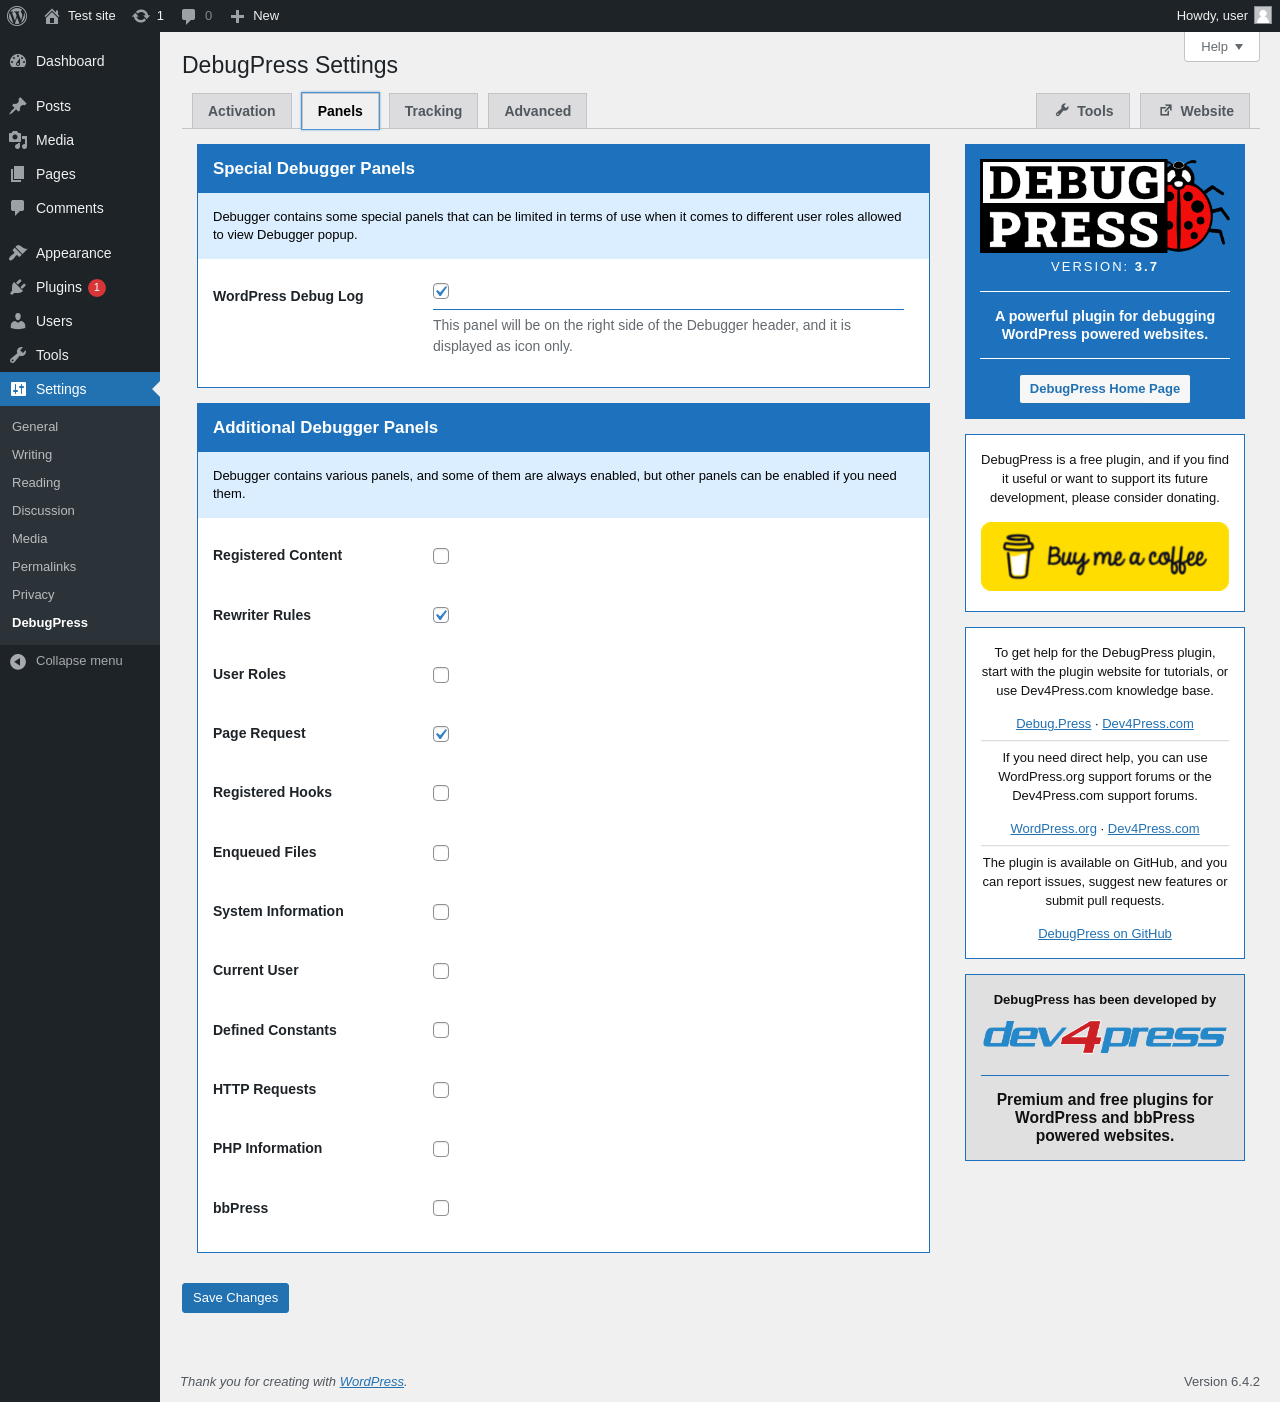
| URL | /wp-admin/options-general.php?page=debugpress |
|---|---|
| Aspect | menu-item-tab |
| HTTP status | 200 |
| Load time | 0.208 s |
| Memory usage | 3.42 MiB |
| JS errors | None |
| Resource errors | None |
Settings → DebugPress → Tracking
| URL | /wp-admin/options-general.php?page=debugpress |
|---|---|
| Aspect | menu-item-tab |
| HTTP status | 200 |
| Load time | 0.222 s |
| Memory usage | 3.42 MiB |
| JS errors | None |
| Resource errors | None |
Settings → DebugPress → Advanced
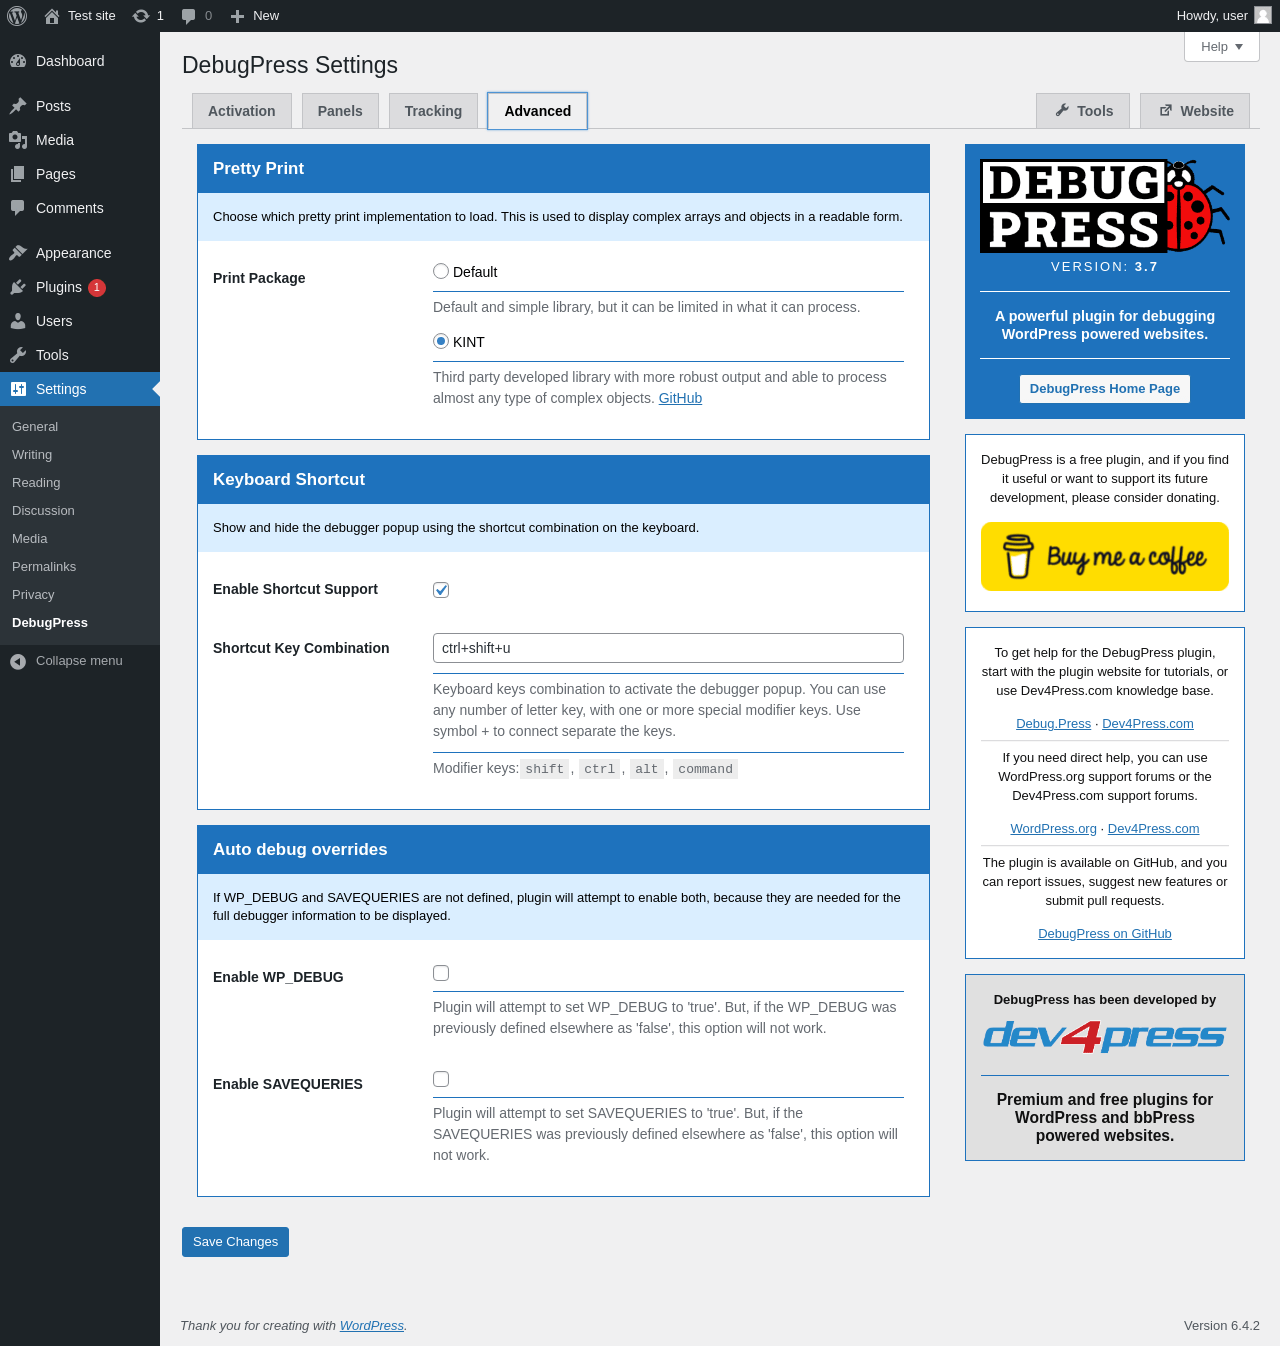
| URL | /wp-admin/options-general.php?page=debugpress |
|---|---|
| Aspect | menu-item-tab |
| HTTP status | 200 |
| Load time | 0.199 s |
| Memory usage | 3.42 MiB |
| JS errors | None |
| Resource errors | None |
Settings → DebugPress → Website
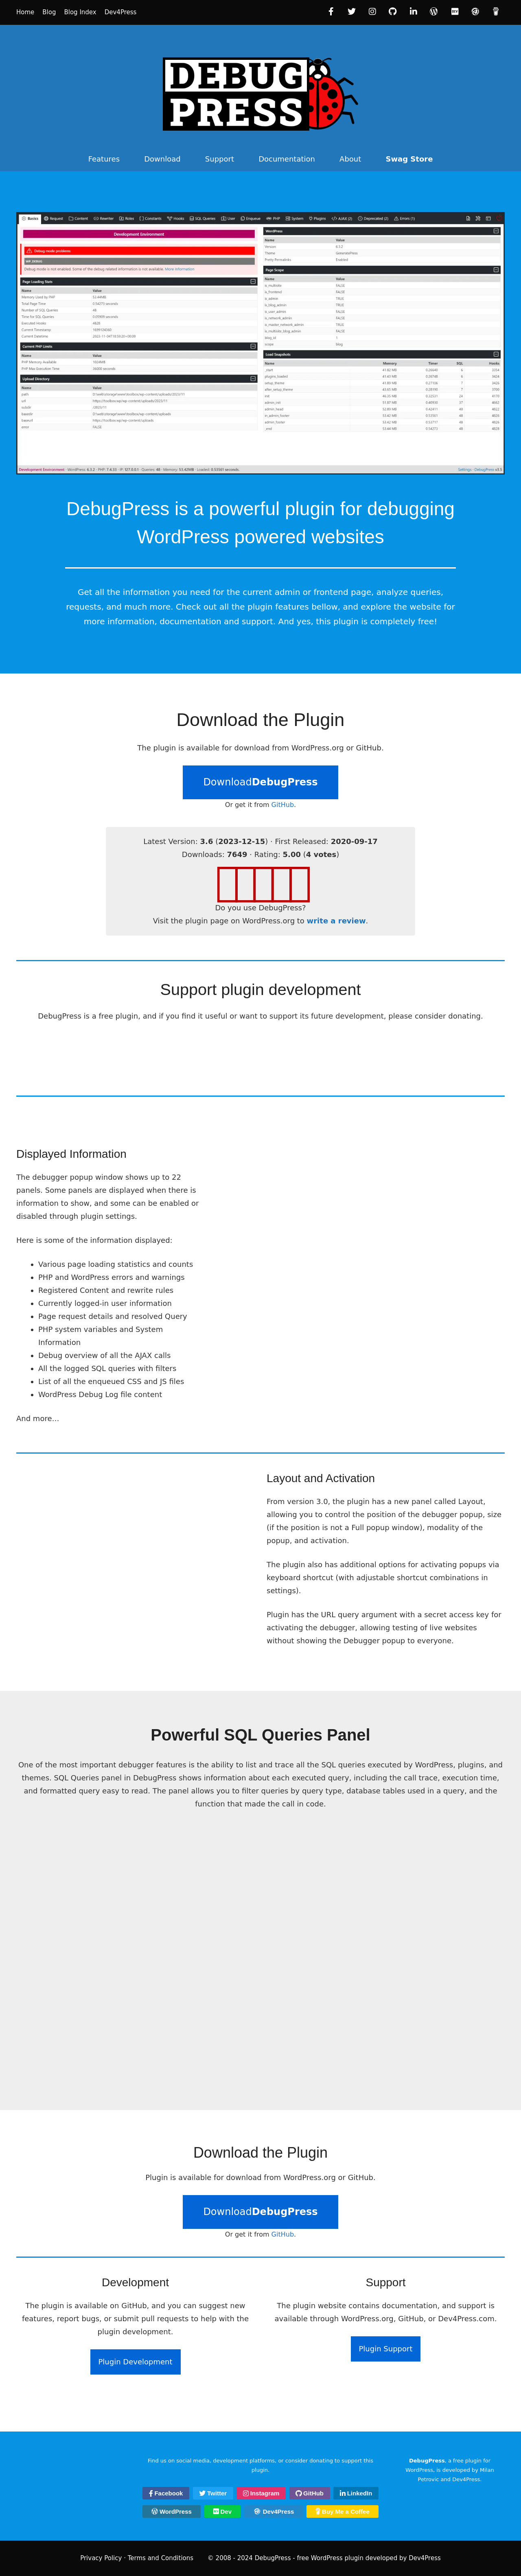
| URL | https://debug.press/ |
|---|---|
| Aspect | menu-item-tab |
| HTTP status | 200 |
| Load time | 0.699 s |
| Memory usage | N/A |
| JS errors | None |
| Resource errors | None |
Test site – Just another WordPress site
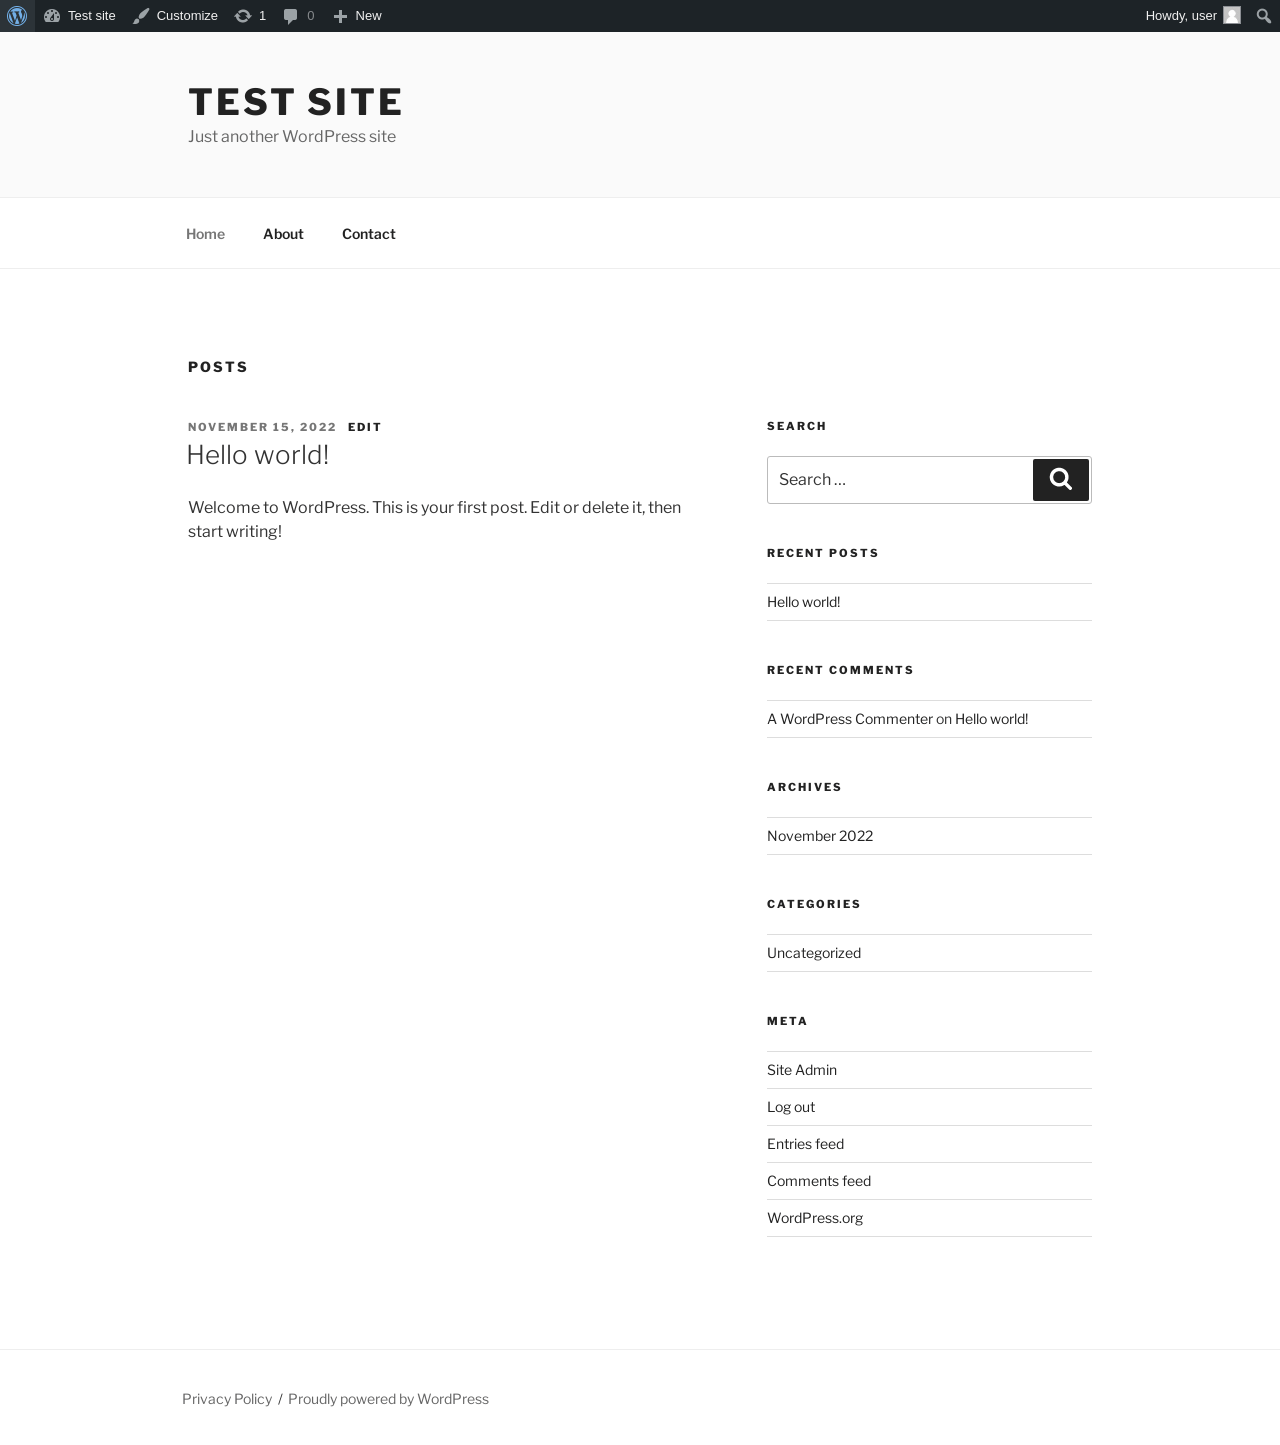
| URL | / |
|---|---|
| Aspect | front-page |
| HTTP status | 200 |
| Load time | 0.485 s |
| Memory usage | 3.37 MiB |
| JS errors | None |
| Resource errors | None |
Benchmark
| URL | Load time | Memory usage | ||||
|---|---|---|---|---|---|---|
| Inactive | Active | Change | Inactive | Active | Change | |
| /wp-admin/index.php | 0.388 s | 0.554 s | +0.166 s | 3.38 MiB | 3.52 MiB | + 137.92 KiB |
| /wp-admin/edit.php | 0.235 s | 0.266 s | +0.031 s | 3.41 MiB | 3.54 MiB | + 136.88 KiB |
| /wp-admin/post-new.php | 0.998 s | 1.032 s | +0.034 s | 5.46 MiB | 5.6 MiB | + 142.12 KiB |
| /wp-admin/upload.php | 0.589 s | 0.411 s | -0.178 s | 3.32 MiB | 3.44 MiB | + 119.95 KiB |
| /wp-admin/options-writing.php | 0.234 s | 0.230 s | -0.004 s | 3.32 MiB | 3.43 MiB | + 112.73 KiB |
| /wp-admin/media-new.php | 0.331 s | 0.586 s | +0.255 s | 3.3 MiB | 3.42 MiB | + 129.98 KiB |
| /wp-admin/edit-tags.php?taxonomy=category | 0.216 s | 0.387 s | +0.171 s | 3.31 MiB | 3.45 MiB | + 136.95 KiB |
| /wp-admin/post-new.php?post_type=page | 0.652 s | 0.651 s | -0.001 s | 5.45 MiB | 5.59 MiB | + 136.77 KiB |
| /wp-admin/options-discussion.php | 0.374 s | 0.295 s | -0.079 s | 3.3 MiB | 3.42 MiB | + 121.88 KiB |
| /wp-admin/edit-comments.php | 0.263 s | 0.251 s | -0.012 s | 3.34 MiB | 3.45 MiB | + 119.57 KiB |
| / | 0.302 s | 0.206 s | -0.096 s | 3.36 MiB | 3.38 MiB | + 18.08 KiB |
| Average | 0.417 s | 0.443 s | +0.026 s | 3.72 MiB | 3.84 MiB | + 119.35 KiB |
Code Statistics
Note: Third-party libraries and minified JS/CSS files are excluded from these statistics where possible, so the numbers you see here may be lower than those reported by other tools.
| Language | % | Lines of code | Comment lines | Files | |
|---|---|---|---|---|---|
| PHP | 65.8% | 7,432 | 421 | 82 | |
| Sass | 13.2% | 1,491 | 3 | 19 | |
| CSS | 12.6% | 1,427 | 5 | 3 | |
| JavaScript | 8.4% | 950 | 3 | 2 | |
| Total | 11,300 | 432 | 106 | ||
PHP Code Analysis | More results »
| Lines of code | 6,847 |
|---|---|
| Total complexity | 1,267 |
| Median class complexity | 11.0 |
| Median method complexity | 2.0 |
| Most complex class | Dev4Press\Plugin\DebugPress\Display\SQLFormat |
| Most complex function | Dev4Press\Plugin\DebugPress\Display\SQLFormat::format() |
| Classes | 43 |
|---|---|
| Methods | 386 |
| Functions | 25 |
Additions
Things that the plugin adds to the site. This section is not intended to be comprehensive. The test tool only looks for a few specific types of added content.
No new entries found.
PHP Error Log
The log file is empty.