DebugPress: Debugger in Popup 4.0
Does DebugPress: Debugger in Popup work with WordPress 6.8.1 and PHP 8.1.12? A smoke test was performed on .
Summary
| No PHP errors, warnings or notices | |
| No JavaScript exceptions | |
| All test pages loaded successfully | |
| No resource errors | |
| Looks good! No problems were detected. |
Memory usage: 123.66 KiB
The average PHP memory usage increased by this amount after activating by the plugin.
Page speed impact:
0.054 seconds
The average page load time increased by this amount after activating the plugin.
| WordPress version | 6.8.1 |
|---|---|
| PHP version | 8.1.12 |
| MySQL version | 10.6.10 |
| PHP memory limit | 512M |
| Last updated | |
|---|---|
| Active installs | 100+ |
| WordPress.org page | https://wordpress.org/plugins/debugpress/ |
| Badges |
|
Pages 11
Plugins ‹ Test site — WordPress
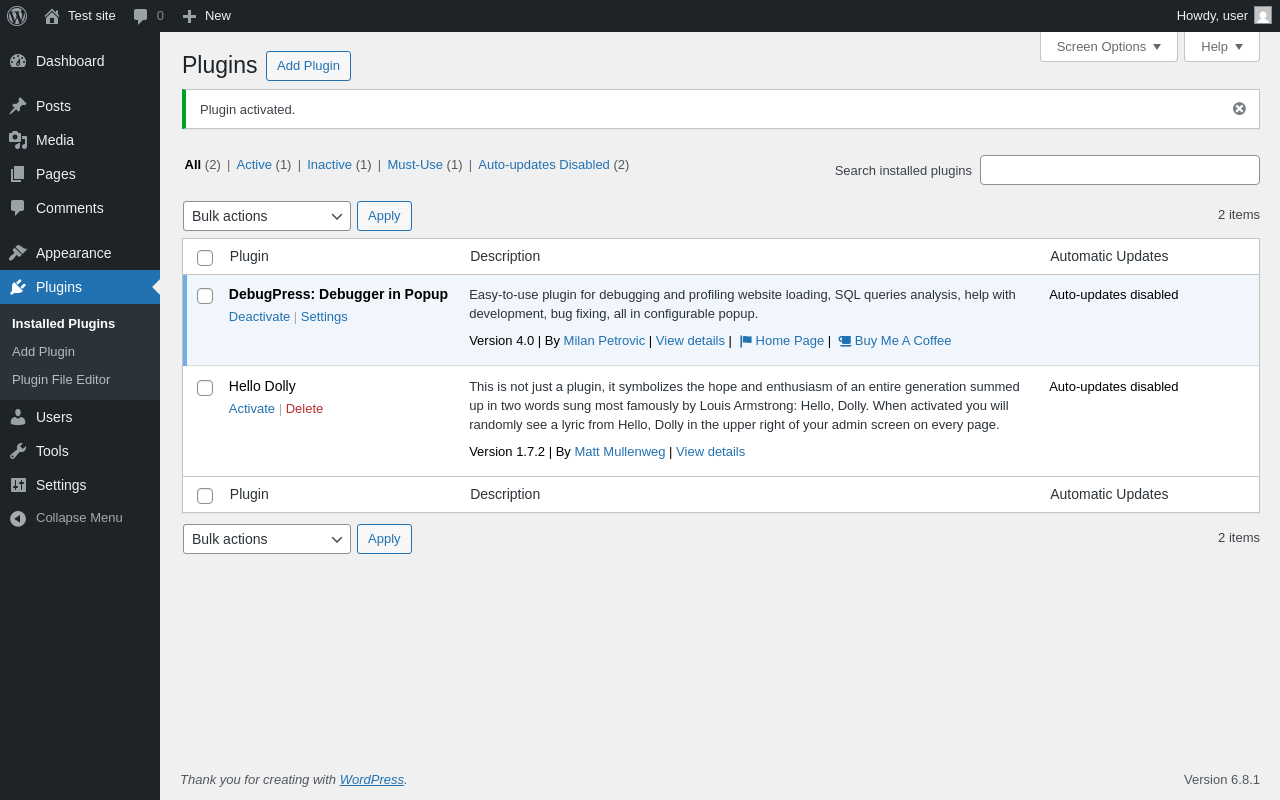
| URL | /wp-admin/plugins.php?plugin_status=all&paged=1&s |
|---|---|
| Requested URL | /wp-admin/plugins.php?action=activate&plugin=debugpress%2Fdebugpress.php&plugin_status=all&paged=1&s&_wpnonce=05dd1b83a9 |
| Aspect | after-activation |
| HTTP status | 200 |
| Load time | 0.316 s |
| Memory usage | 3.65 MiB |
| JS errors | None |
| Resource errors | None |
Tools → DebugPress Info
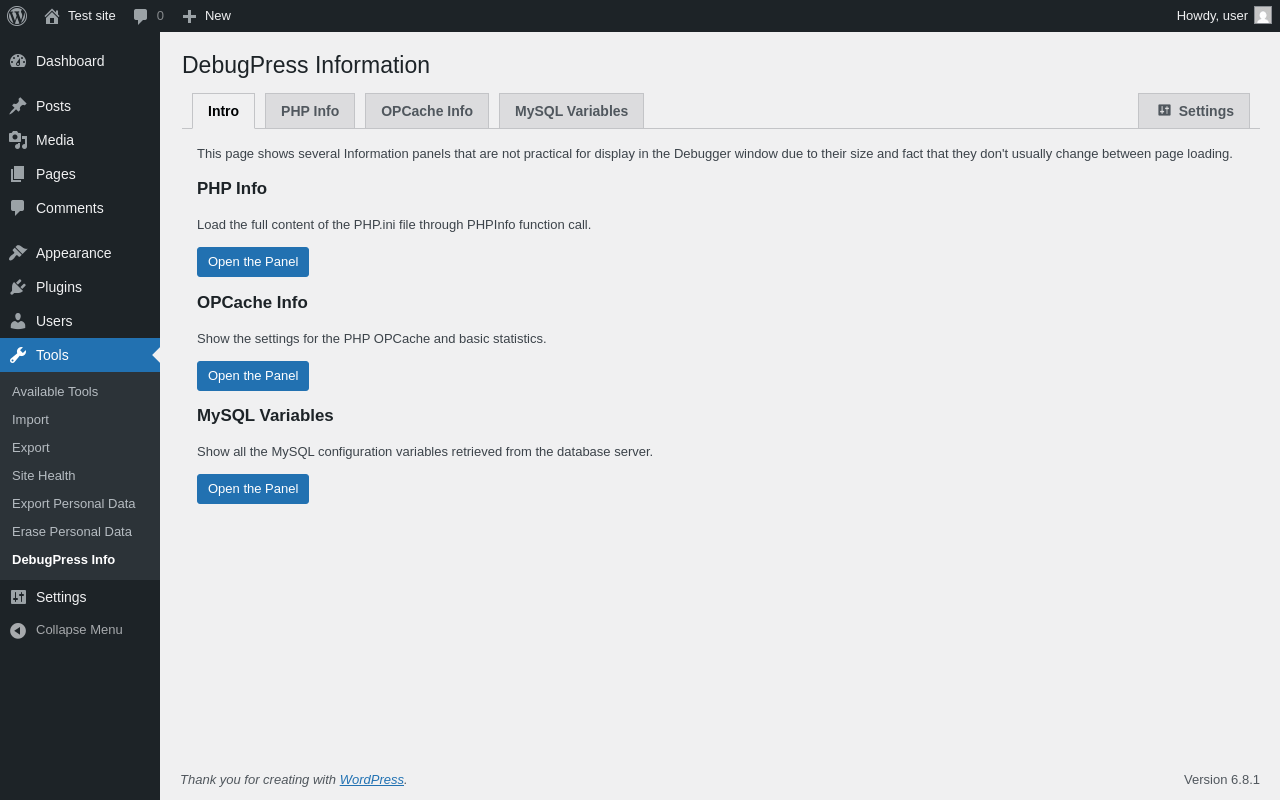
| URL | /wp-admin/tools.php?page=debugpress-info |
|---|---|
| Aspect | menu-item |
| HTTP status | 200 |
| Load time | 0.166 s |
| Memory usage | 3.9 MiB |
| JS errors | None |
| Resource errors | None |
Tools → DebugPress Info → PHP Info

| URL | /wp-admin/tools.php?page=debugpress-info&tab=php |
|---|---|
| Aspect | menu-item-tab |
| HTTP status | 200 |
| Load time | 0.423 s |
| Memory usage | 3.89 MiB |
| JS errors | None |
| Resource errors | None |
Tools → DebugPress Info → OPCache Info
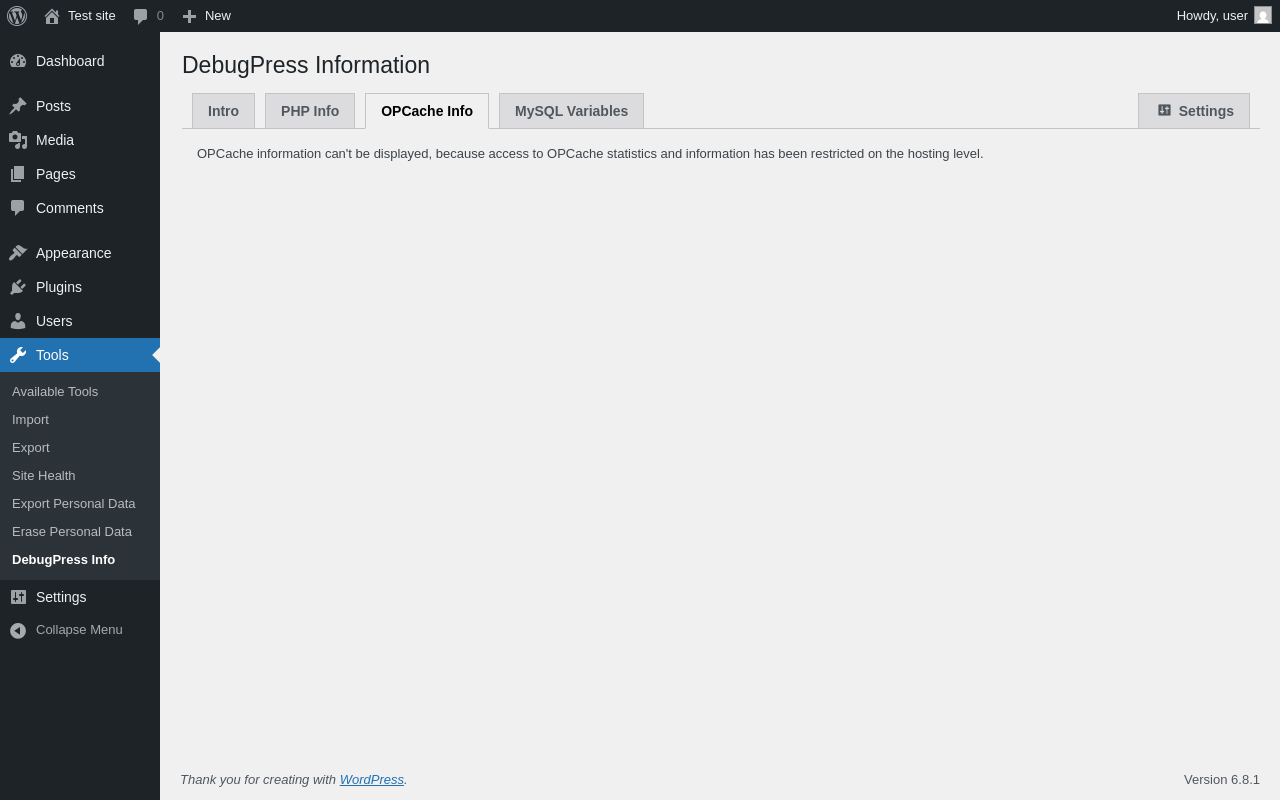
| URL | /wp-admin/tools.php?page=debugpress-info&tab=opcache |
|---|---|
| Aspect | menu-item-tab |
| HTTP status | 200 |
| Load time | 0.167 s |
| Memory usage | 3.89 MiB |
| JS errors | None |
| Resource errors | None |
Tools → DebugPress Info → MySQL Variables

| URL | /wp-admin/tools.php?page=debugpress-info&tab=mysql |
|---|---|
| Aspect | menu-item-tab |
| HTTP status | 200 |
| Load time | 0.295 s |
| Memory usage | 3.91 MiB |
| JS errors | None |
| Resource errors | None |
Settings → DebugPress
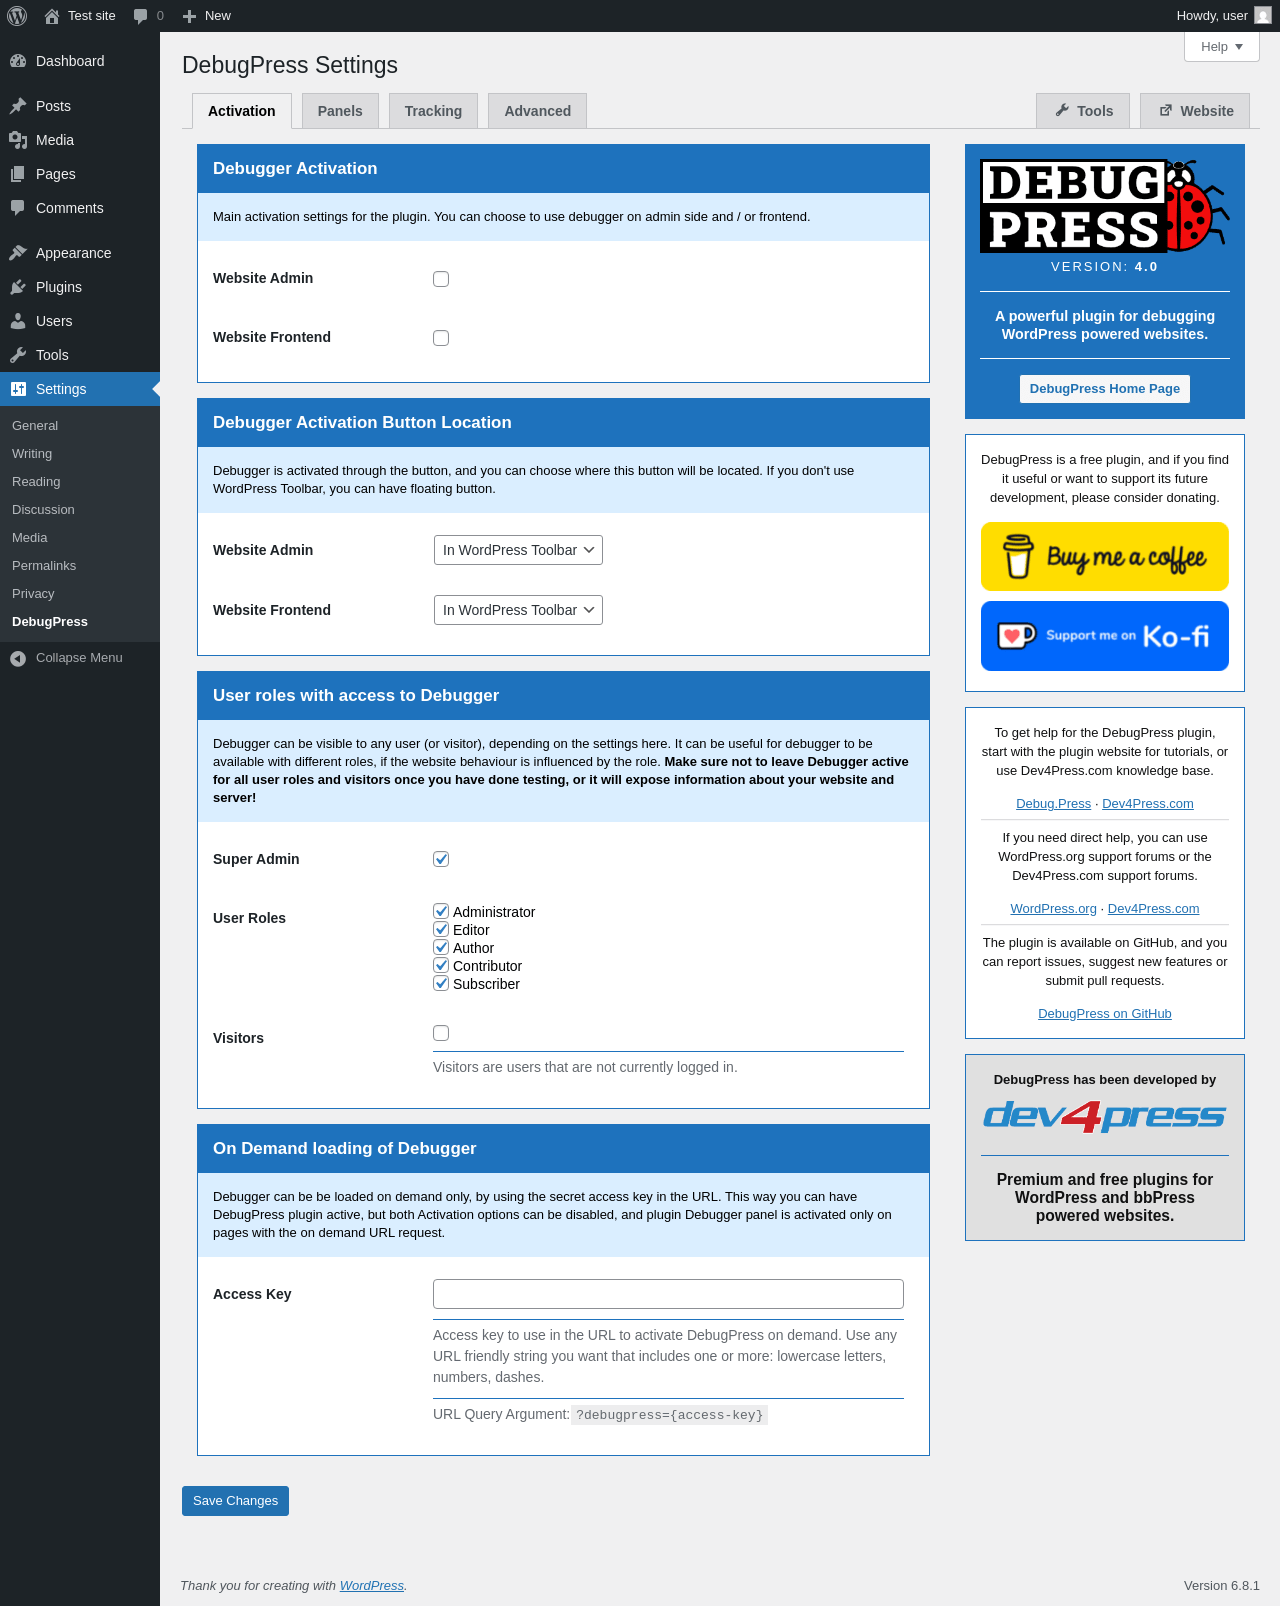
| URL | /wp-admin/options-general.php?page=debugpress |
|---|---|
| Aspect | menu-item |
| HTTP status | 200 |
| Load time | 0.261 s |
| Memory usage | 3.65 MiB |
| JS errors | None |
| Resource errors | None |
Settings → DebugPress → Panels
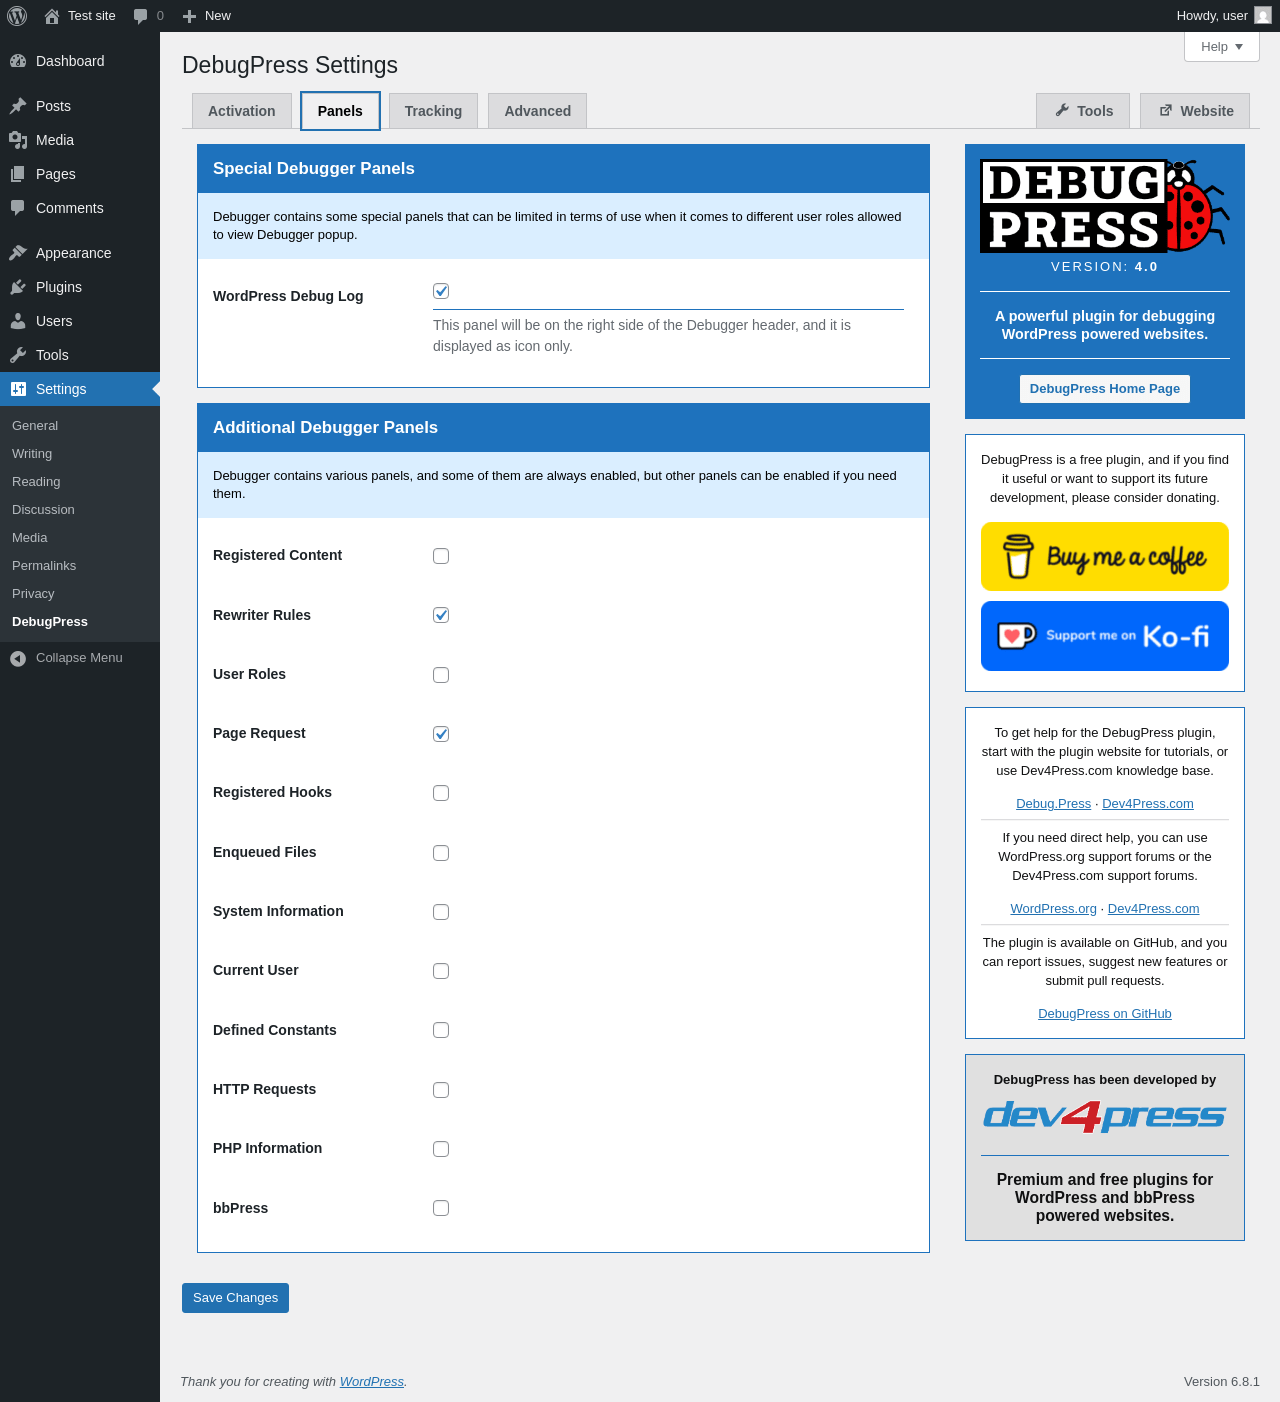
| URL | /wp-admin/options-general.php?page=debugpress |
|---|---|
| Aspect | menu-item-tab |
| HTTP status | 200 |
| Load time | 0.191 s |
| Memory usage | 3.63 MiB |
| JS errors | None |
| Resource errors | None |
Settings → DebugPress → Tracking
| URL | /wp-admin/options-general.php?page=debugpress |
|---|---|
| Aspect | menu-item-tab |
| HTTP status | 200 |
| Load time | 0.210 s |
| Memory usage | 3.63 MiB |
| JS errors | None |
| Resource errors | None |
Settings → DebugPress → Advanced
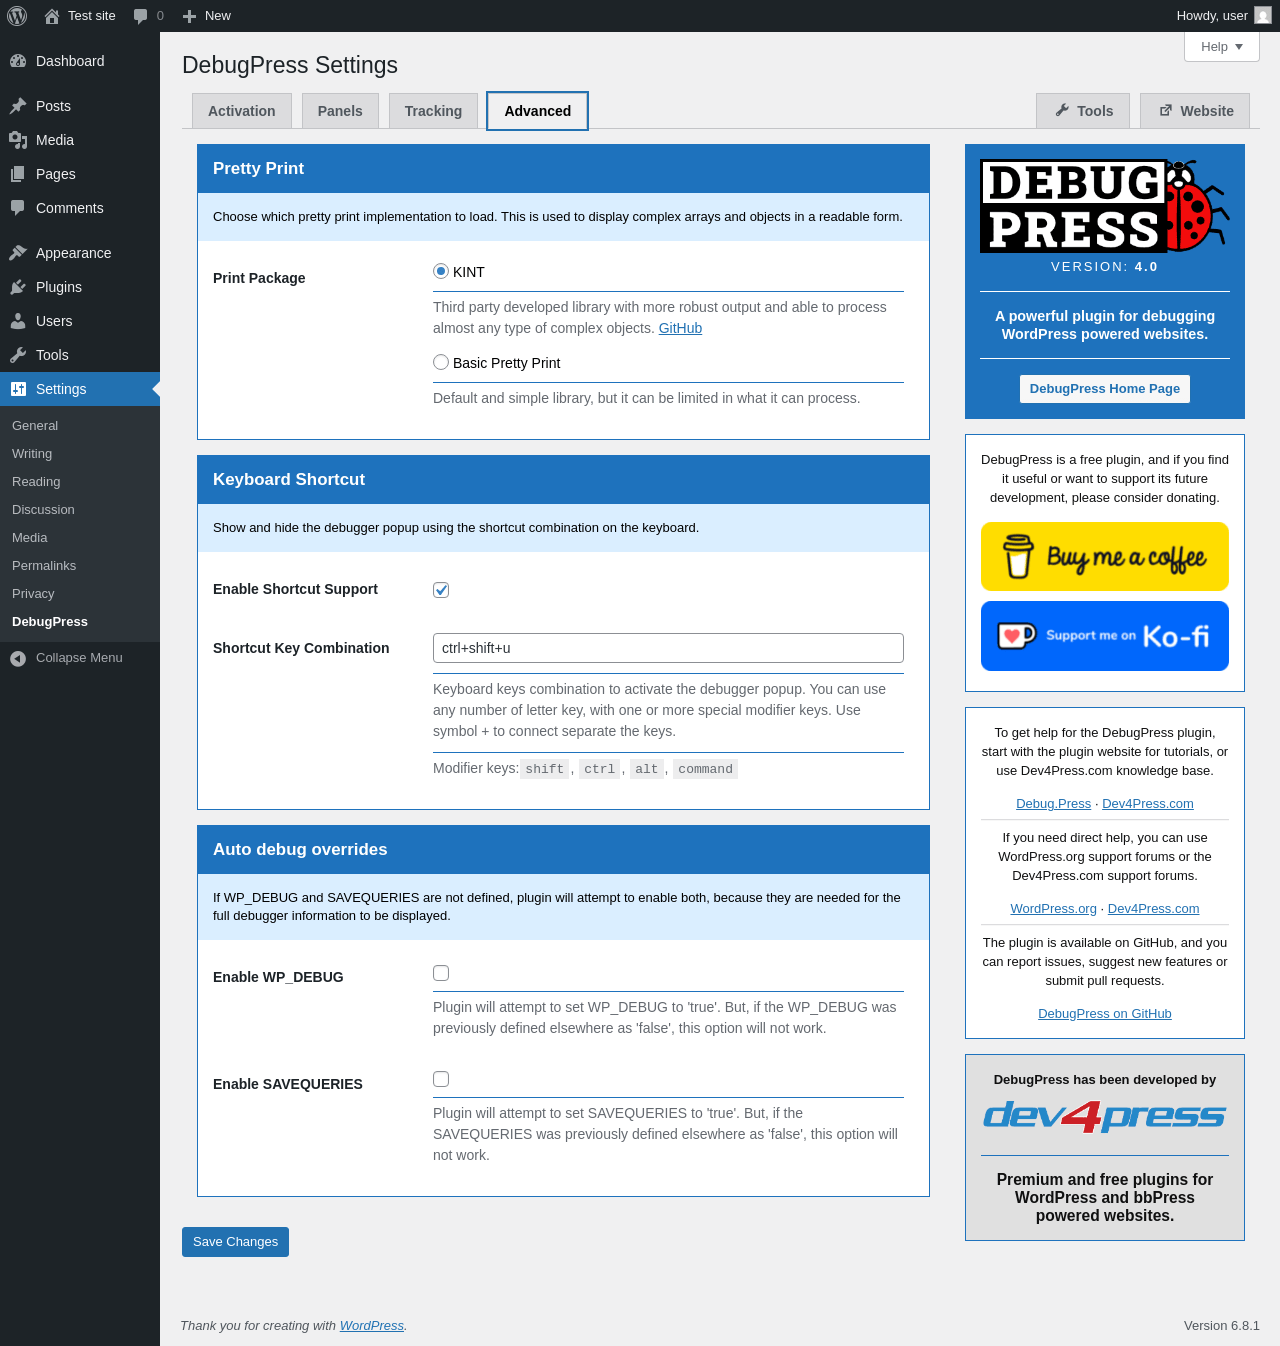
| URL | /wp-admin/options-general.php?page=debugpress |
|---|---|
| Aspect | menu-item-tab |
| HTTP status | 200 |
| Load time | 0.191 s |
| Memory usage | 3.63 MiB |
| JS errors | None |
| Resource errors | None |
Settings → DebugPress → Website
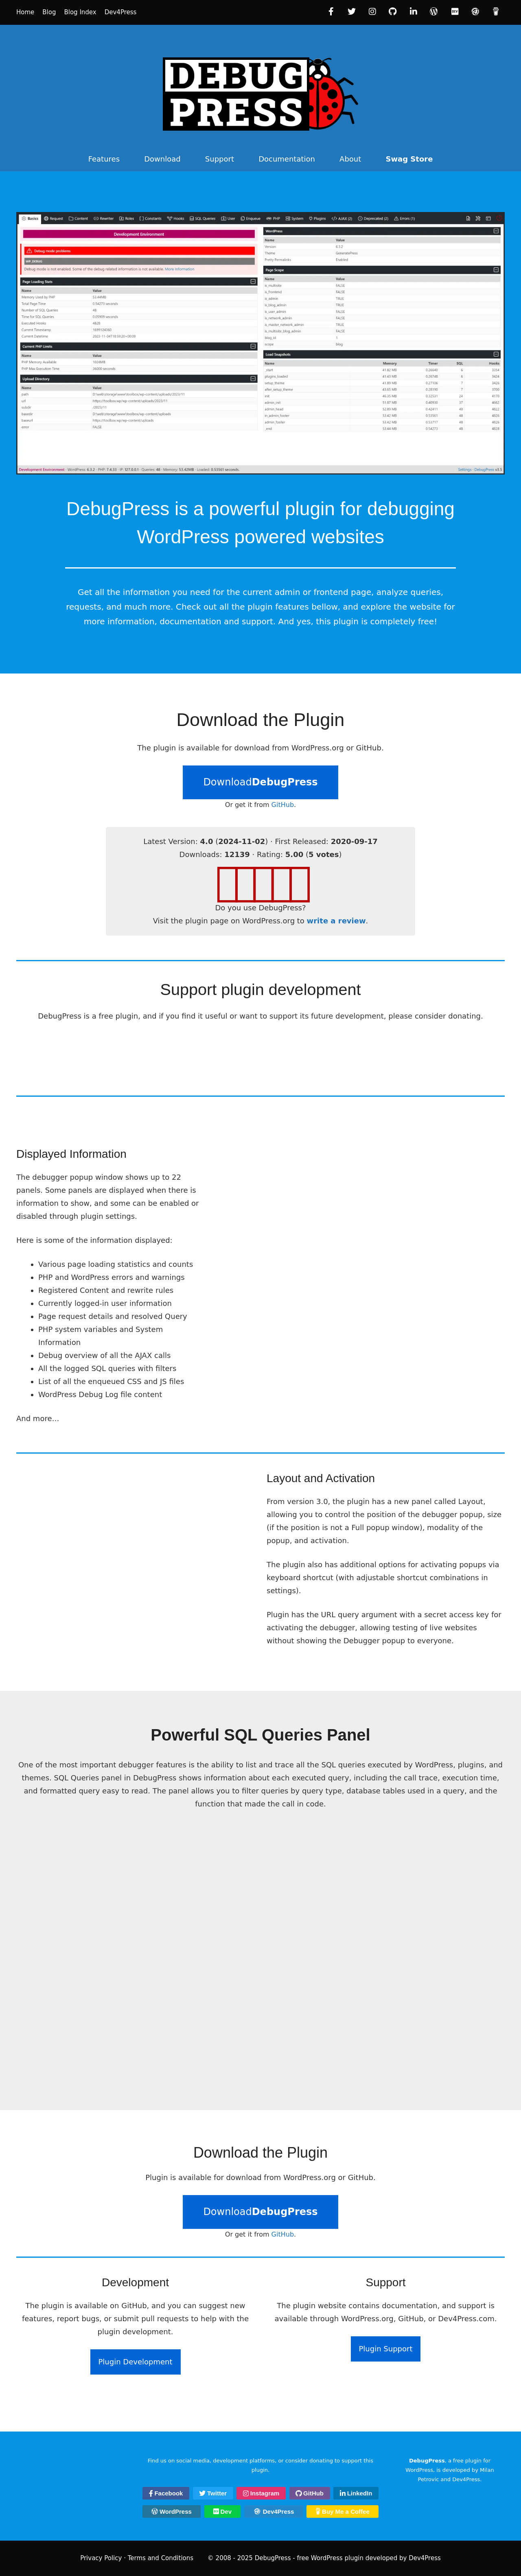
| URL | https://debug.press/ |
|---|---|
| Aspect | menu-item-tab |
| HTTP status | 200 |
| Load time | 1.141 s |
| Memory usage | N/A |
| JS errors | None |
| Resource errors | None |
Test site – Just another WordPress site
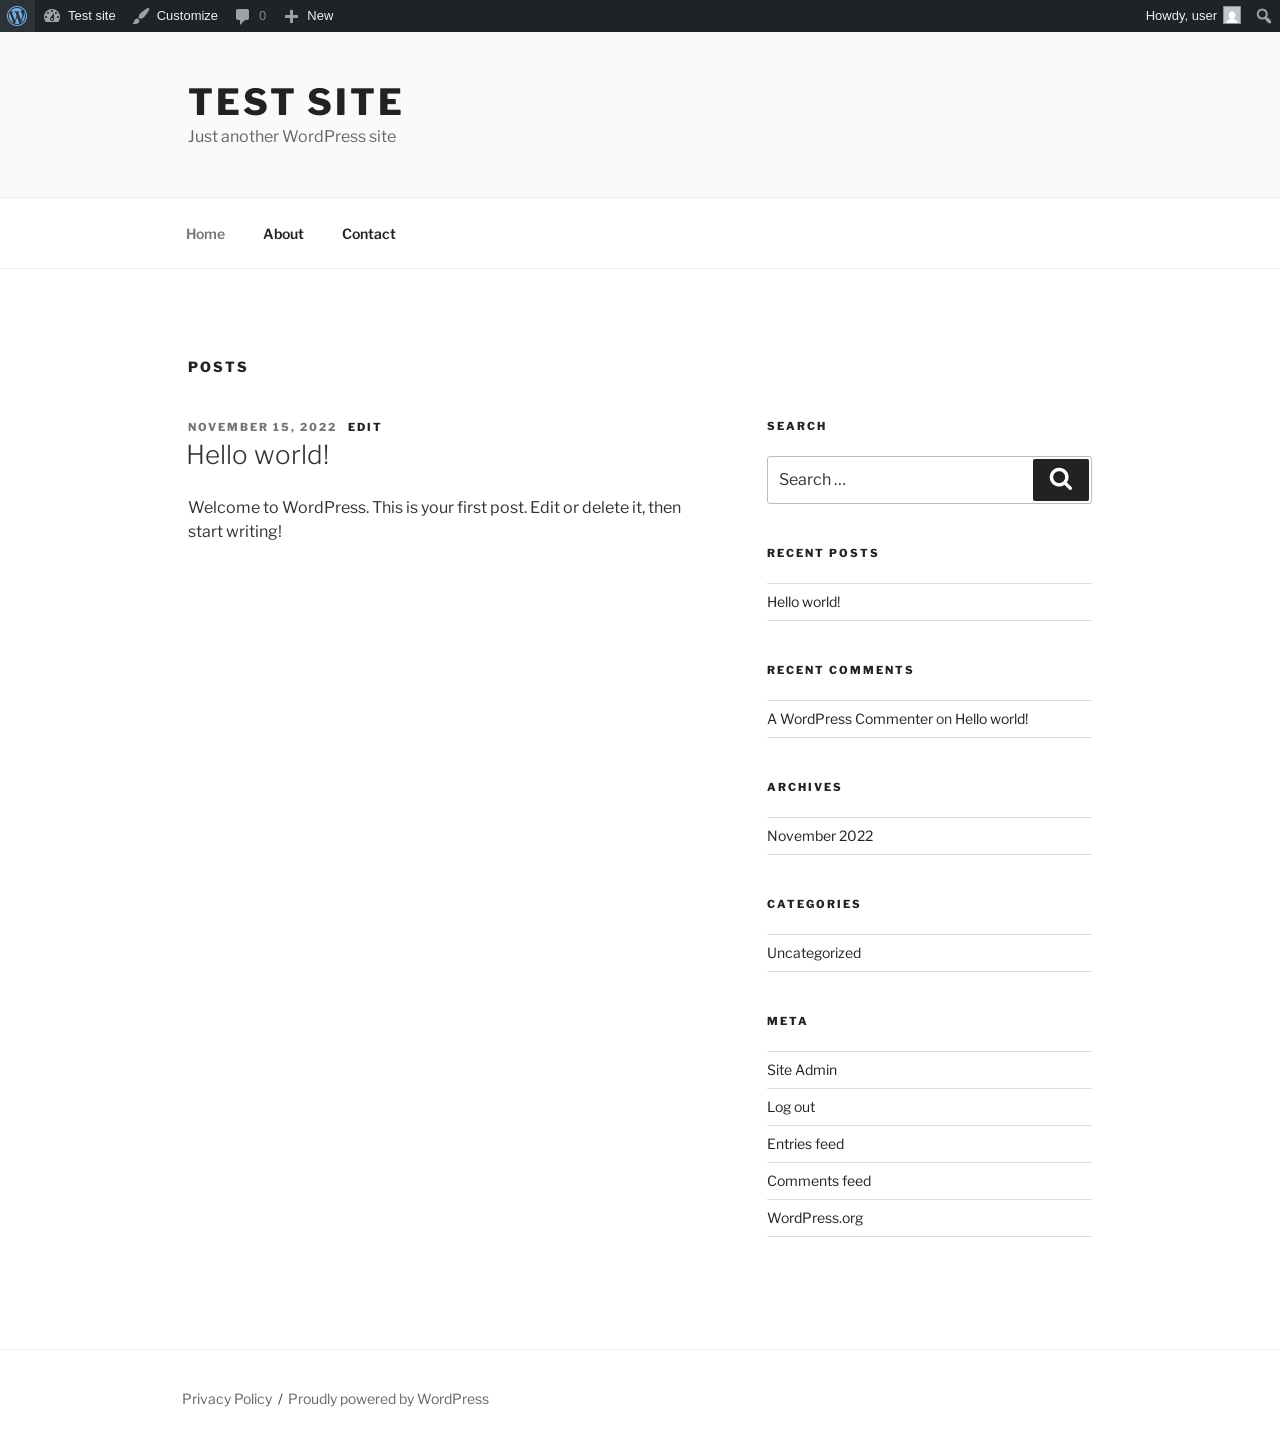
| URL | / |
|---|---|
| Aspect | front-page |
| HTTP status | 200 |
| Load time | 0.470 s |
| Memory usage | 3.5 MiB |
| JS errors | None |
| Resource errors | None |
Benchmark
| URL | Load time | Memory usage | ||||
|---|---|---|---|---|---|---|
| Inactive | Active | Change | Inactive | Active | Change | |
| /wp-admin/index.php | 0.309 s | 0.502 s | +0.193 s | 3.51 MiB | 3.64 MiB | + 138.97 KiB |
| /wp-admin/edit.php | 0.202 s | 0.245 s | +0.043 s | 3.57 MiB | 3.71 MiB | + 137.34 KiB |
| /wp-admin/post-new.php | 0.788 s | 0.992 s | +0.204 s | 6.06 MiB | 6.22 MiB | + 159.29 KiB |
| /wp-admin/upload.php | 0.562 s | 0.340 s | -0.222 s | 3.52 MiB | 3.65 MiB | + 124.7 KiB |
| /wp-admin/options-writing.php | 0.222 s | 0.217 s | -0.005 s | 3.5 MiB | 3.62 MiB | + 123.2 KiB |
| /wp-admin/media-new.php | 0.271 s | 0.254 s | -0.017 s | 3.49 MiB | 3.62 MiB | + 131.39 KiB |
| /wp-admin/edit-tags.php?taxonomy=category | 0.255 s | 0.198 s | -0.057 s | 3.5 MiB | 3.64 MiB | + 142.06 KiB |
| /wp-admin/post-new.php?post_type=page | 0.605 s | 1.000 s | +0.395 s | 6.05 MiB | 6.2 MiB | + 154.81 KiB |
| /wp-admin/options-discussion.php | 0.260 s | 0.376 s | +0.116 s | 3.5 MiB | 3.62 MiB | + 119.7 KiB |
| /wp-admin/edit-comments.php | 0.204 s | 0.249 s | +0.045 s | 3.52 MiB | 3.64 MiB | + 124.7 KiB |
| / | 0.298 s | 0.192 s | -0.106 s | 3.5 MiB | 3.5 MiB | + 4.14 KiB |
| Average | 0.361 s | 0.415 s | +0.054 s | 3.98 MiB | 4.1 MiB | + 123.66 KiB |
Code Statistics
Note: Third-party libraries and minified JS/CSS files are excluded from these statistics where possible, so the numbers you see here may be lower than those reported by other tools.
| Language | % | Lines of code | Comment lines | Files | |
|---|---|---|---|---|---|
| PHP | 65.4% | 7,768 | 434 | 83 | |
| Sass | 12.5% | 1,491 | 3 | 19 | |
| CSS | 12.0% | 1,427 | 5 | 3 | |
| JavaScript | 8.0% | 950 | 3 | 2 | |
| Markdown | 2.0% | 240 | 0 | 2 | |
| JSON | 0.0% | 5 | 0 | 1 | |
| Total | 11,881 | 445 | 110 | ||
PHP Code Analysis | More results »
| Lines of code | 7,179 |
|---|---|
| Total complexity | 1,335 |
| Median class complexity | 11.5 |
| Median method complexity | 2.0 |
| Most complex class | Dev4Press\Plugin\DebugPress\Display\SQLFormat |
| Most complex function | Dev4Press\Plugin\DebugPress\Display\SQLFormat::format() |
| Classes | 44 |
|---|---|
| Methods | 402 |
| Functions | 25 |
Additions
Things that the plugin adds to the site. This section is not intended to be comprehensive. The test tool only looks for a few specific types of added content.
No new entries found.
PHP Error Log
The log file is empty.