DebugPress: Debugger in Popup 3.9
Does "DebugPress: Debugger in a Popup" work with WordPress 6.6.1 and PHP 8.1.12? A smoke test was performed on .
Summary
| No PHP errors, warnings or notices | |
| No JavaScript exceptions | |
| All test pages loaded successfully | |
| No resource errors | |
| Looks good! No problems were detected. |
Memory usage: 140.9 KiB
The average PHP memory usage increased by this amount after activating by the plugin.
Page speed impact:
0.026 seconds
The average page load time increased by this amount after activating the plugin.
| WordPress version | 6.6.1 |
|---|---|
| PHP version | 8.1.12 |
| MySQL version | 10.6.10 |
| PHP memory limit | 512M |
| Last updated | |
|---|---|
| Active installs | 100+ |
| WordPress.org page | https://wordpress.org/plugins/debugpress/ |
| Badges |
|
Pages 11
Plugins ‹ Test site — WordPress
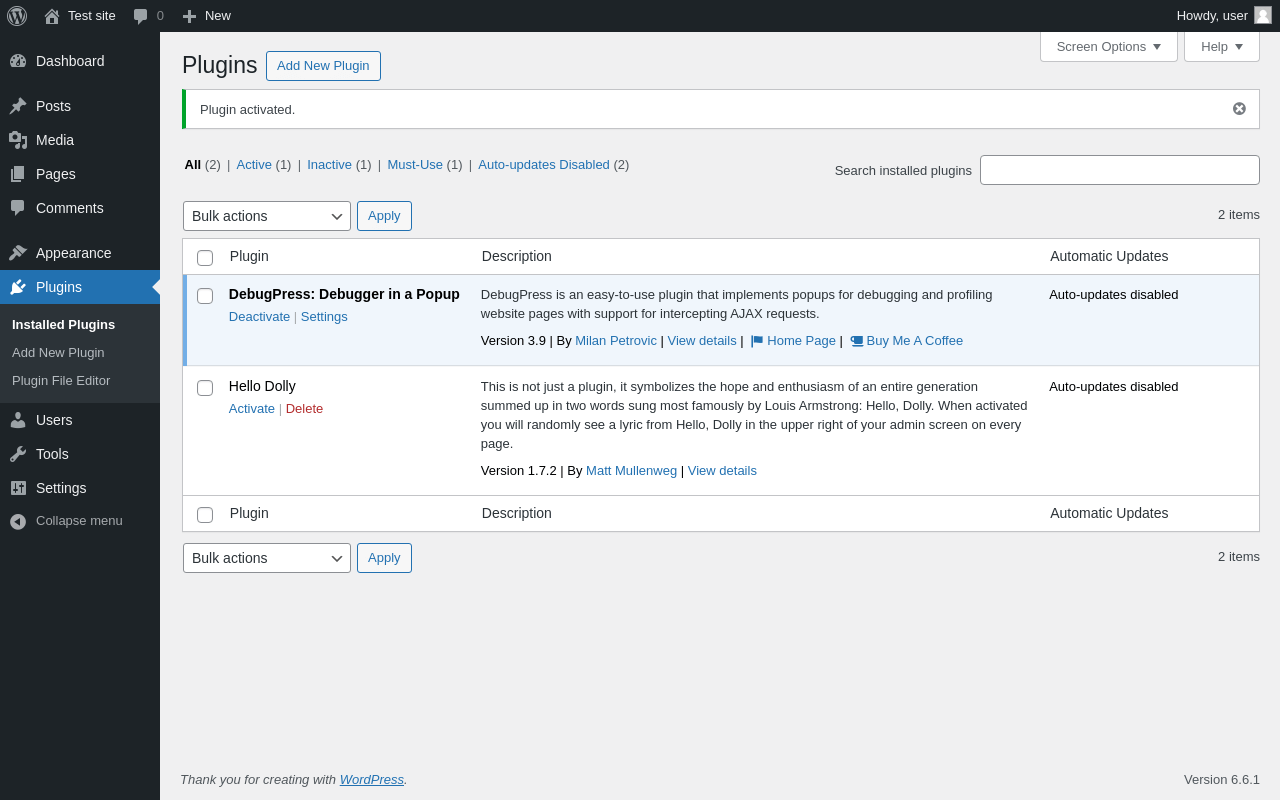
| URL | /wp-admin/plugins.php?plugin_status=all&paged=1&s |
|---|---|
| Requested URL | /wp-admin/plugins.php?action=activate&plugin=debugpress%2Fdebugpress.php&plugin_status=all&paged=1&s&_wpnonce=a2ffc1cad6 |
| Aspect | after-activation |
| HTTP status | 200 |
| Load time | 0.286 s |
| Memory usage | 3.68 MiB |
| JS errors | None |
| Resource errors | None |
Tools → DebugPress Info
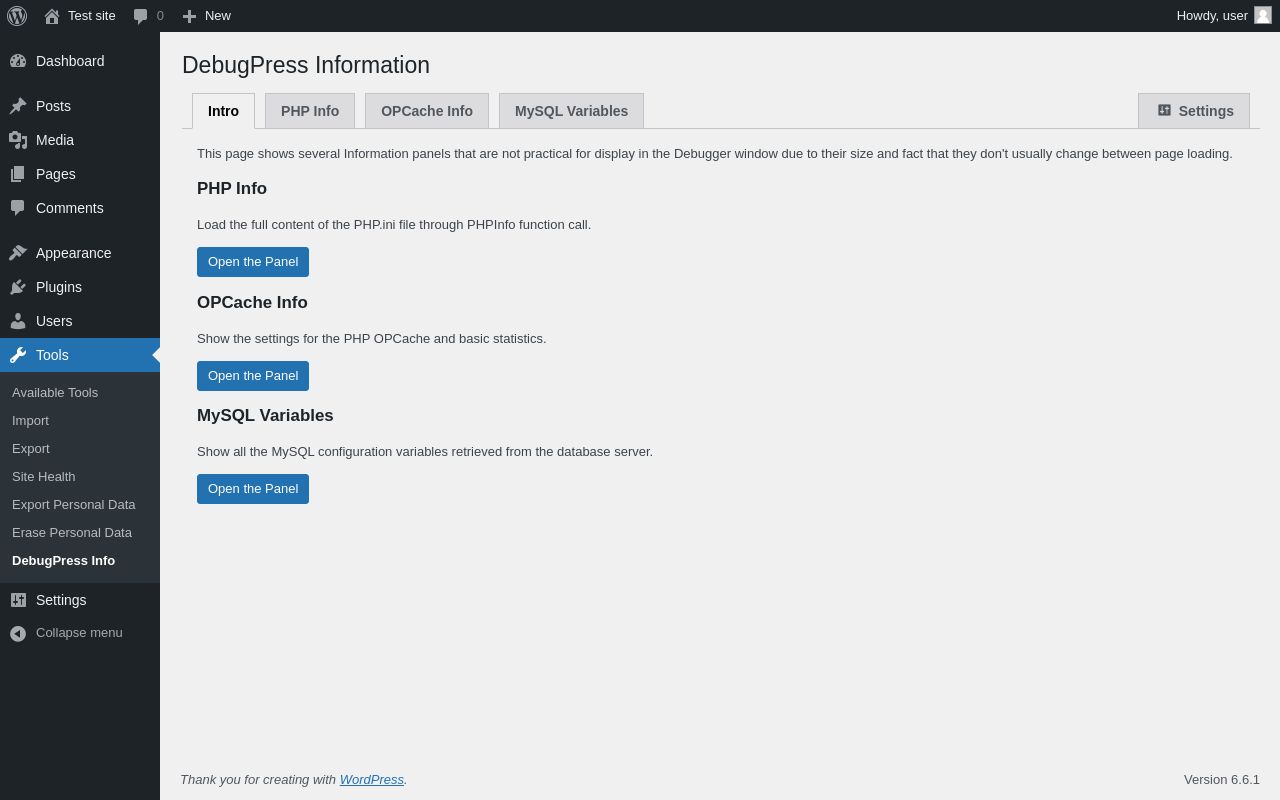
| URL | /wp-admin/tools.php?page=debugpress-info |
|---|---|
| Aspect | menu-item |
| HTTP status | 200 |
| Load time | 0.170 s |
| Memory usage | 3.86 MiB |
| JS errors | None |
| Resource errors | None |
Tools → DebugPress Info → PHP Info

| URL | /wp-admin/tools.php?page=debugpress-info&tab=php |
|---|---|
| Aspect | menu-item-tab |
| HTTP status | 200 |
| Load time | 0.346 s |
| Memory usage | 3.86 MiB |
| JS errors | None |
| Resource errors | None |
Tools → DebugPress Info → OPCache Info
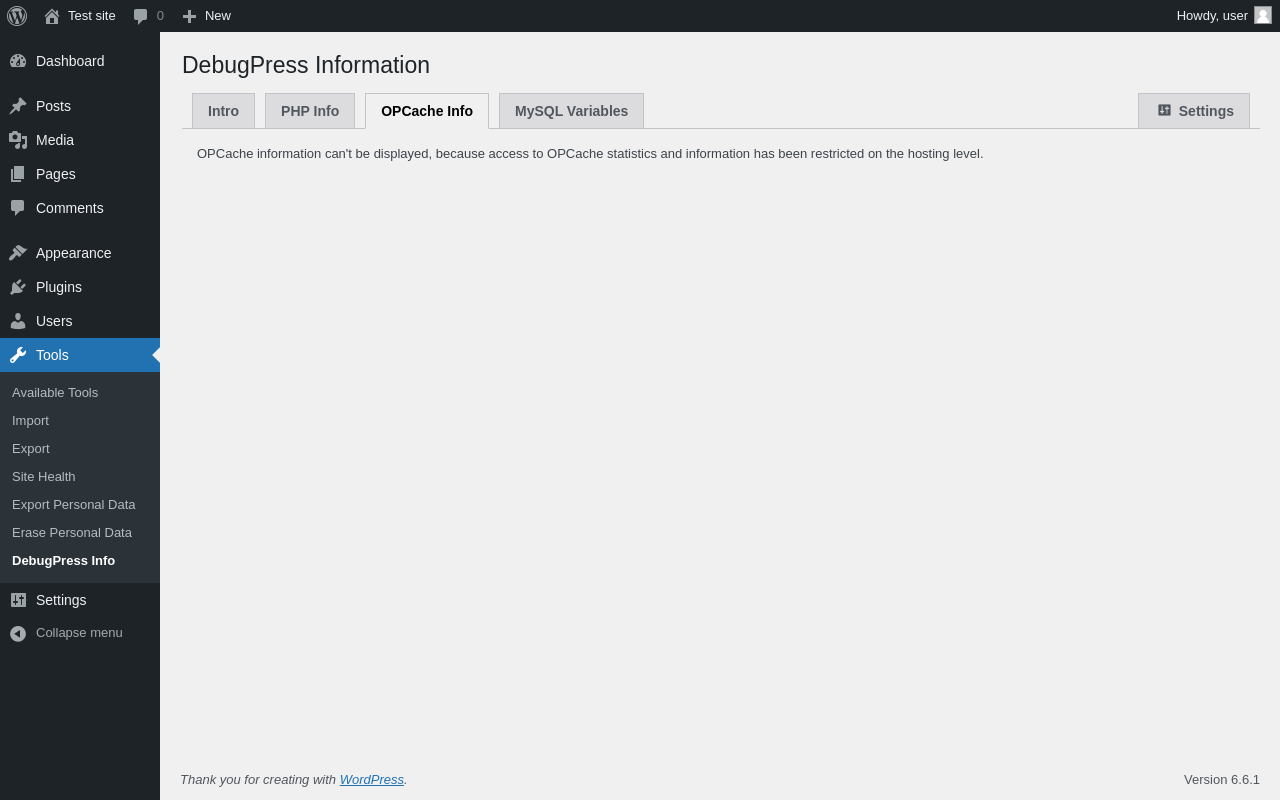
| URL | /wp-admin/tools.php?page=debugpress-info&tab=opcache |
|---|---|
| Aspect | menu-item-tab |
| HTTP status | 200 |
| Load time | 0.176 s |
| Memory usage | 3.86 MiB |
| JS errors | None |
| Resource errors | None |
Tools → DebugPress Info → MySQL Variables

| URL | /wp-admin/tools.php?page=debugpress-info&tab=mysql |
|---|---|
| Aspect | menu-item-tab |
| HTTP status | 200 |
| Load time | 0.279 s |
| Memory usage | 3.88 MiB |
| JS errors | None |
| Resource errors | None |
Settings → DebugPress
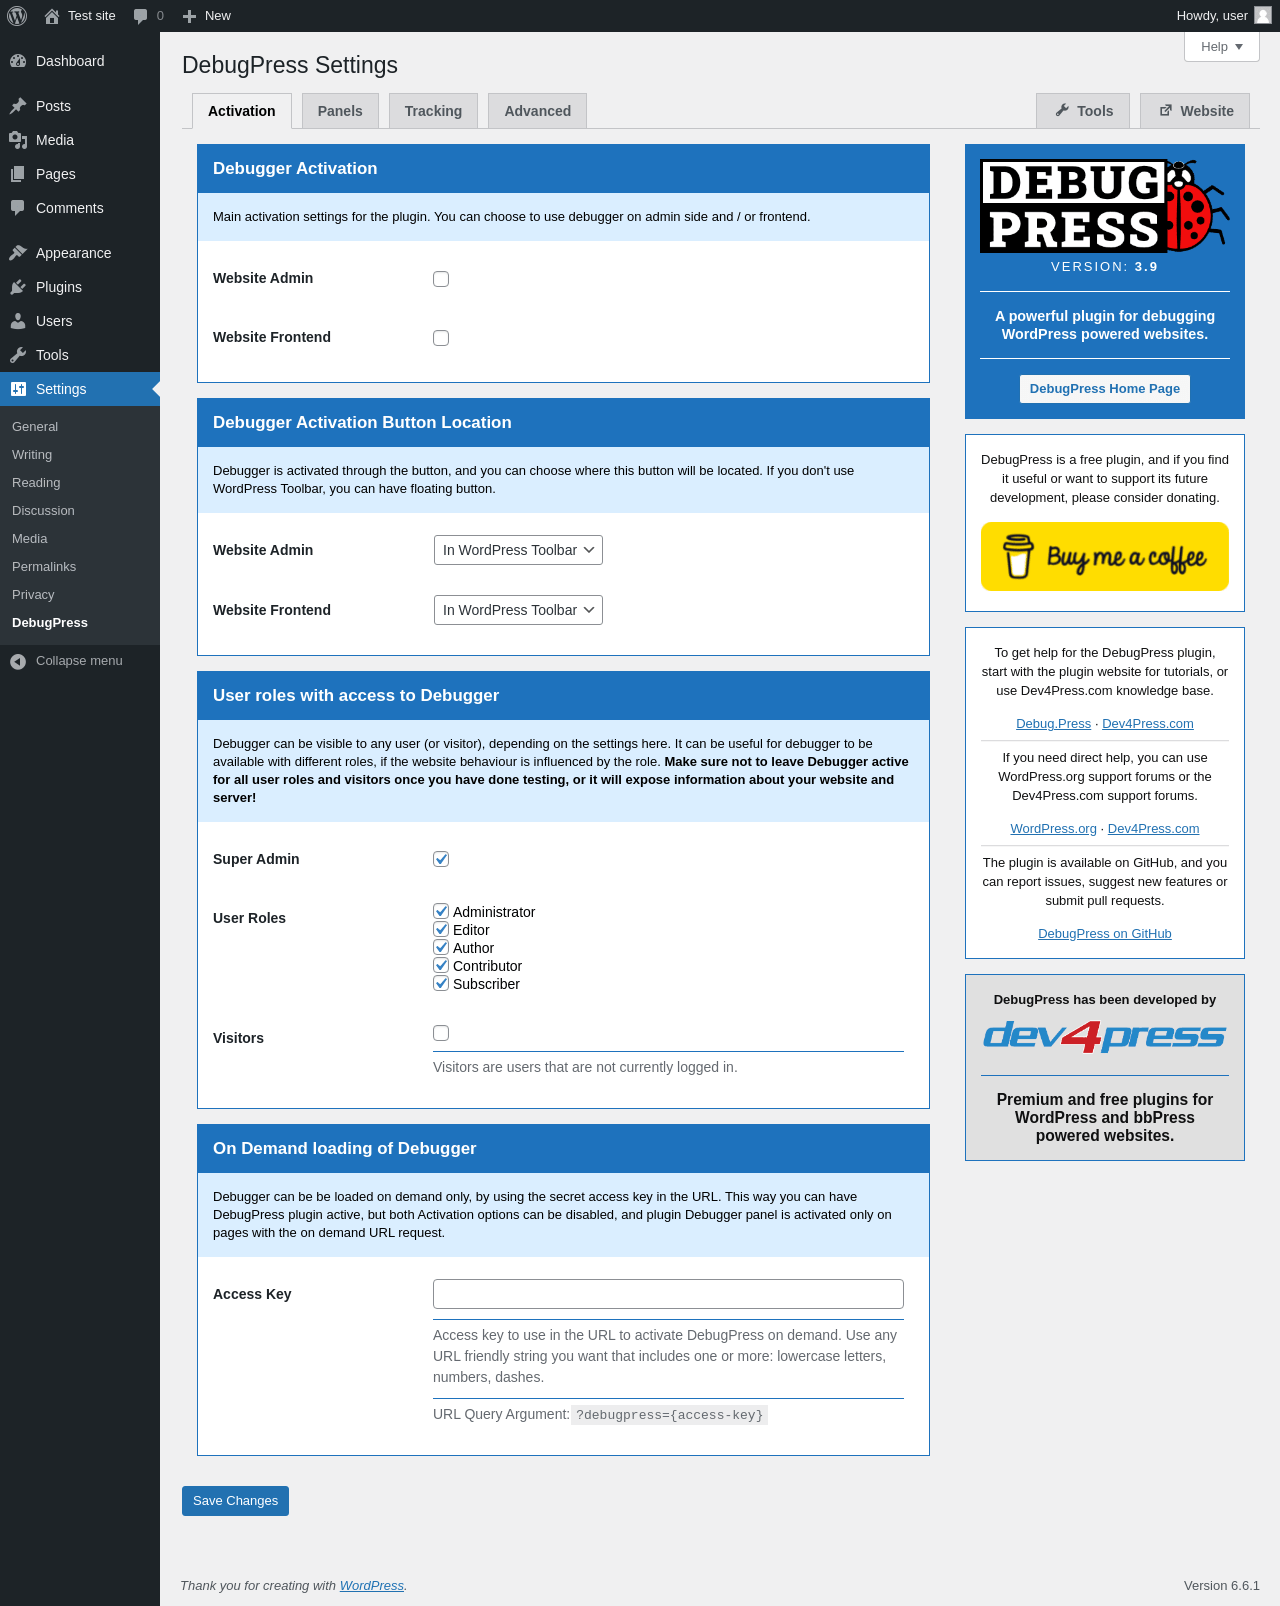
| URL | /wp-admin/options-general.php?page=debugpress |
|---|---|
| Aspect | menu-item |
| HTTP status | 200 |
| Load time | 0.232 s |
| Memory usage | 3.62 MiB |
| JS errors | None |
| Resource errors | None |
Settings → DebugPress → Panels
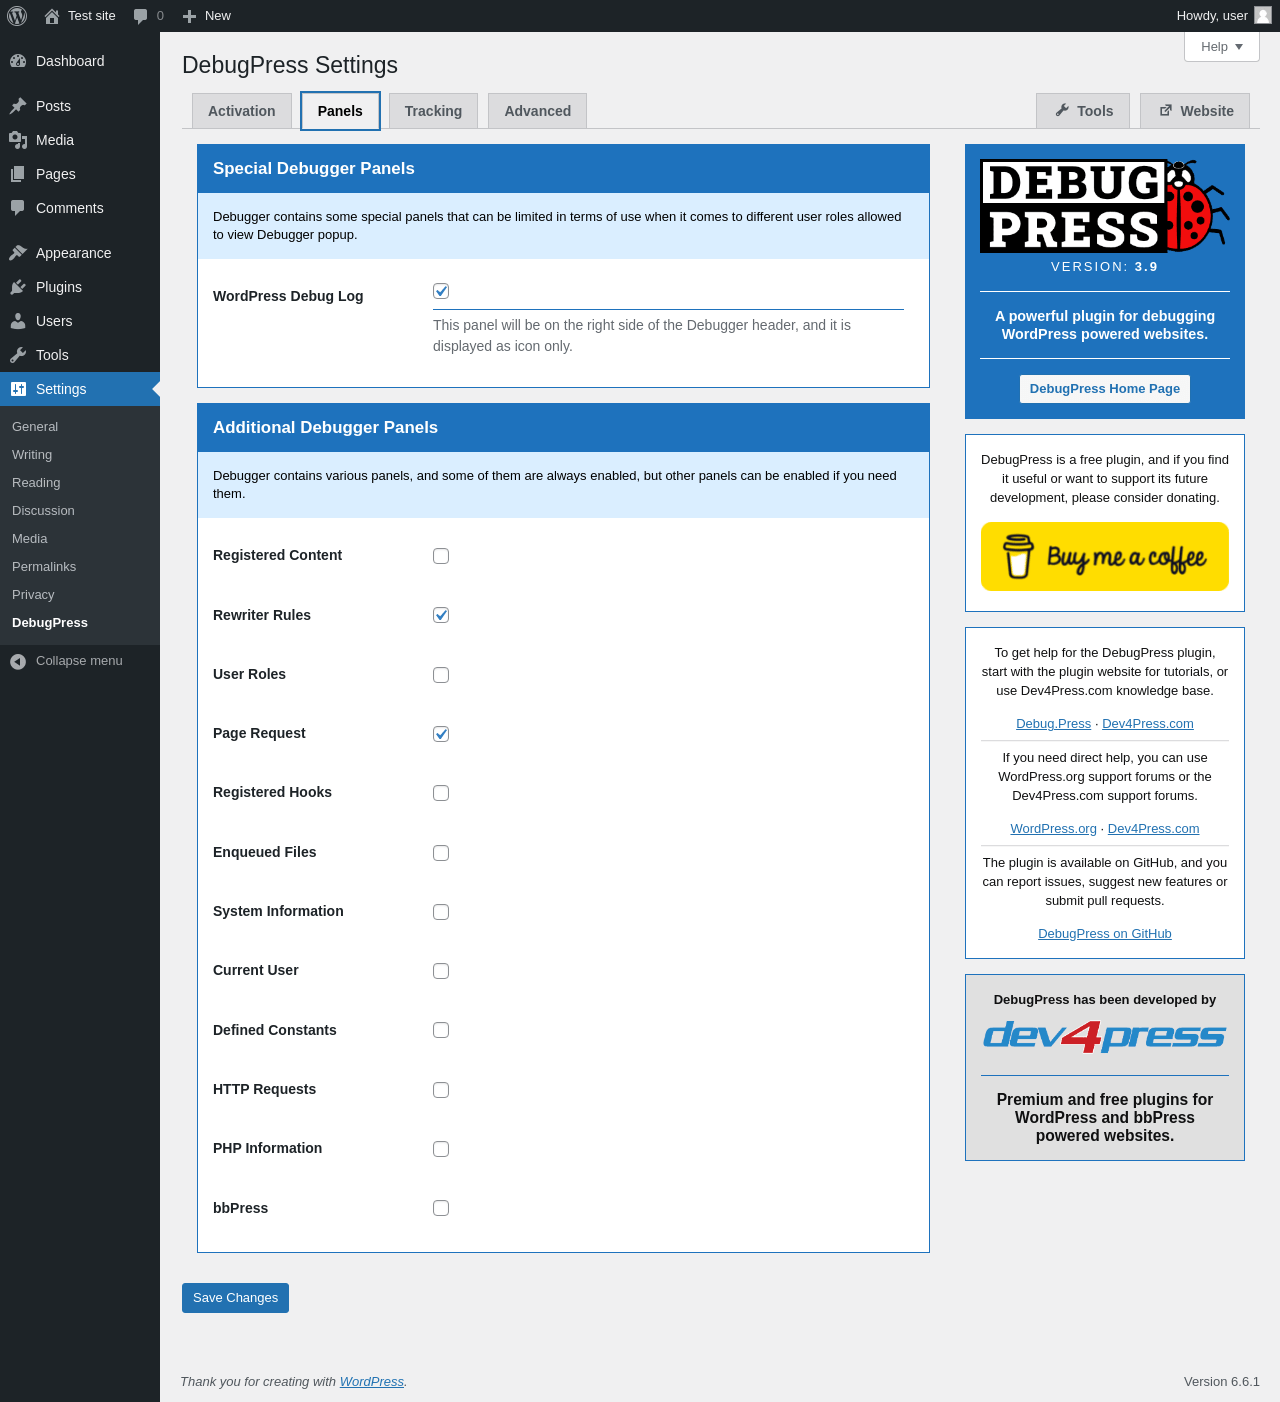
| URL | /wp-admin/options-general.php?page=debugpress |
|---|---|
| Aspect | menu-item-tab |
| HTTP status | 200 |
| Load time | 0.199 s |
| Memory usage | 3.59 MiB |
| JS errors | None |
| Resource errors | None |
Settings → DebugPress → Tracking
| URL | /wp-admin/options-general.php?page=debugpress |
|---|---|
| Aspect | menu-item-tab |
| HTTP status | 200 |
| Load time | 0.207 s |
| Memory usage | 3.59 MiB |
| JS errors | None |
| Resource errors | None |
Settings → DebugPress → Advanced
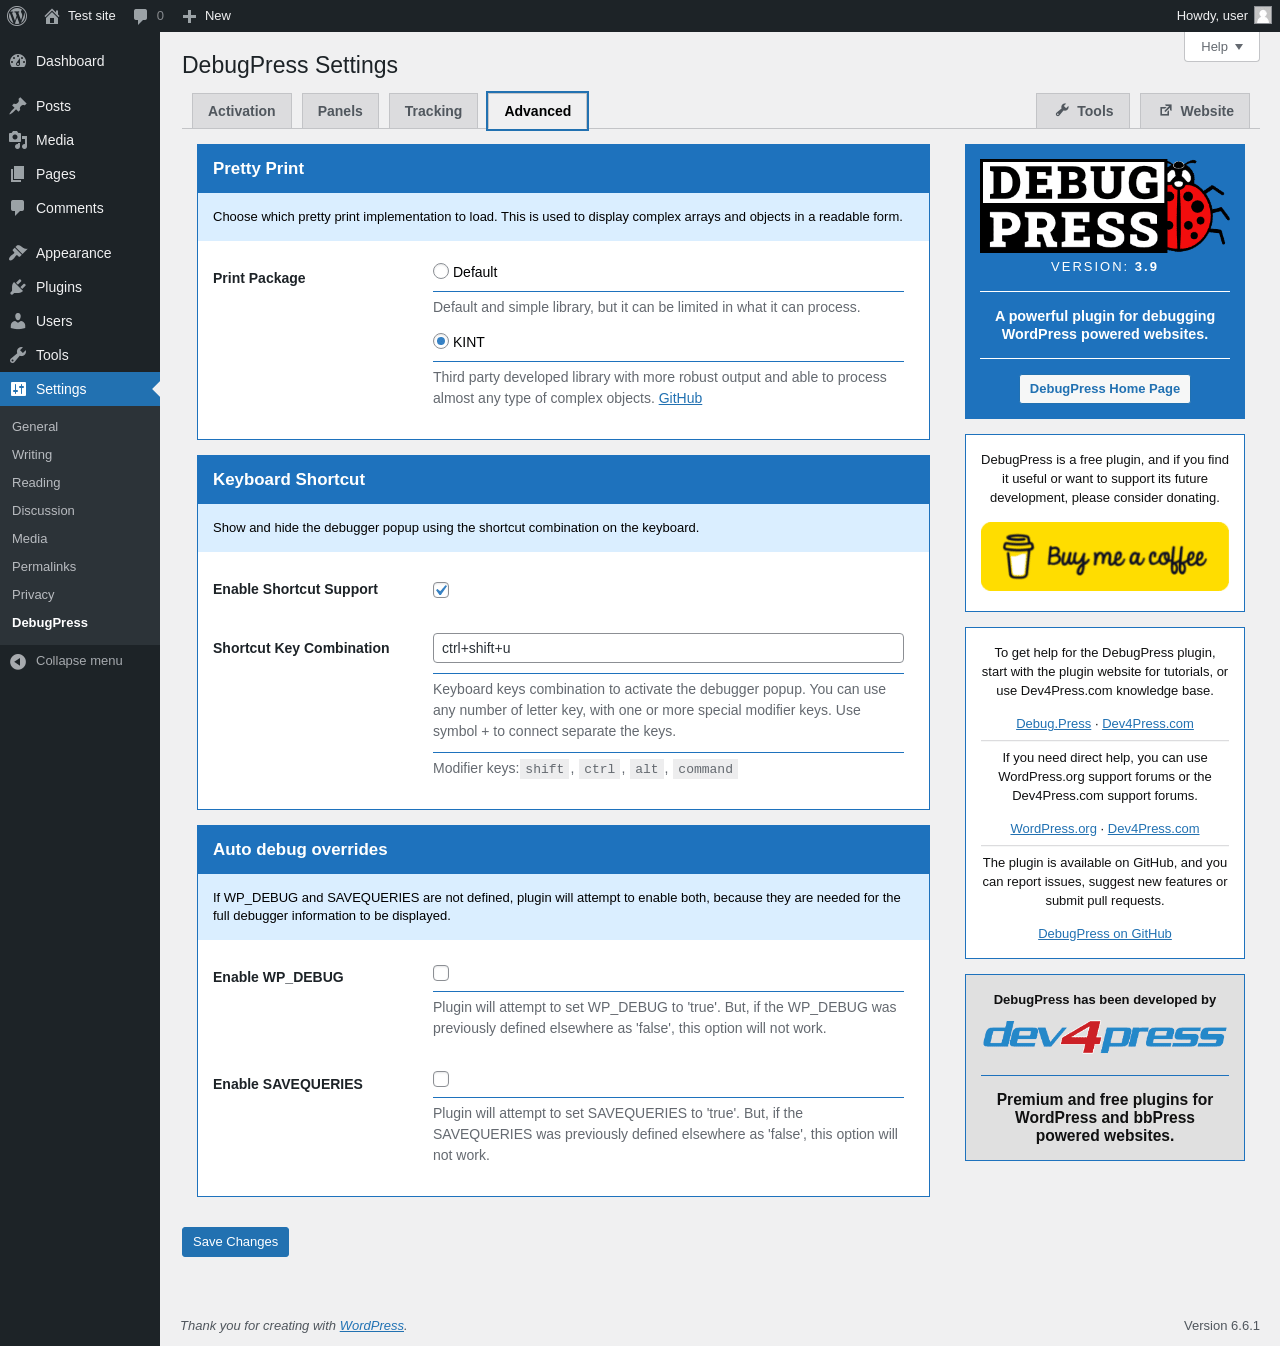
| URL | /wp-admin/options-general.php?page=debugpress |
|---|---|
| Aspect | menu-item-tab |
| HTTP status | 200 |
| Load time | 0.188 s |
| Memory usage | 3.59 MiB |
| JS errors | None |
| Resource errors | None |
Settings → DebugPress → Website
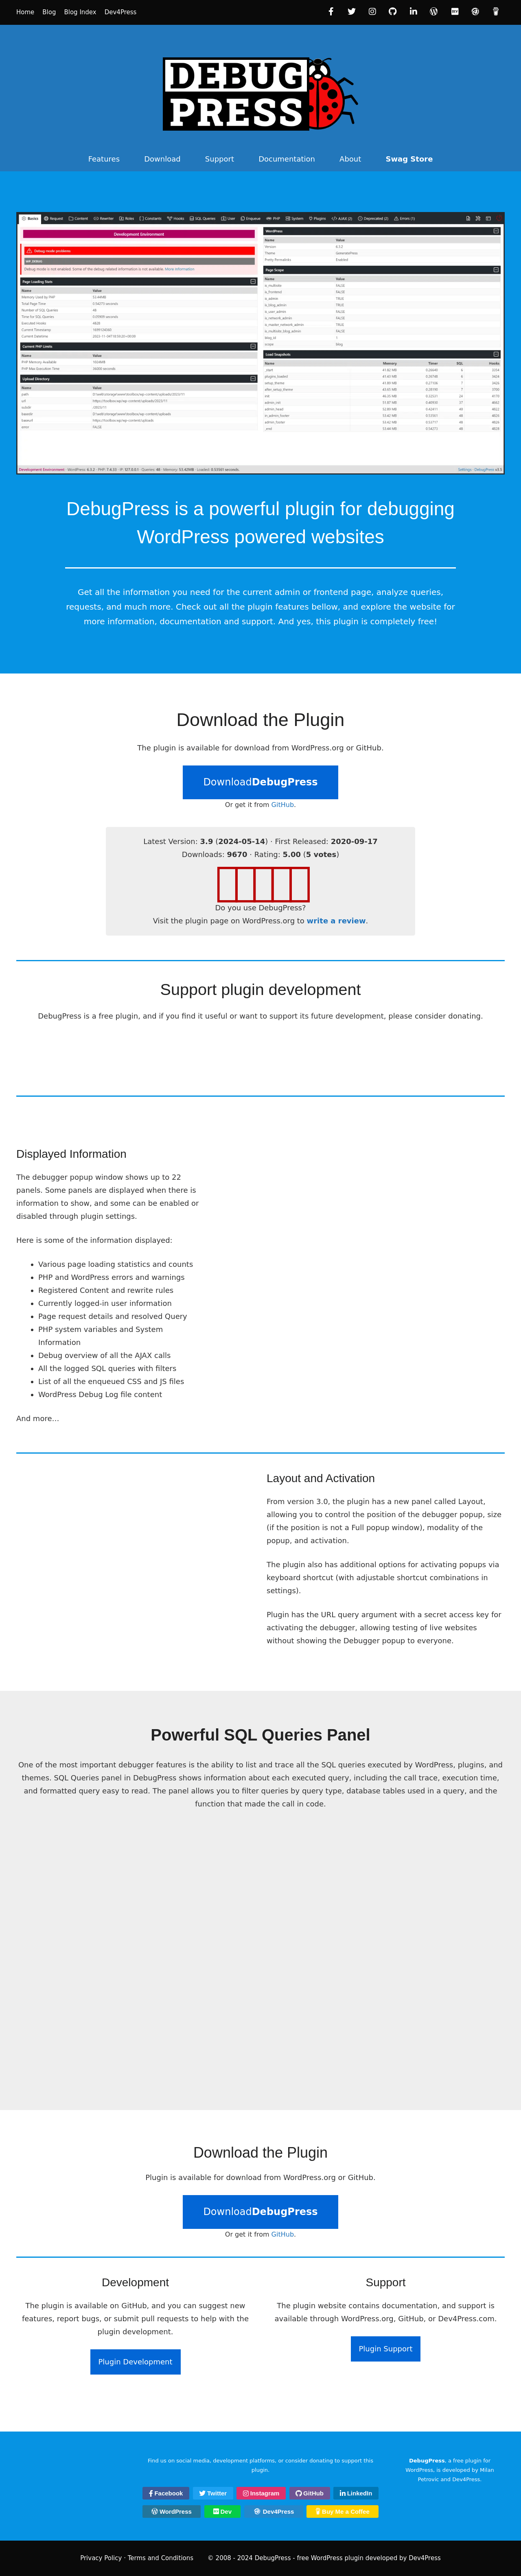
| URL | https://debug.press/ |
|---|---|
| Aspect | menu-item-tab |
| HTTP status | 200 |
| Load time | 1.231 s |
| Memory usage | N/A |
| JS errors | None |
| Resource errors | None |
Test site – Just another WordPress site
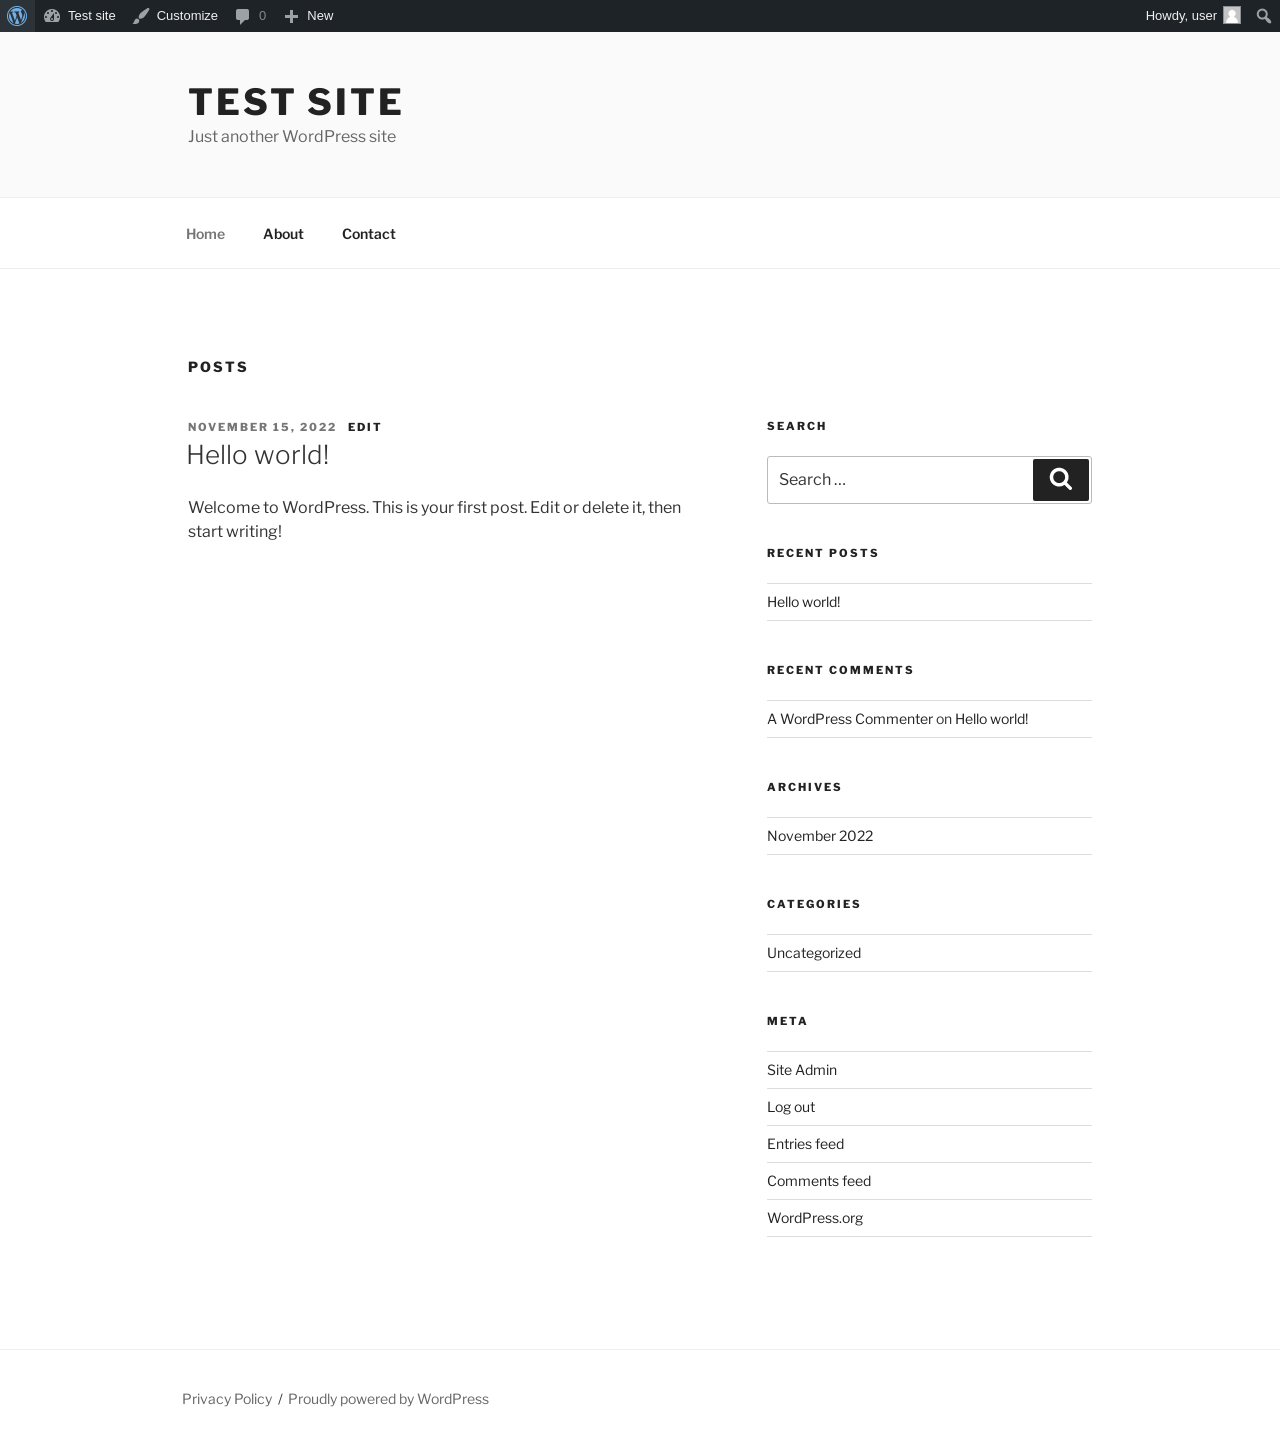
| URL | / |
|---|---|
| Aspect | front-page |
| HTTP status | 200 |
| Load time | 0.490 s |
| Memory usage | 3.47 MiB |
| JS errors | None |
| Resource errors | None |
Benchmark
| URL | Load time | Memory usage | ||||
|---|---|---|---|---|---|---|
| Inactive | Active | Change | Inactive | Active | Change | |
| /wp-admin/index.php | 0.346 s | 0.532 s | +0.186 s | 3.47 MiB | 3.61 MiB | + 137.95 KiB |
| /wp-admin/edit.php | 0.217 s | 0.271 s | +0.054 s | 3.54 MiB | 3.67 MiB | + 136.54 KiB |
| /wp-admin/post-new.php | 0.802 s | 0.962 s | +0.160 s | 5.75 MiB | 5.91 MiB | + 162.19 KiB |
| /wp-admin/upload.php | 0.713 s | 0.427 s | -0.286 s | 3.49 MiB | 3.61 MiB | + 122.96 KiB |
| /wp-admin/options-writing.php | 0.204 s | 0.215 s | +0.011 s | 3.41 MiB | 3.59 MiB | + 180.27 KiB |
| /wp-admin/media-new.php | 0.237 s | 0.261 s | +0.024 s | 3.4 MiB | 3.59 MiB | + 193.65 KiB |
| /wp-admin/edit-tags.php?taxonomy=category | 0.197 s | 0.319 s | +0.122 s | 3.47 MiB | 3.61 MiB | + 140.32 KiB |
| /wp-admin/post-new.php?post_type=page | 0.607 s | 0.808 s | +0.201 s | 5.75 MiB | 5.9 MiB | + 152.84 KiB |
| /wp-admin/options-discussion.php | 0.317 s | 0.265 s | -0.052 s | 3.41 MiB | 3.59 MiB | + 181.95 KiB |
| /wp-admin/edit-comments.php | 0.238 s | 0.210 s | -0.028 s | 3.49 MiB | 3.61 MiB | + 122.95 KiB |
| / | 0.315 s | 0.205 s | -0.110 s | 3.45 MiB | 3.47 MiB | + 18.28 KiB |
| Average | 0.381 s | 0.407 s | +0.026 s | 3.88 MiB | 4.01 MiB | + 140.9 KiB |
Code Statistics
Note: Third-party libraries and minified JS/CSS files are excluded from these statistics where possible, so the numbers you see here may be lower than those reported by other tools.
| Language | % | Lines of code | Comment lines | Files | |
|---|---|---|---|---|---|
| PHP | 64.5% | 7,433 | 434 | 82 | |
| Sass | 12.9% | 1,491 | 3 | 19 | |
| CSS | 12.4% | 1,427 | 5 | 3 | |
| JavaScript | 8.2% | 950 | 3 | 2 | |
| Markdown | 2.0% | 231 | 0 | 2 | |
| Total | 11,532 | 445 | 108 | ||
PHP Code Analysis | More results »
| Lines of code | 6,848 |
|---|---|
| Total complexity | 1,267 |
| Median class complexity | 11.0 |
| Median method complexity | 2.0 |
| Most complex class | Dev4Press\Plugin\DebugPress\Display\SQLFormat |
| Most complex function | Dev4Press\Plugin\DebugPress\Display\SQLFormat::format() |
| Classes | 43 |
|---|---|
| Methods | 386 |
| Functions | 25 |
Additions
Things that the plugin adds to the site. This section is not intended to be comprehensive. The test tool only looks for a few specific types of added content.
No new entries found.
PHP Error Log
The log file is empty.