atec Profiler 1.1.27
Does atec Profiler work with WordPress 6.8.3 and PHP 8.1.12? A smoke test was performed on .
Summary
| No PHP errors, warnings or notices | |
| No JavaScript exceptions | |
| All test pages loaded successfully | |
| No resource errors | |
| Looks good! No problems were detected. |
Memory usage: 14.09 KiB
The average PHP memory usage increased by this amount after activating by the plugin.
Page speed impact:
insignificant.
The plugin didn't make the site noticeably slower.
| WordPress version | 6.8.3 |
|---|---|
| PHP version | 8.1.12 |
| MySQL version | 10.6.10 |
| PHP memory limit | 512M |
| Last updated | |
|---|---|
| Active installs | <10 |
| WordPress.org page | https://wordpress.org/plugins/atec-profiler/ |
| Badges |
|
Pages 10
Plugins ‹ Test site — WordPress
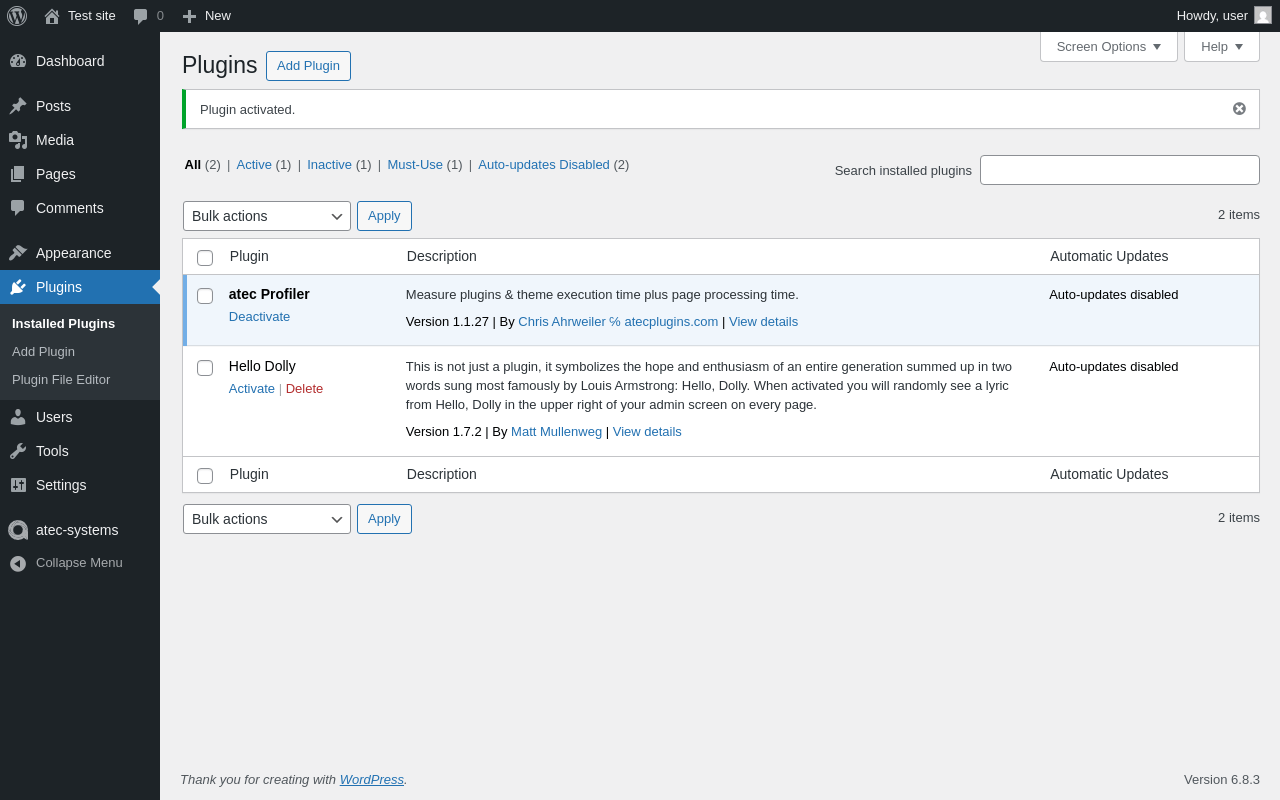
| URL | /wp-admin/plugins.php?plugin_status=all&paged=1&s |
|---|---|
| Requested URL | /wp-admin/plugins.php?action=activate&plugin=atec-profiler%2Fatec-profiler.php&plugin_status=all&paged=1&s&_wpnonce=f30d535750 |
| Aspect | after-activation |
| HTTP status | 200 |
| Load time | 0.289 s |
| Memory usage | 3.55 MiB |
| JS errors | None |
| Resource errors | None |
atec-systems
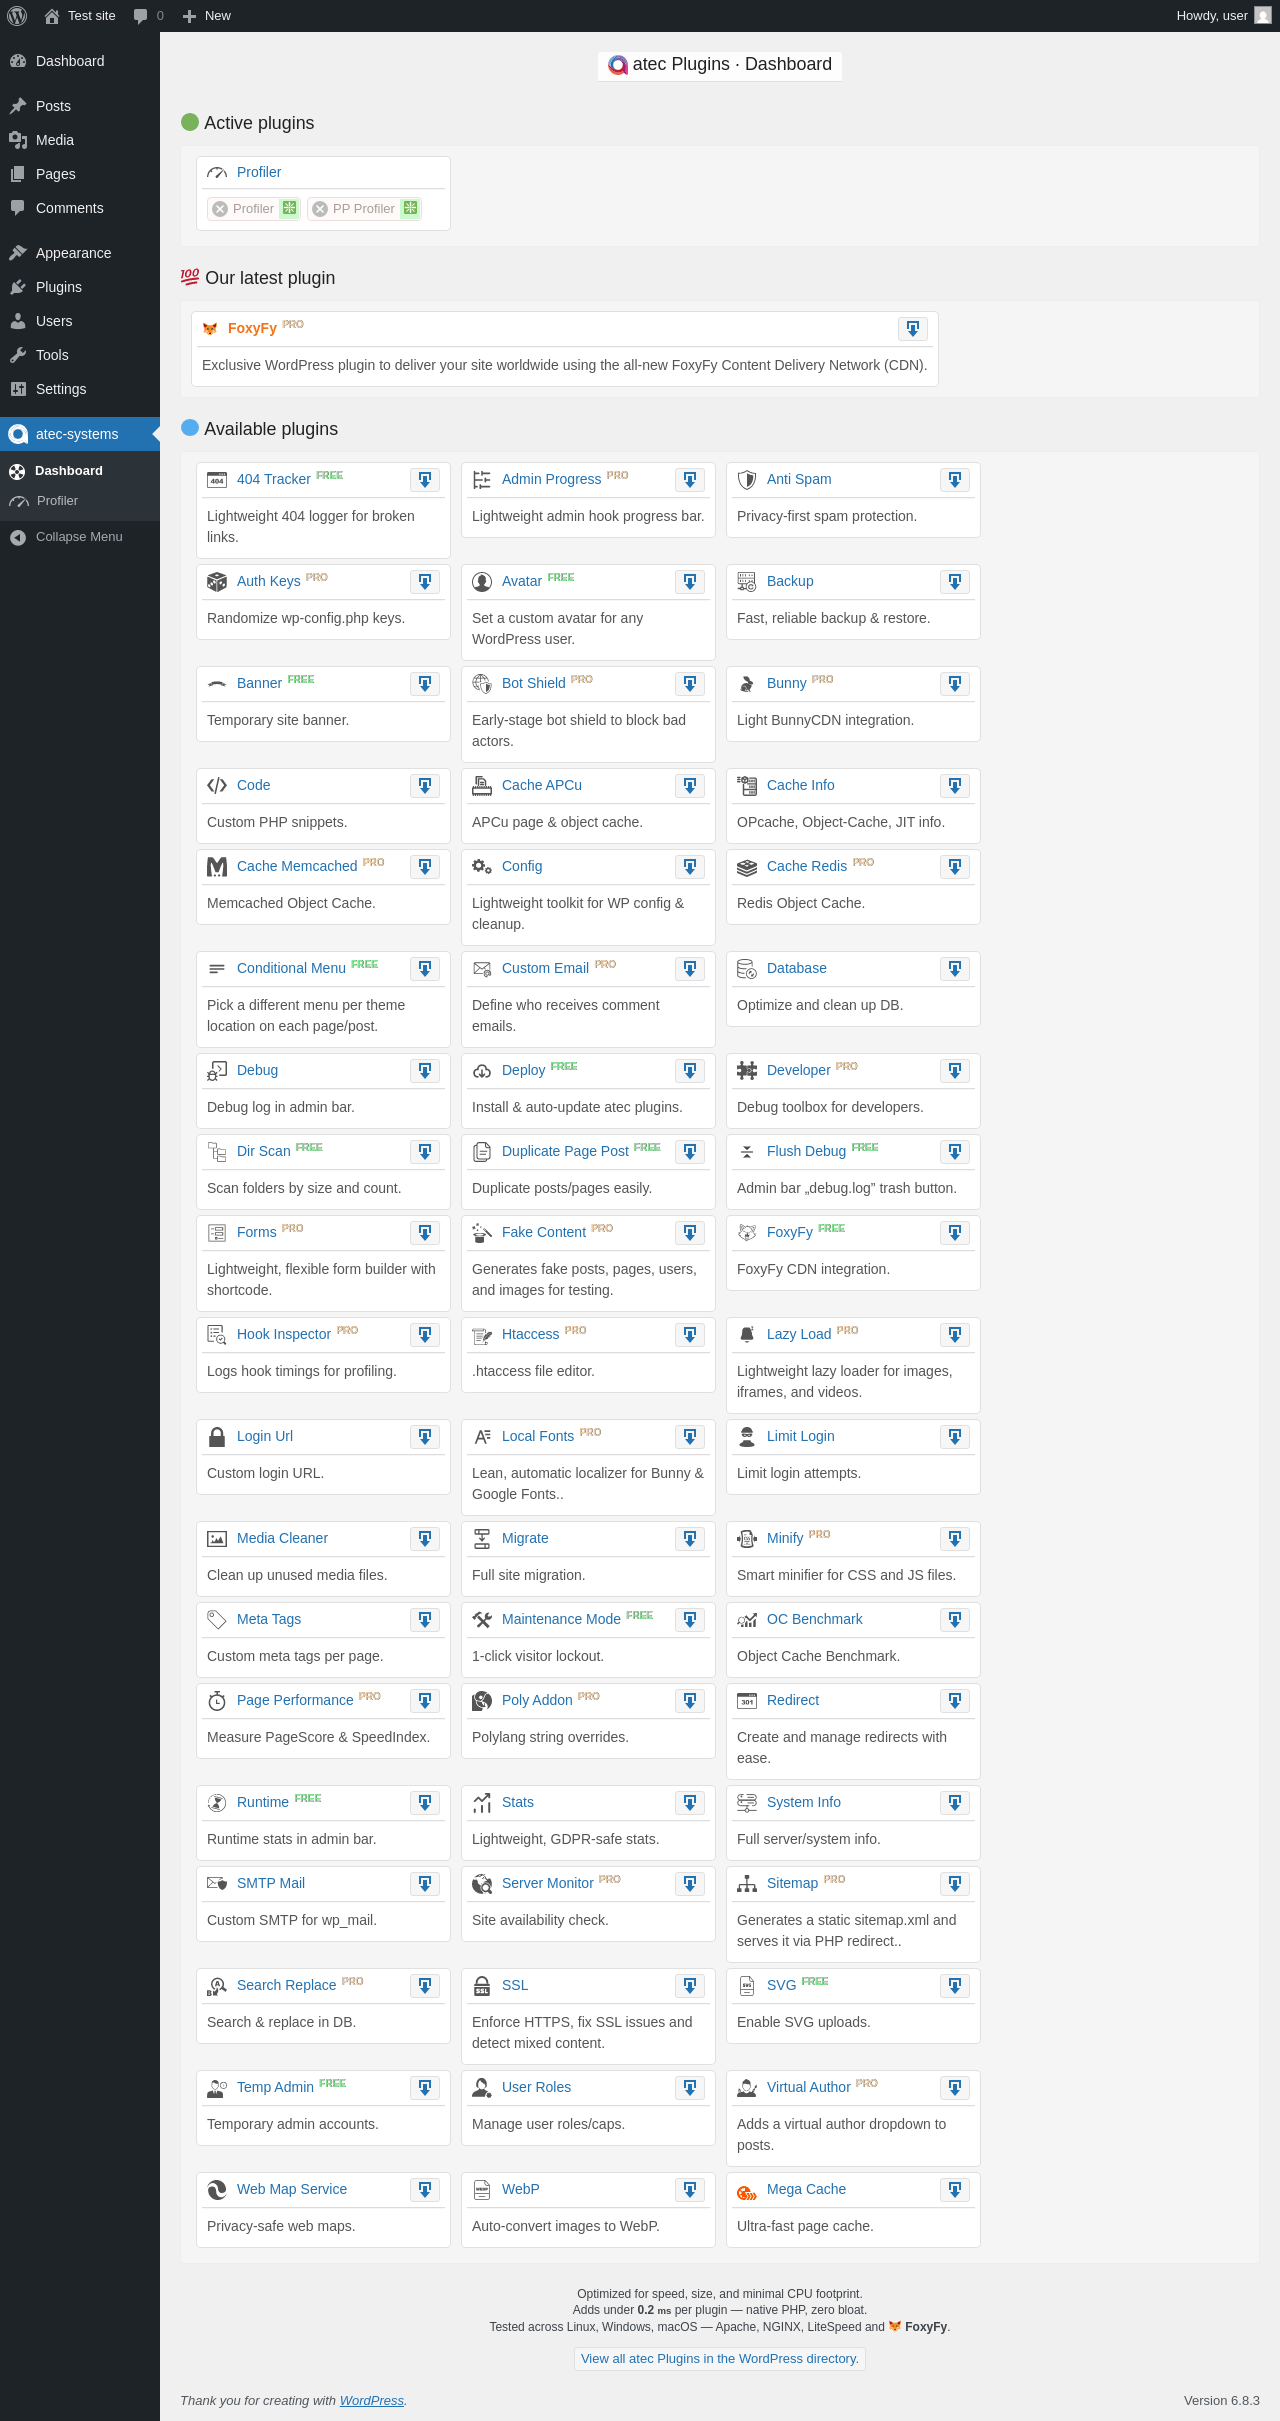
| URL | /wp-admin/admin.php?page=atec_group |
|---|---|
| Aspect | menu-item |
| HTTP status | 200 |
| Load time | 0.416 s |
| Memory usage | 3.7 MiB |
| JS errors | None |
| Resource errors | None |
atec-systems → Profiler
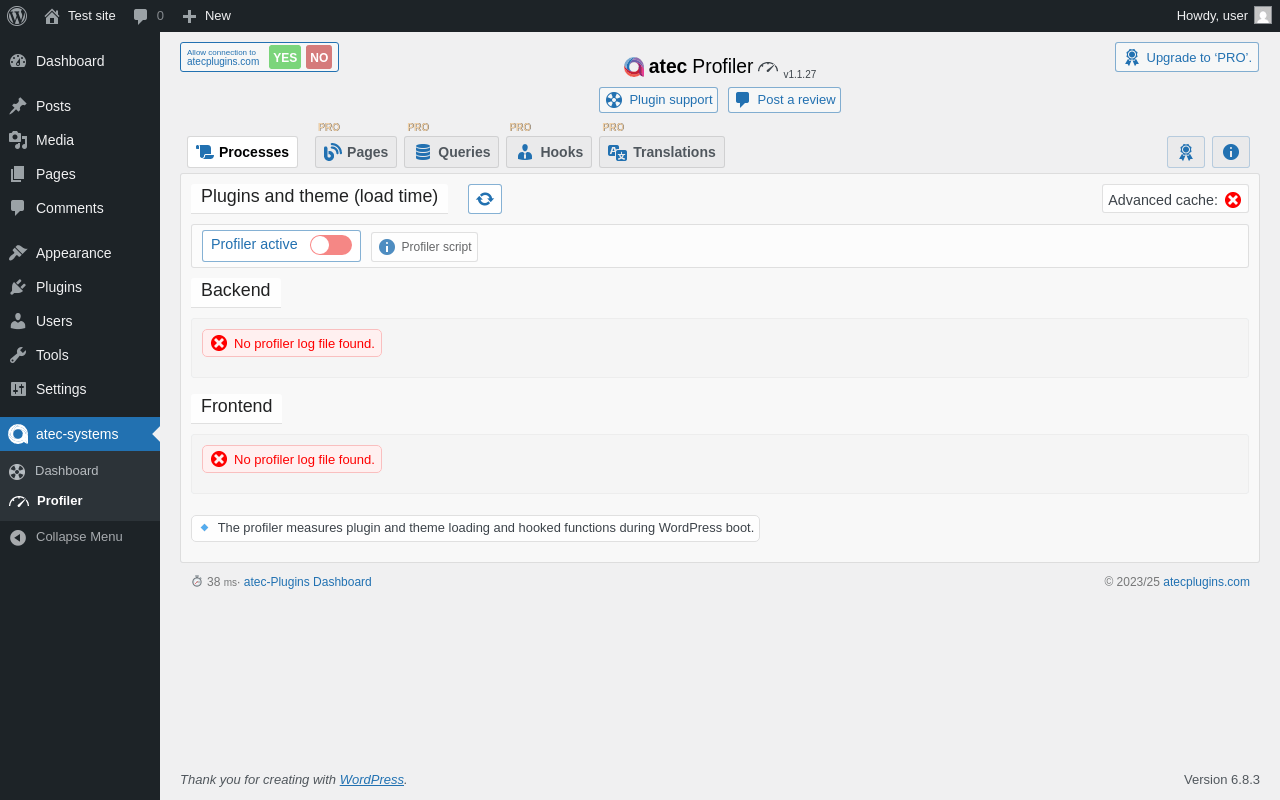
| URL | /wp-admin/admin.php?page=atec_wppr |
|---|---|
| Aspect | menu-item |
| HTTP status | 200 |
| Load time | 0.308 s |
| Memory usage | 3.59 MiB |
| JS errors | None |
| Resource errors | None |
atec-systems → Profiler → Pages
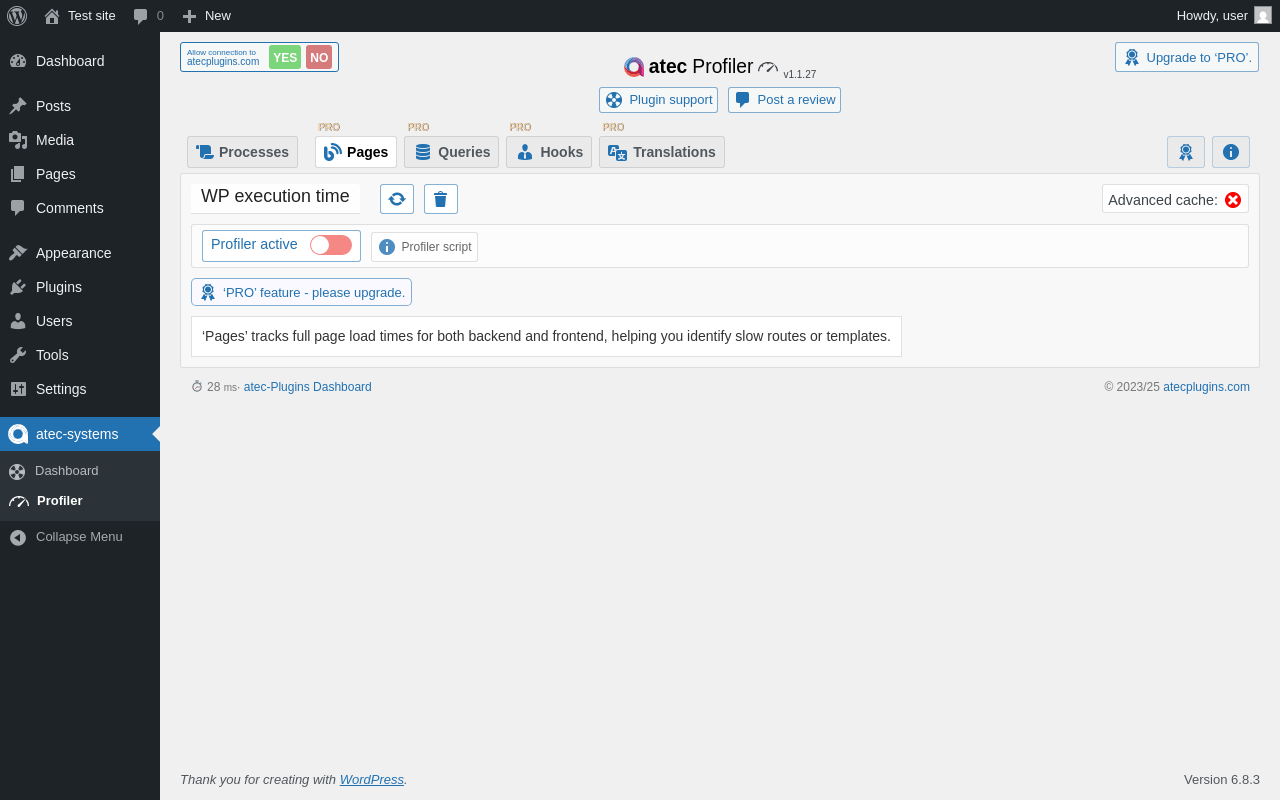
| URL | /wp-admin/admin.php?page=atec_wppr&nav=Pages&_wpnonce=b8330d6e27 |
|---|---|
| Aspect | menu-item-tab |
| HTTP status | 200 |
| Load time | 0.181 s |
| Memory usage | 3.52 MiB |
| JS errors | None |
| Resource errors | None |
atec-systems → Profiler → Queries
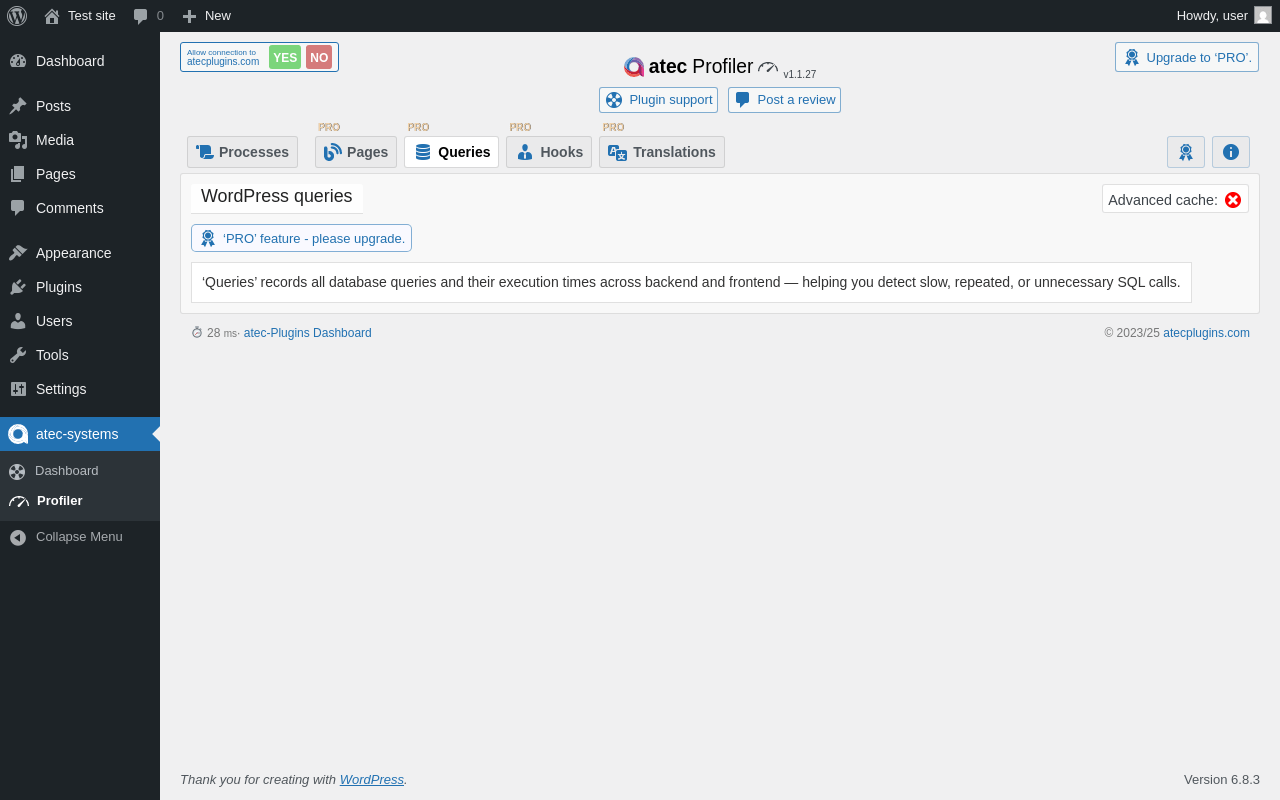
| URL | /wp-admin/admin.php?page=atec_wppr&nav=Queries&_wpnonce=b8330d6e27 |
|---|---|
| Aspect | menu-item-tab |
| HTTP status | 200 |
| Load time | 0.189 s |
| Memory usage | 3.52 MiB |
| JS errors | None |
| Resource errors | None |
atec-systems → Profiler → Hooks

| URL | /wp-admin/admin.php?page=atec_wppr&nav=Hooks&_wpnonce=b8330d6e27 |
|---|---|
| Aspect | menu-item-tab |
| HTTP status | 200 |
| Load time | 0.195 s |
| Memory usage | 3.52 MiB |
| JS errors | None |
| Resource errors | None |
atec-systems → Profiler → Translations
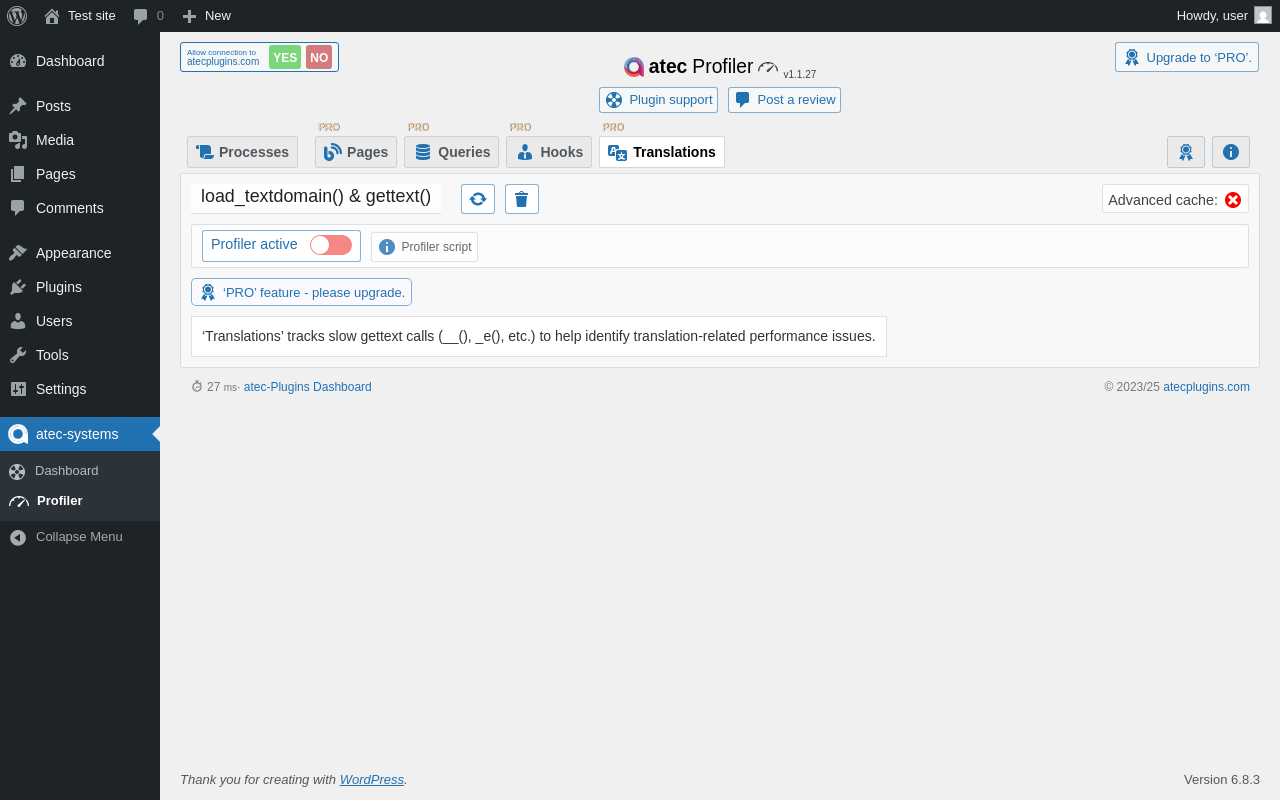
| URL | /wp-admin/admin.php?page=atec_wppr&nav=Translations&_wpnonce=b8330d6e27 |
|---|---|
| Aspect | menu-item-tab |
| HTTP status | 200 |
| Load time | 0.176 s |
| Memory usage | 3.52 MiB |
| JS errors | None |
| Resource errors | None |
atec-systems → Profiler →
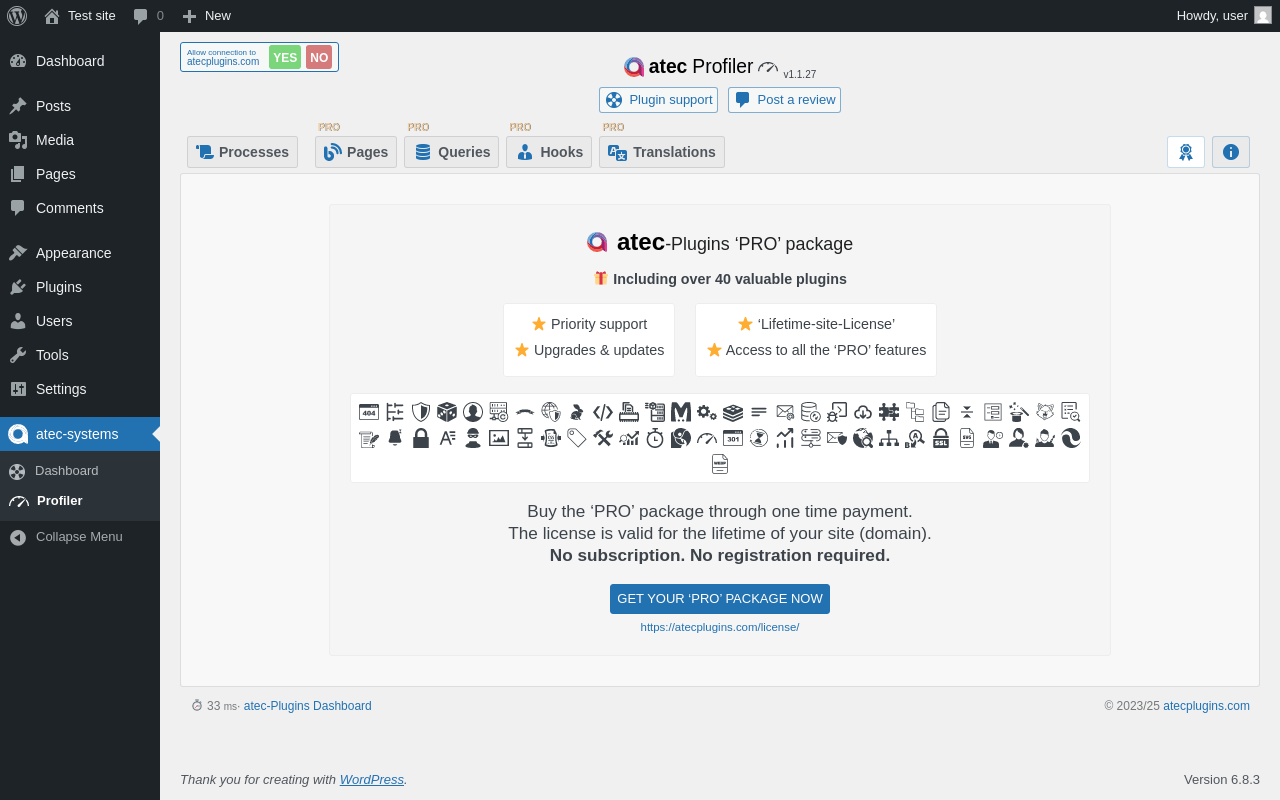
| URL | /wp-admin/admin.php?page=atec_wppr&nav=License&_wpnonce=b8330d6e27 |
|---|---|
| Aspect | menu-item-tab |
| HTTP status | 200 |
| Load time | 0.313 s |
| Memory usage | 3.52 MiB |
| JS errors | None |
| Resource errors | None |
atec-systems → Profiler →
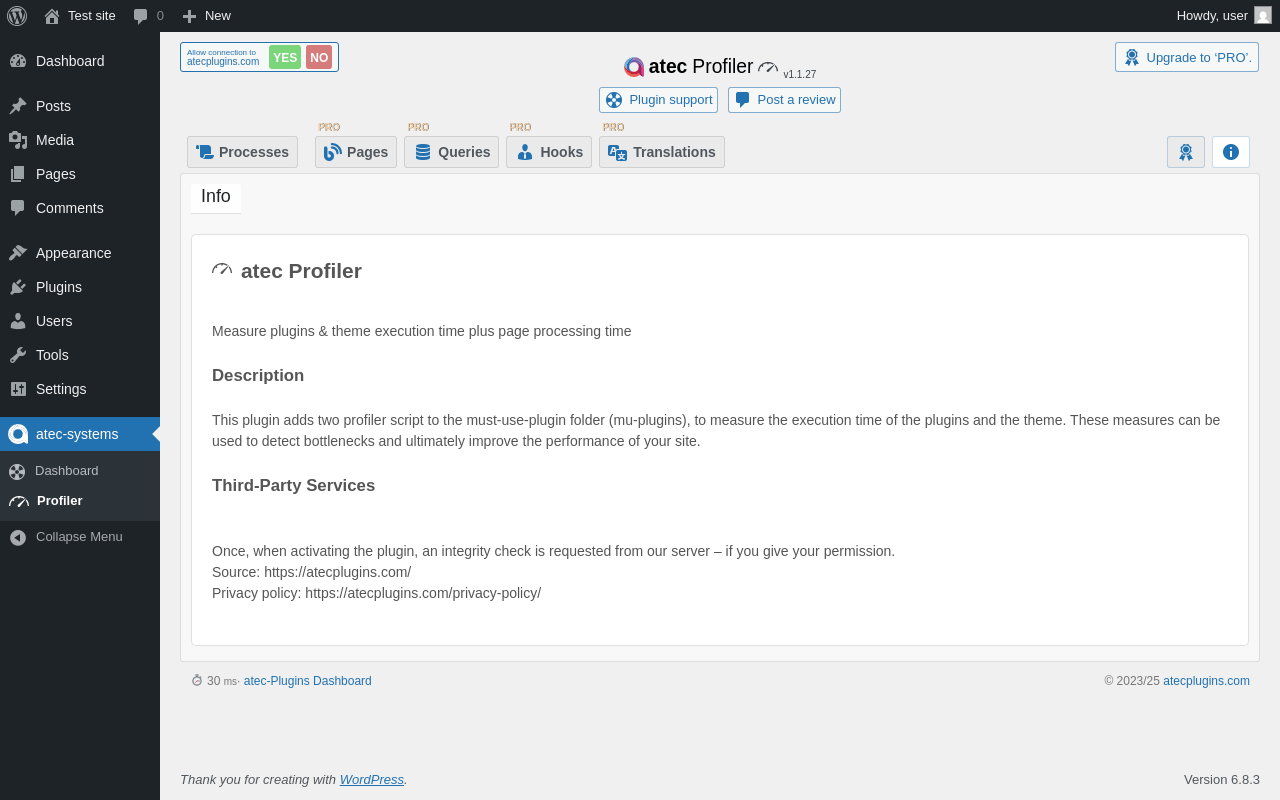
| URL | /wp-admin/admin.php?page=atec_wppr&nav=Info&_wpnonce=b8330d6e27 |
|---|---|
| Aspect | menu-item-tab |
| HTTP status | 200 |
| Load time | 0.208 s |
| Memory usage | 3.52 MiB |
| JS errors | None |
| Resource errors | None |
Test site – Just another WordPress site
| URL | / |
|---|---|
| Aspect | front-page |
| HTTP status | 200 |
| Load time | 0.278 s |
| Memory usage | 3.44 MiB |
| JS errors | None |
| Resource errors | None |
Benchmark
| URL | Load time | Memory usage | ||||
|---|---|---|---|---|---|---|
| Inactive | Active | Change | Inactive | Active | Change | |
| /wp-admin/index.php | 0.384 s | 0.369 s | -0.015 s | 3.51 MiB | 3.53 MiB | + 27.7 KiB |
| /wp-admin/edit.php | 0.224 s | 0.245 s | +0.021 s | 3.57 MiB | 3.6 MiB | + 27.7 KiB |
| /wp-admin/post-new.php | 0.833 s | 0.707 s | -0.126 s | 6.06 MiB | 6.09 MiB | + 32.13 KiB |
| /wp-admin/upload.php | 0.841 s | 0.350 s | -0.491 s | 3.52 MiB | 3.53 MiB | + 10.92 KiB |
| /wp-admin/options-writing.php | 0.203 s | 0.203 s | +0.000 s | 3.5 MiB | 3.51 MiB | + 14.3 KiB |
| /wp-admin/media-new.php | 0.276 s | 0.351 s | +0.075 s | 3.49 MiB | 3.51 MiB | + 22.48 KiB |
| /wp-admin/edit-tags.php?taxonomy=category | 0.171 s | 0.184 s | +0.013 s | 3.5 MiB | 3.54 MiB | + 33.19 KiB |
| /wp-admin/post-new.php?post_type=page | 0.734 s | 0.629 s | -0.105 s | 6.05 MiB | 6.08 MiB | + 27.67 KiB |
| /wp-admin/options-discussion.php | 0.270 s | 0.249 s | -0.021 s | 3.5 MiB | 3.51 MiB | + 10.8 KiB |
| /wp-admin/edit-comments.php | 0.223 s | 0.208 s | -0.015 s | 3.52 MiB | 3.53 MiB | + 10.3 KiB |
| / | 0.334 s | 0.197 s | -0.137 s | 3.5 MiB | 3.44 MiB | - 62.2 KiB |
| Average | 0.408 s | 0.336 s | -0.073 s | 3.98 MiB | 3.99 MiB | + 14.09 KiB |
Code Statistics
Note: Third-party libraries and minified JS/CSS files are excluded from these statistics where possible, so the numbers you see here may be lower than those reported by other tools.
| Language | % | Lines of code | Comment lines | Files | |
|---|---|---|---|---|---|
| PHP | 90.6% | 4,047 | 168 | 25 | |
| CSS | 9.1% | 407 | 21 | 2 | |
| JavaScript | 0.2% | 11 | 0 | 2 | |
| Total | 4,465 | 189 | 29 | ||
PHP Code Analysis | More results »
| Lines of code | 3,936 |
|---|---|
| Total complexity | 940 |
| Median class complexity | 16.5 |
| Median method complexity | 2.0 |
| Most complex class | ATEC\TOOLS |
| Most complex function | ATEC\DASHBOARD::plugin_div() |
| Classes | 18 |
|---|---|
| Methods | 285 |
| Functions | 3 |
Additions
Things that the plugin adds to the site. This section is not intended to be comprehensive. The test tool only looks for a few specific types of added content.
No new entries found.
PHP Error Log
The log file is empty.