atec Profiler 1.1.21
Does atec Profiler work with WordPress 6.8.2 and PHP 8.1.12? A smoke test was performed on .
Summary
| No PHP errors, warnings or notices | |
| No JavaScript exceptions | |
| All test pages loaded successfully | |
| No resource errors | |
| Looks good! No problems were detected. |
Memory usage: 16.91 KiB
The average PHP memory usage increased by this amount after activating by the plugin.
Page speed impact:
insignificant.
The plugin didn't make the site noticeably slower.
| WordPress version | 6.8.2 |
|---|---|
| PHP version | 8.1.12 |
| MySQL version | 10.6.10 |
| PHP memory limit | 512M |
| Last updated | |
|---|---|
| Active installs | <10 |
| WordPress.org page | https://wordpress.org/plugins/atec-profiler/ |
| Badges |
|
Pages 10
Plugins ‹ Test site — WordPress
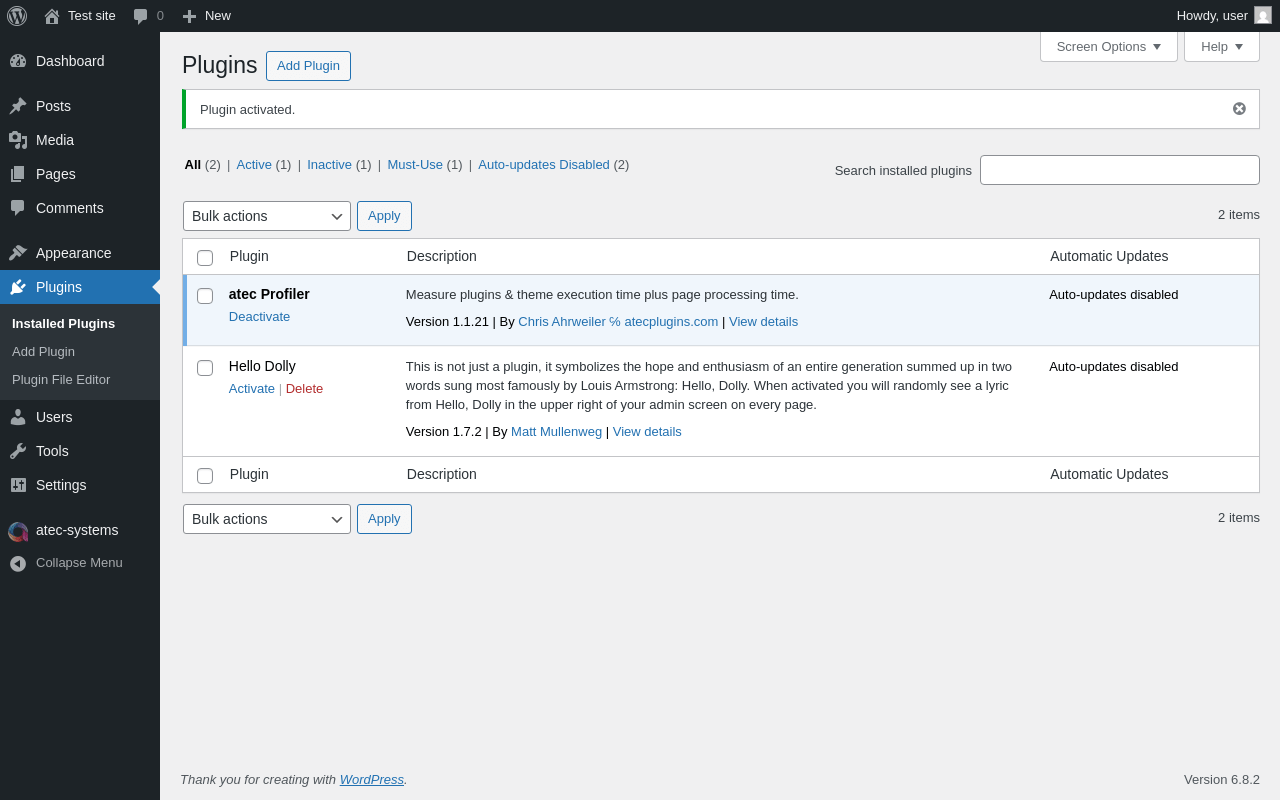
| URL | /wp-admin/plugins.php?plugin_status=all&paged=1&s |
|---|---|
| Requested URL | /wp-admin/plugins.php?action=activate&plugin=atec-profiler%2Fatec-profiler.php&plugin_status=all&paged=1&s&_wpnonce=a15be603cf |
| Aspect | after-activation |
| HTTP status | 200 |
| Load time | 0.274 s |
| Memory usage | 3.55 MiB |
| JS errors | None |
| Resource errors | None |
atec-systems
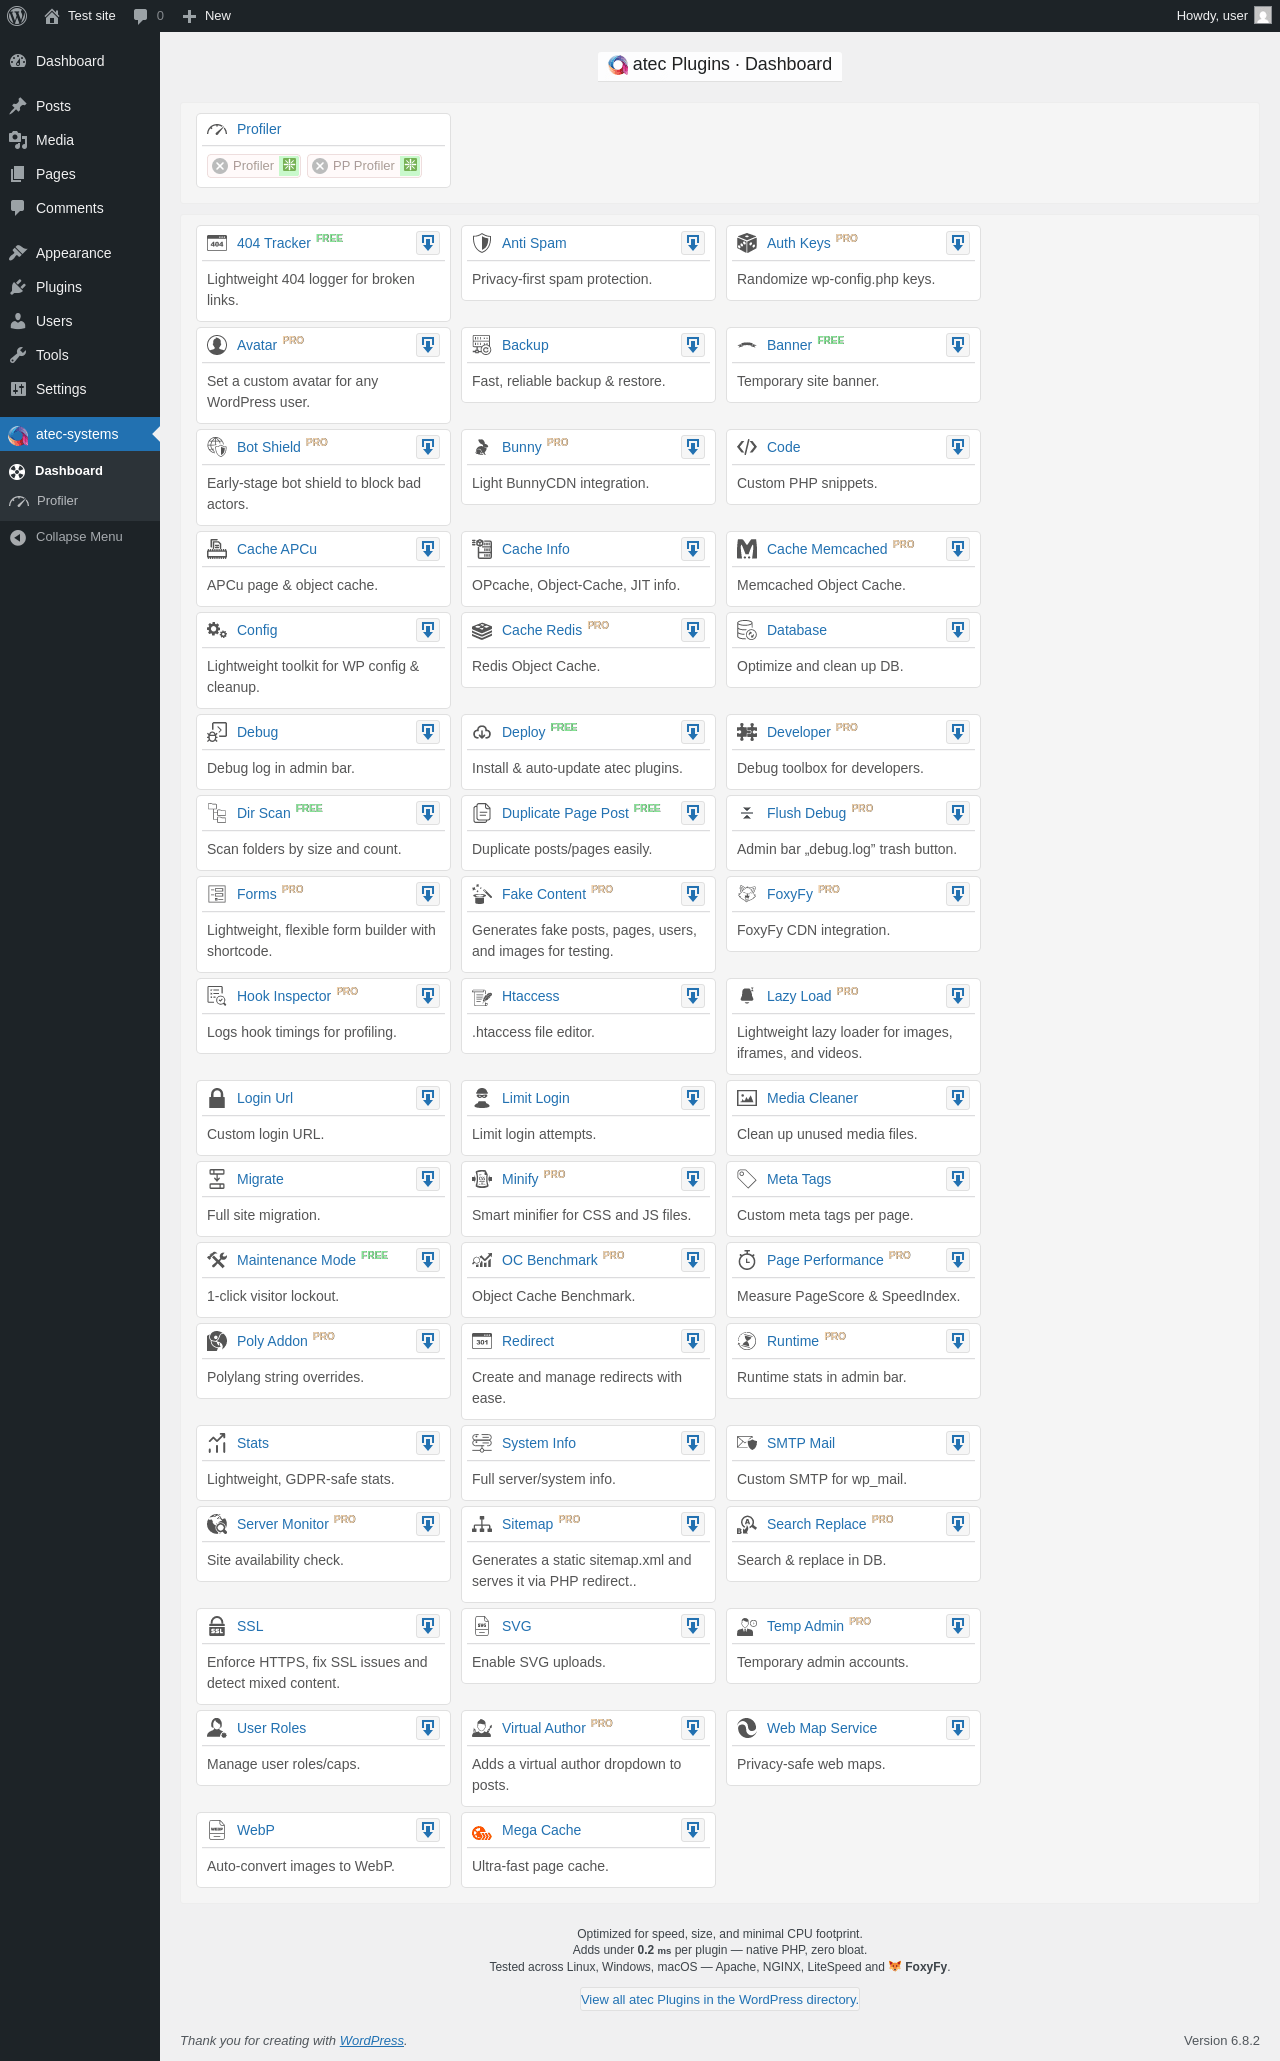
| URL | /wp-admin/admin.php?page=atec_group |
|---|---|
| Aspect | menu-item |
| HTTP status | 200 |
| Load time | 0.456 s |
| Memory usage | 3.69 MiB |
| JS errors | None |
| Resource errors | None |
atec-systems → Profiler
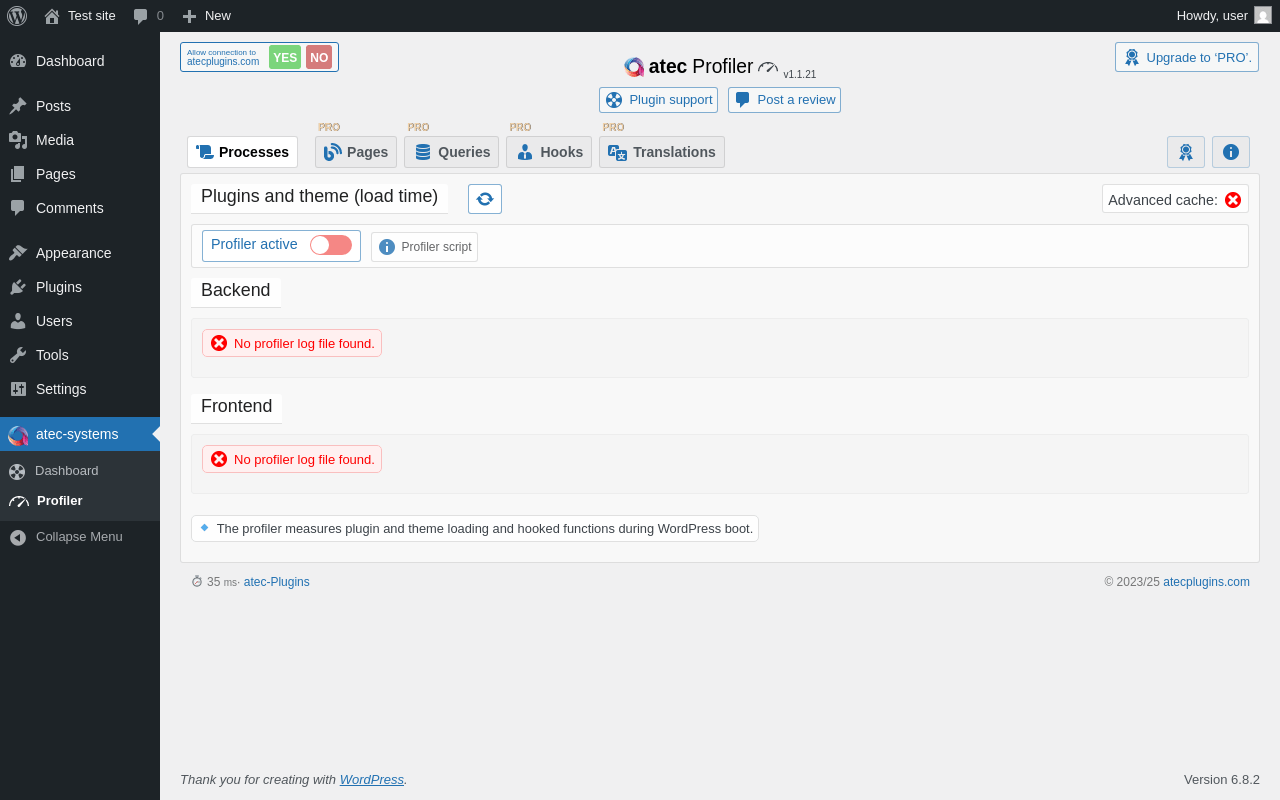
| URL | /wp-admin/admin.php?page=atec_wppr |
|---|---|
| Aspect | menu-item |
| HTTP status | 200 |
| Load time | 0.360 s |
| Memory usage | 3.6 MiB |
| JS errors | None |
| Resource errors | None |
atec-systems → Profiler → Pages
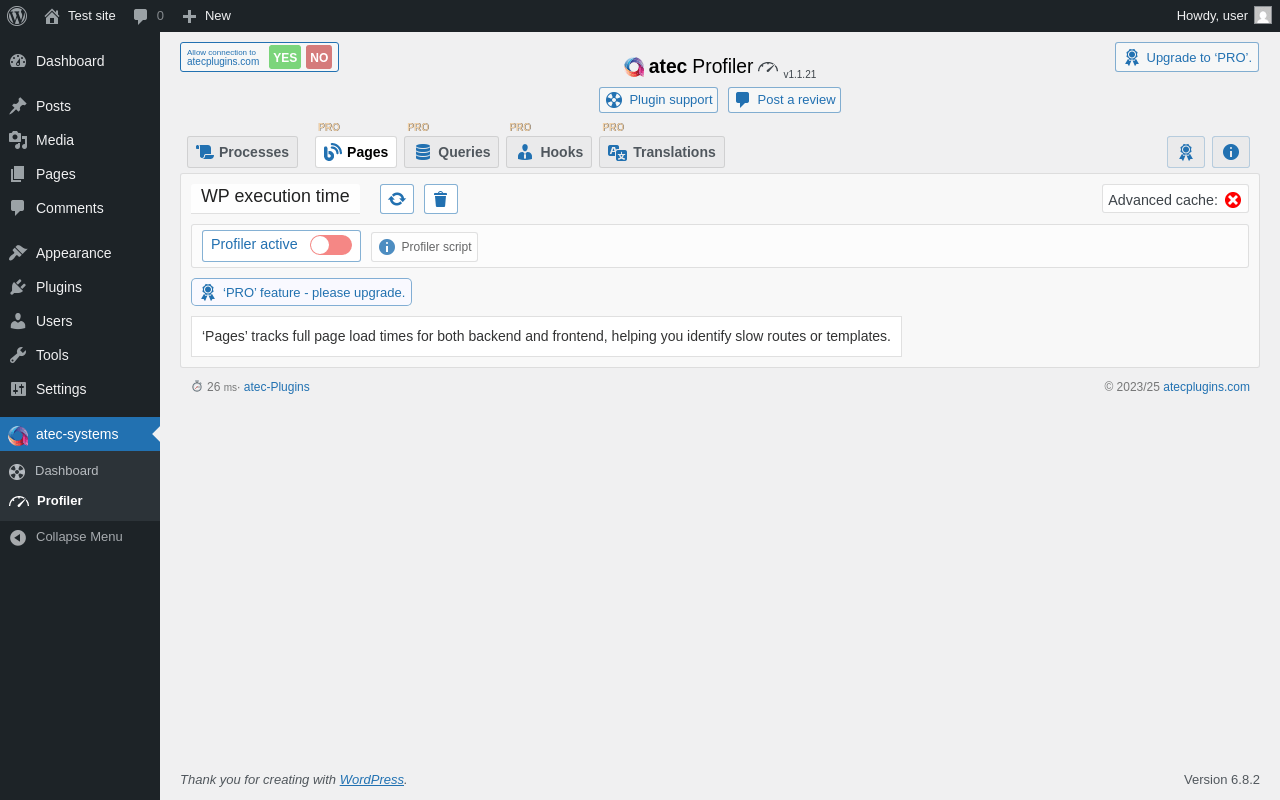
| URL | /wp-admin/admin.php?page=atec_wppr&nav=Pages&_wpnonce=71d72e37ce |
|---|---|
| Aspect | menu-item-tab |
| HTTP status | 200 |
| Load time | 0.199 s |
| Memory usage | 3.52 MiB |
| JS errors | None |
| Resource errors | None |
atec-systems → Profiler → Queries

| URL | /wp-admin/admin.php?page=atec_wppr&nav=Queries&_wpnonce=71d72e37ce |
|---|---|
| Aspect | menu-item-tab |
| HTTP status | 200 |
| Load time | 0.207 s |
| Memory usage | 3.52 MiB |
| JS errors | None |
| Resource errors | None |
atec-systems → Profiler → Hooks

| URL | /wp-admin/admin.php?page=atec_wppr&nav=Hooks&_wpnonce=71d72e37ce |
|---|---|
| Aspect | menu-item-tab |
| HTTP status | 200 |
| Load time | 0.210 s |
| Memory usage | 3.52 MiB |
| JS errors | None |
| Resource errors | None |
atec-systems → Profiler → Translations
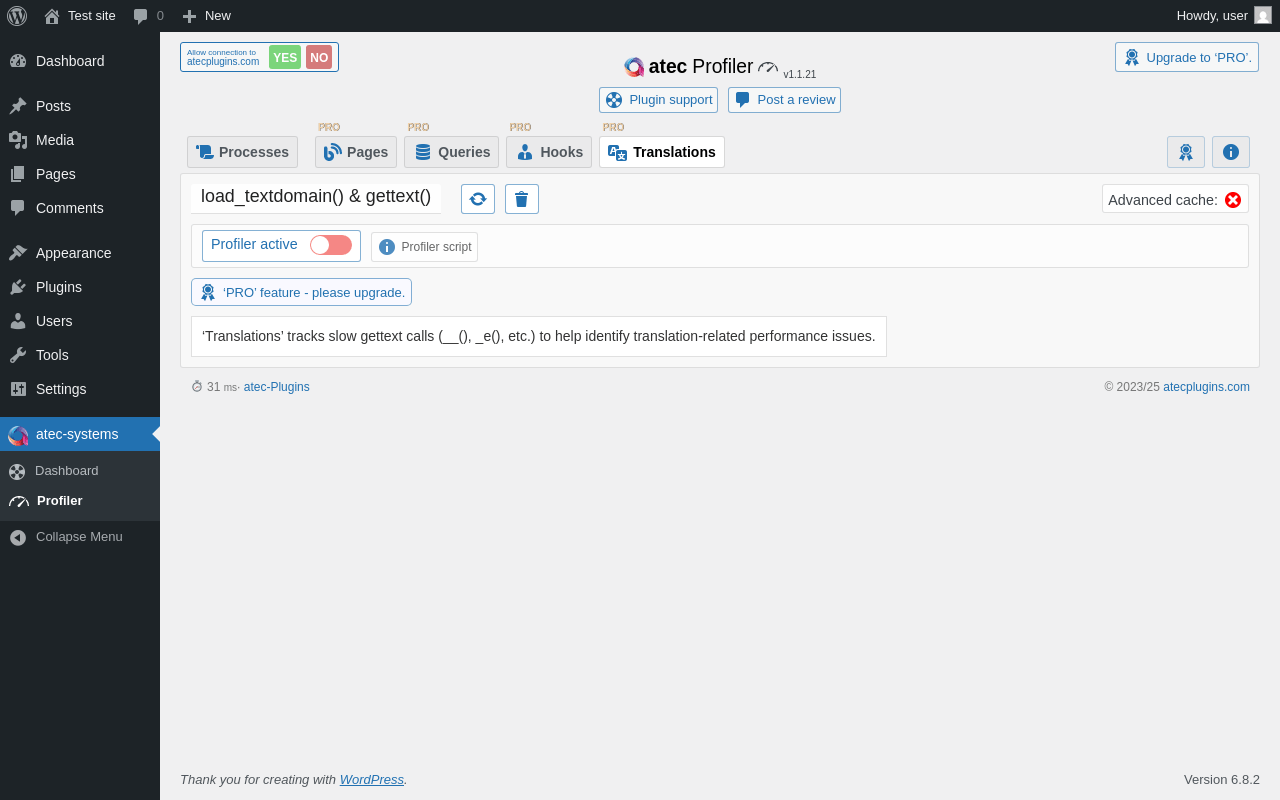
| URL | /wp-admin/admin.php?page=atec_wppr&nav=Translations&_wpnonce=71d72e37ce |
|---|---|
| Aspect | menu-item-tab |
| HTTP status | 200 |
| Load time | 0.237 s |
| Memory usage | 3.52 MiB |
| JS errors | None |
| Resource errors | None |
atec-systems → Profiler →
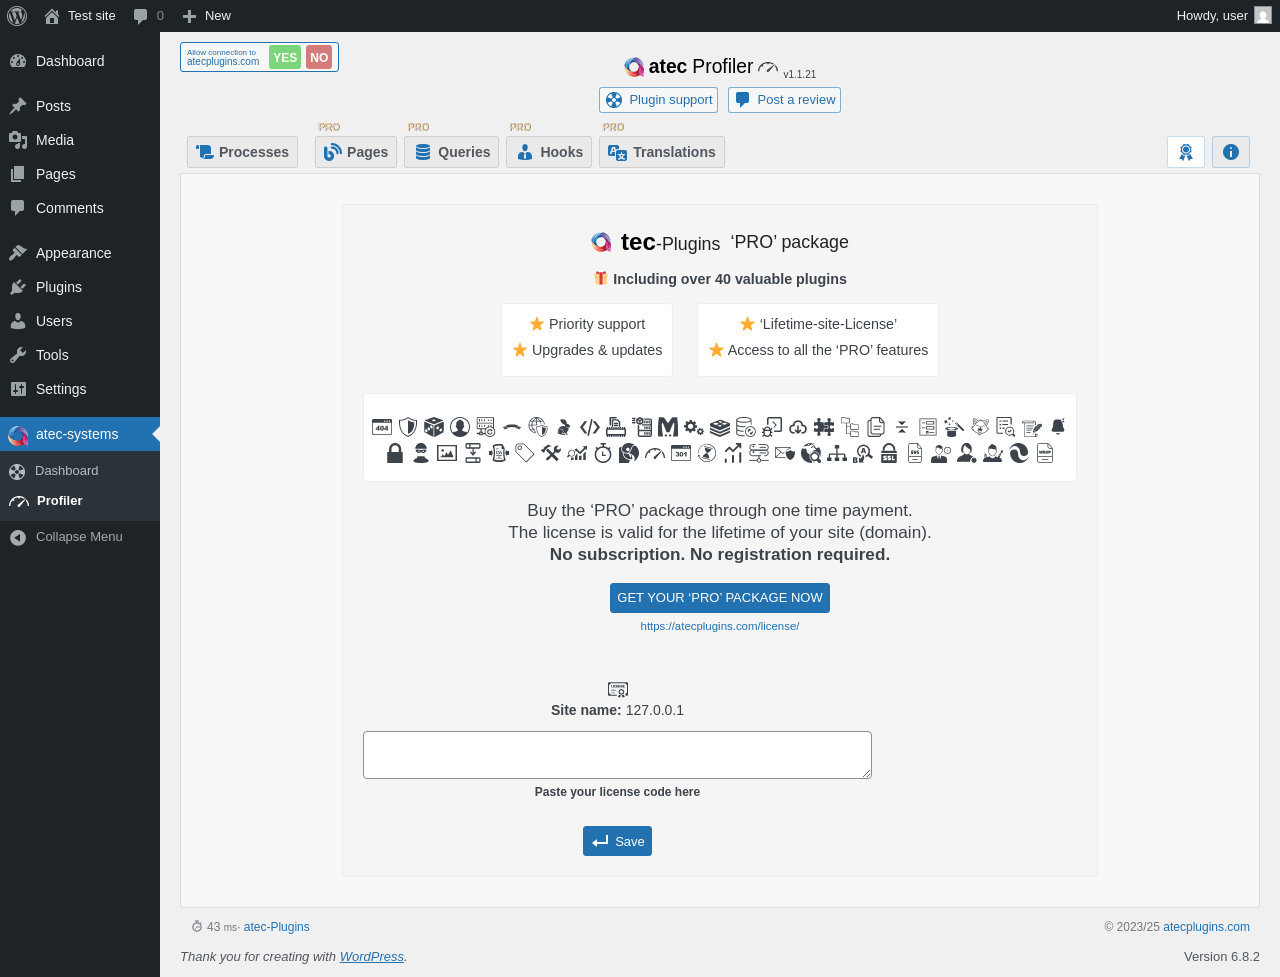
| URL | /wp-admin/admin.php?page=atec_wppr&nav=License&_wpnonce=71d72e37ce |
|---|---|
| Aspect | menu-item-tab |
| HTTP status | 200 |
| Load time | 0.378 s |
| Memory usage | 3.52 MiB |
| JS errors | None |
| Resource errors | None |
atec-systems → Profiler →
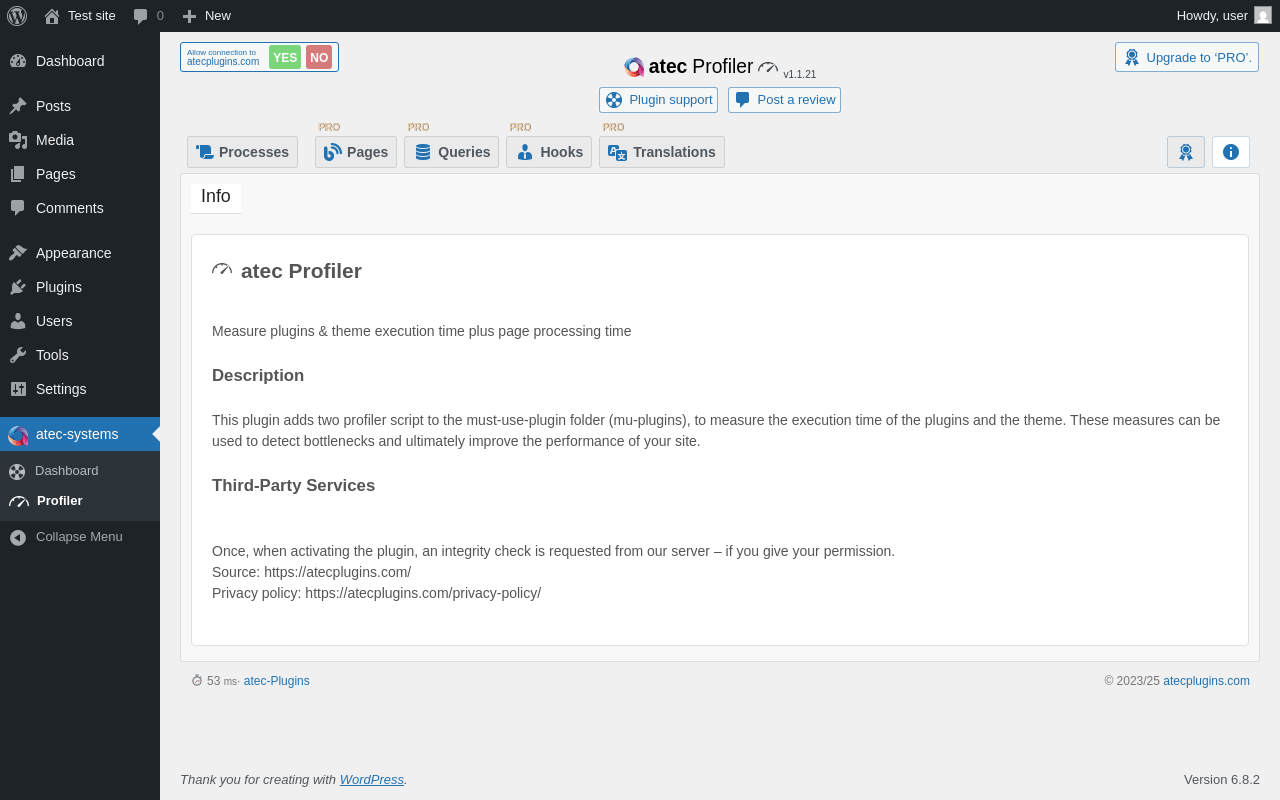
| URL | /wp-admin/admin.php?page=atec_wppr&nav=Info&_wpnonce=71d72e37ce |
|---|---|
| Aspect | menu-item-tab |
| HTTP status | 200 |
| Load time | 0.268 s |
| Memory usage | 3.52 MiB |
| JS errors | None |
| Resource errors | None |
Test site – Just another WordPress site
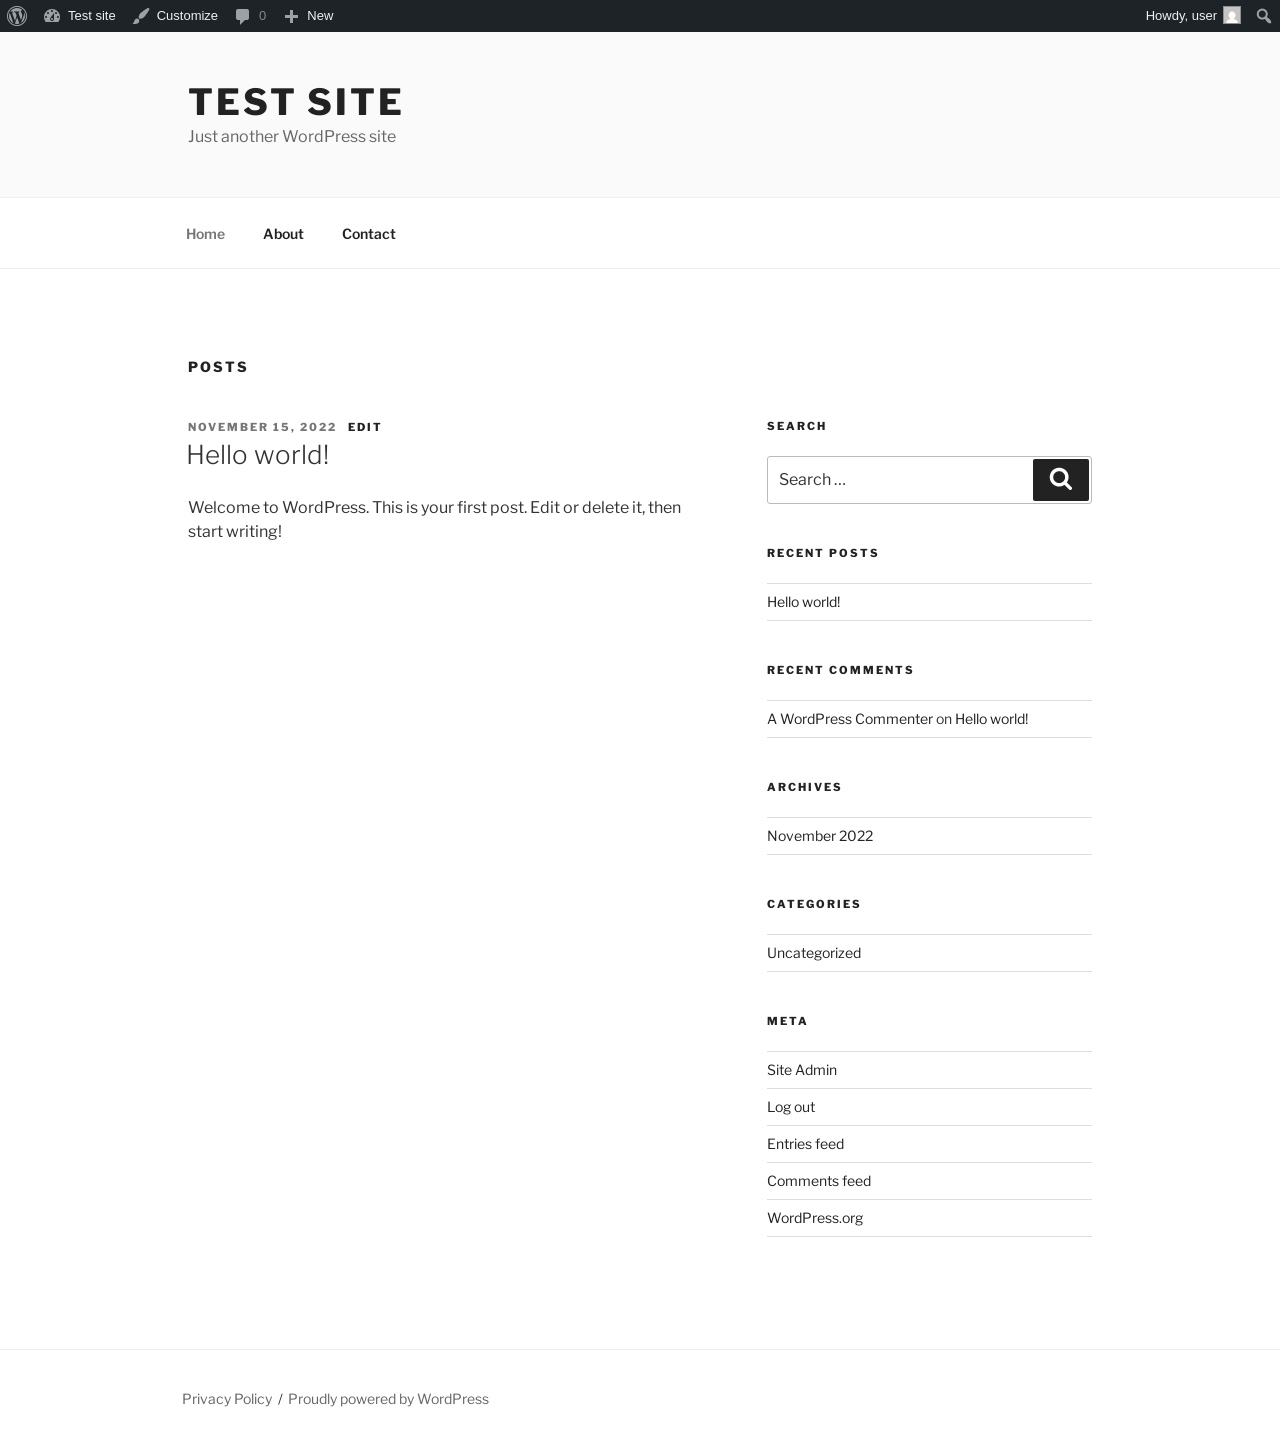
| URL | / |
|---|---|
| Aspect | front-page |
| HTTP status | 200 |
| Load time | 0.198 s |
| Memory usage | 3.44 MiB |
| JS errors | None |
| Resource errors | None |
Benchmark
| URL | Load time | Memory usage | ||||
|---|---|---|---|---|---|---|
| Inactive | Active | Change | Inactive | Active | Change | |
| /wp-admin/index.php | 0.350 s | 0.352 s | +0.002 s | 3.51 MiB | 3.53 MiB | + 24.15 KiB |
| /wp-admin/edit.php | 0.208 s | 0.350 s | +0.142 s | 3.57 MiB | 3.6 MiB | + 24.15 KiB |
| /wp-admin/post-new.php | 0.838 s | 1.057 s | +0.219 s | 6.06 MiB | 6.09 MiB | + 28.58 KiB |
| /wp-admin/upload.php | 0.847 s | 0.357 s | -0.490 s | 3.52 MiB | 3.53 MiB | + 7.37 KiB |
| /wp-admin/options-writing.php | 0.241 s | 0.189 s | -0.052 s | 3.5 MiB | 3.51 MiB | + 10.74 KiB |
| /wp-admin/media-new.php | 0.284 s | 0.214 s | -0.070 s | 3.49 MiB | 3.51 MiB | + 18.93 KiB |
| /wp-admin/edit-tags.php?taxonomy=category | 0.254 s | 0.200 s | -0.054 s | 3.5 MiB | 3.53 MiB | + 29.63 KiB |
| /wp-admin/post-new.php?post_type=page | 0.778 s | 0.815 s | +0.037 s | 6.05 MiB | 6.07 MiB | + 24.12 KiB |
| /wp-admin/options-discussion.php | 0.433 s | 0.354 s | -0.079 s | 3.5 MiB | 3.51 MiB | + 7.25 KiB |
| /wp-admin/edit-comments.php | 0.436 s | 0.225 s | -0.211 s | 3.52 MiB | 3.53 MiB | + 6.74 KiB |
| / | 0.344 s | 0.233 s | -0.111 s | 3.43 MiB | 3.44 MiB | + 4.34 KiB |
| Average | 0.456 s | 0.395 s | -0.061 s | 3.97 MiB | 3.99 MiB | + 16.91 KiB |
Code Statistics
Note: Third-party libraries and minified JS/CSS files are excluded from these statistics where possible, so the numbers you see here may be lower than those reported by other tools.
| Language | % | Lines of code | Comment lines | Files | |
|---|---|---|---|---|---|
| PHP | 91.4% | 4,422 | 187 | 30 | |
| CSS | 8.4% | 406 | 21 | 2 | |
| JavaScript | 0.2% | 11 | 0 | 2 | |
| Total | 4,839 | 208 | 34 | ||
PHP Code Analysis | More results »
| Lines of code | 4,309 |
|---|---|
| Total complexity | 1,025 |
| Median class complexity | 15.5 |
| Median method complexity | 2.0 |
| Most complex class | ATEC\TOOLS |
| Most complex function | ATEC\DASHBOARD::plugin_div() |
| Classes | 24 |
|---|---|
| Methods | 299 |
| Functions | 3 |
Additions
Things that the plugin adds to the site. This section is not intended to be comprehensive. The test tool only looks for a few specific types of added content.
No new entries found.
PHP Error Log
The log file is empty.