atec Profiler 1.0.6
Does atec Profiler work with WordPress 6.8.1 and PHP 8.1.12? A smoke test was performed on .
Summary
| 1 | PHP fatal errors |
| No JavaScript exceptions | |
| All test pages loaded successfully | |
| No resource errors |
Memory usage: 8.1 KiB
The average PHP memory usage increased by this amount after activating by the plugin.
Page speed impact:
insignificant.
The plugin didn't make the site noticeably slower.
| WordPress version | 6.8.1 |
|---|---|
| PHP version | 8.1.12 |
| MySQL version | 10.6.10 |
| PHP memory limit | 512M |
| Last updated | |
|---|---|
| Active installs | <10 |
| WordPress.org page | https://wordpress.org/plugins/atec-profiler/ |
| Badges |
|
Pages 9
Plugins ‹ Test site — WordPress
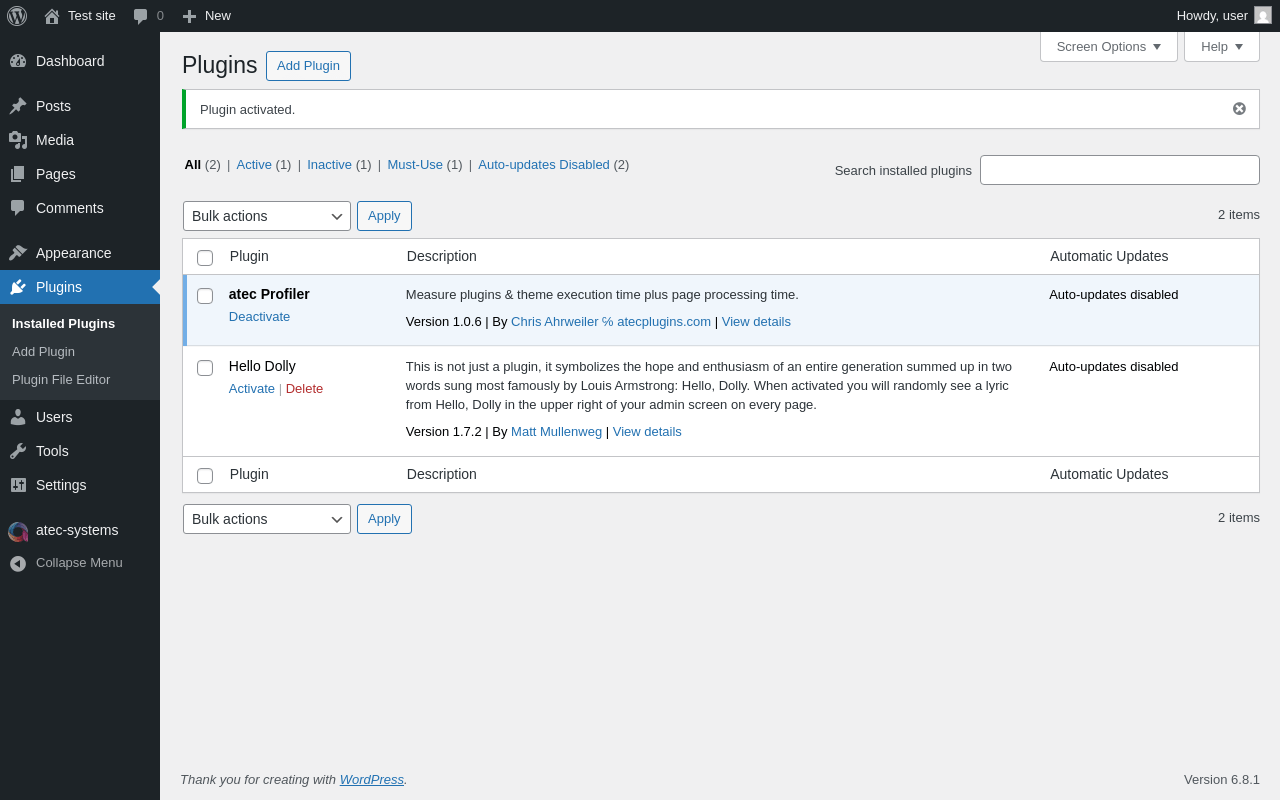
| URL | /wp-admin/plugins.php?plugin_status=all&paged=1&s |
|---|---|
| Requested URL | /wp-admin/plugins.php?action=activate&plugin=atec-profiler%2Fatec-profiler.php&plugin_status=all&paged=1&s&_wpnonce=2622b06a11 |
| Aspect | after-activation |
| HTTP status | 200 |
| Load time | 0.399 s |
| Memory usage | 3.54 MiB |
| JS errors | None |
| Resource errors | None |
atec-systems

| URL | /wp-admin/admin.php?page=atec_group |
|---|---|
| Aspect | menu-item |
| HTTP status | 200 |
| Load time | 0.633 s |
| Memory usage | 3.57 MiB |
| JS errors | None |
| Resource errors | None |
atec-systems → Dashboard
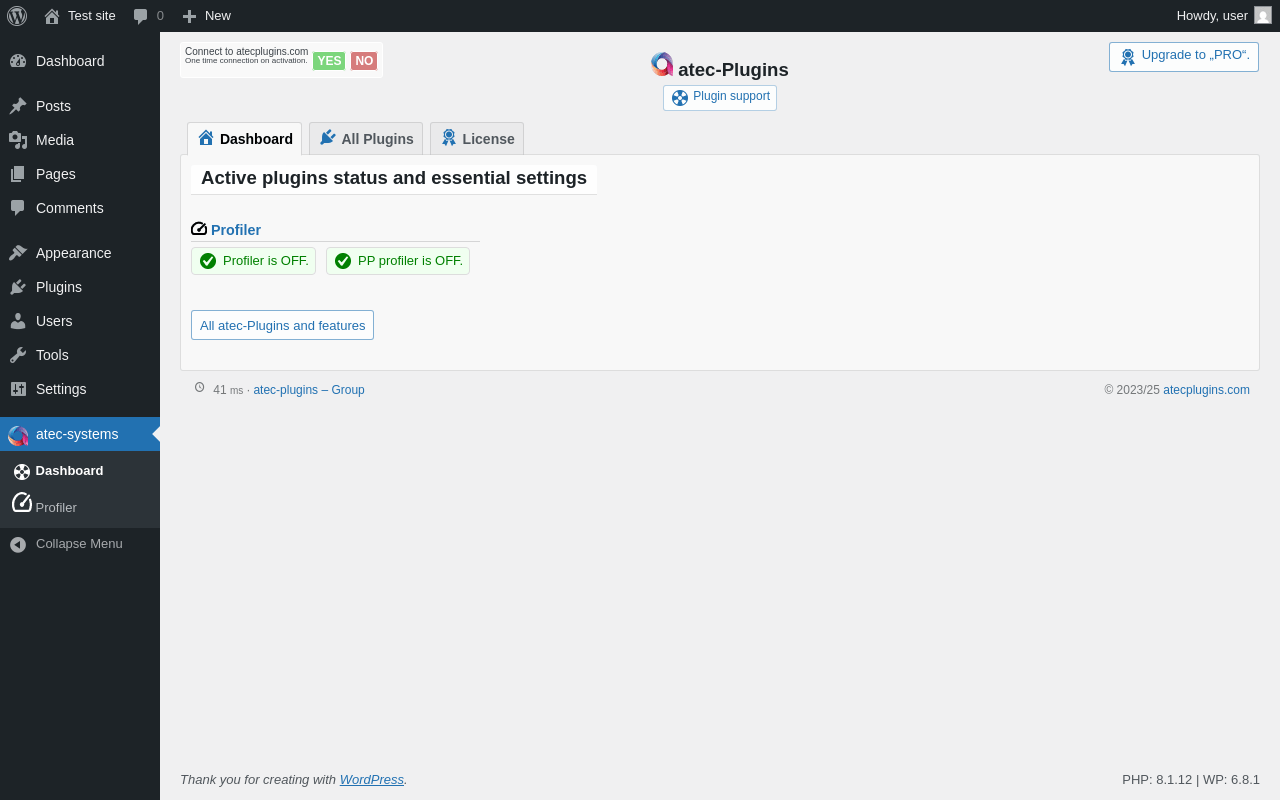
| URL | /wp-admin/admin.php?page=atec_group&nav=Dashboard&_wpnonce=ca3c6f97d0 |
|---|---|
| Aspect | menu-item-tab |
| HTTP status | 200 |
| Load time | 0.217 s |
| Memory usage | 3.5 MiB |
| JS errors | None |
| Resource errors | None |
atec-systems → License
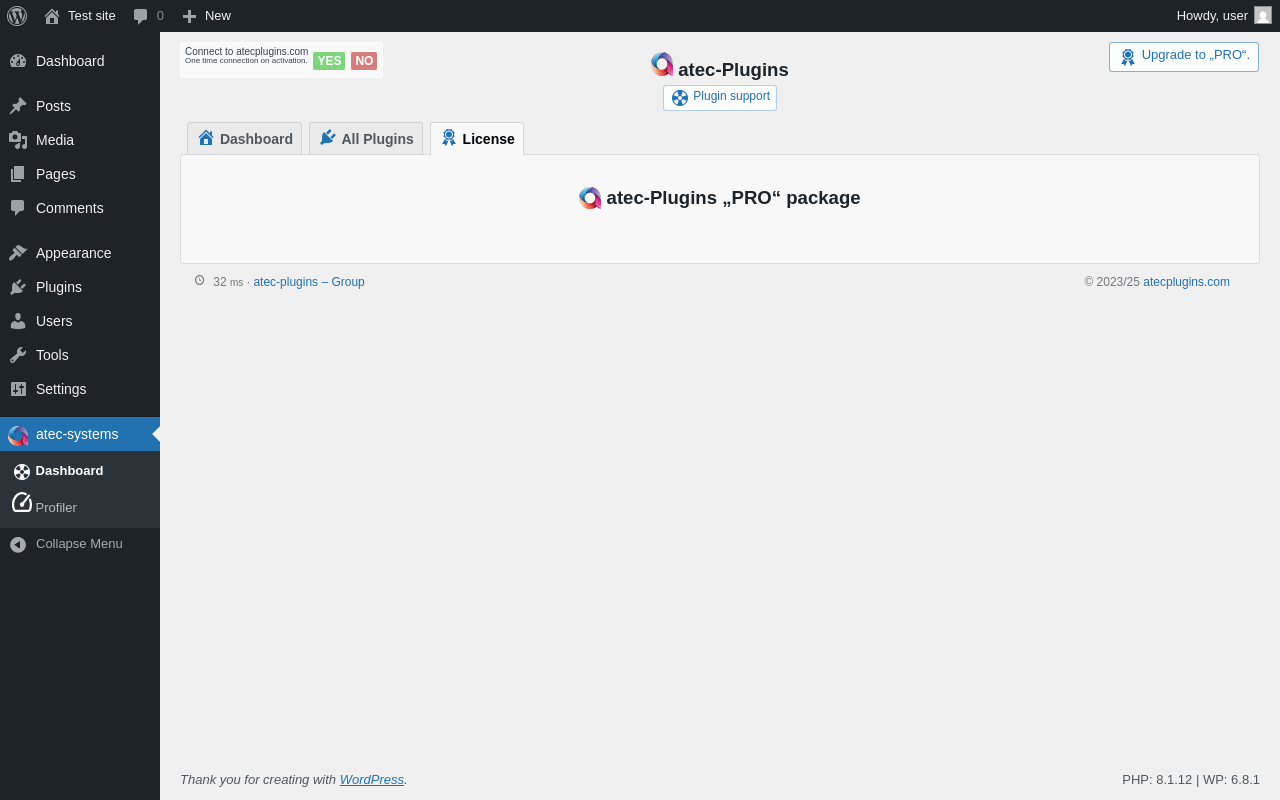
| URL | /wp-admin/admin.php?page=atec_group&nav=License&_wpnonce=ca3c6f97d0 |
|---|---|
| Aspect | menu-item-tab |
| HTTP status | 200 |
| Load time | 0.428 s |
| Memory usage | 3.5 MiB |
| JS errors | None |
| Resource errors | None |
atec-systems → Profiler

| URL | /wp-admin/admin.php?page=atec_wppr |
|---|---|
| Aspect | menu-item |
| HTTP status | 200 |
| Load time | 0.252 s |
| Memory usage | 3.54 MiB |
| JS errors | None |
| Resource errors | None |
atec-systems → Profiler → Pages
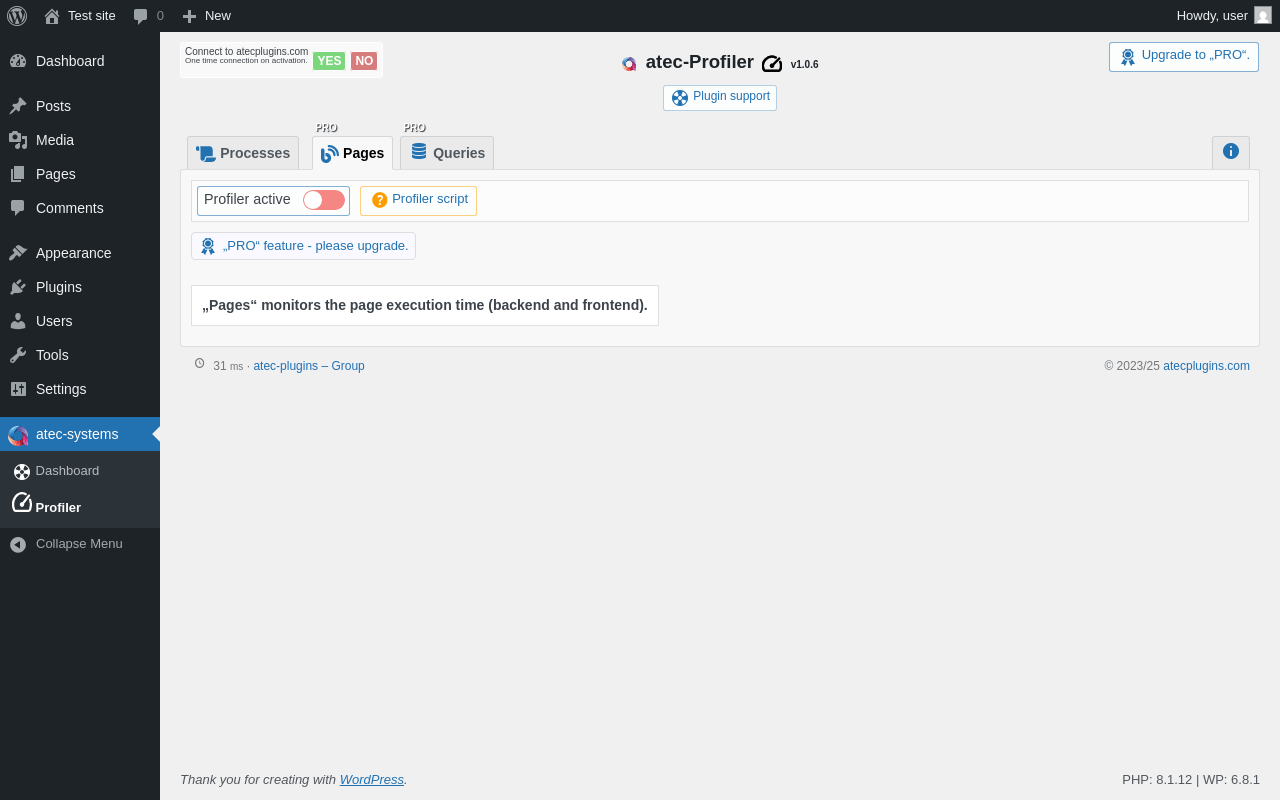
| URL | /wp-admin/admin.php?page=atec_wppr&nav=Pages&_wpnonce=80acfc8682 |
|---|---|
| Aspect | menu-item-tab |
| HTTP status | 200 |
| Load time | 0.205 s |
| Memory usage | 3.5 MiB |
| JS errors | None |
| Resource errors | None |
atec-systems → Profiler → Queries
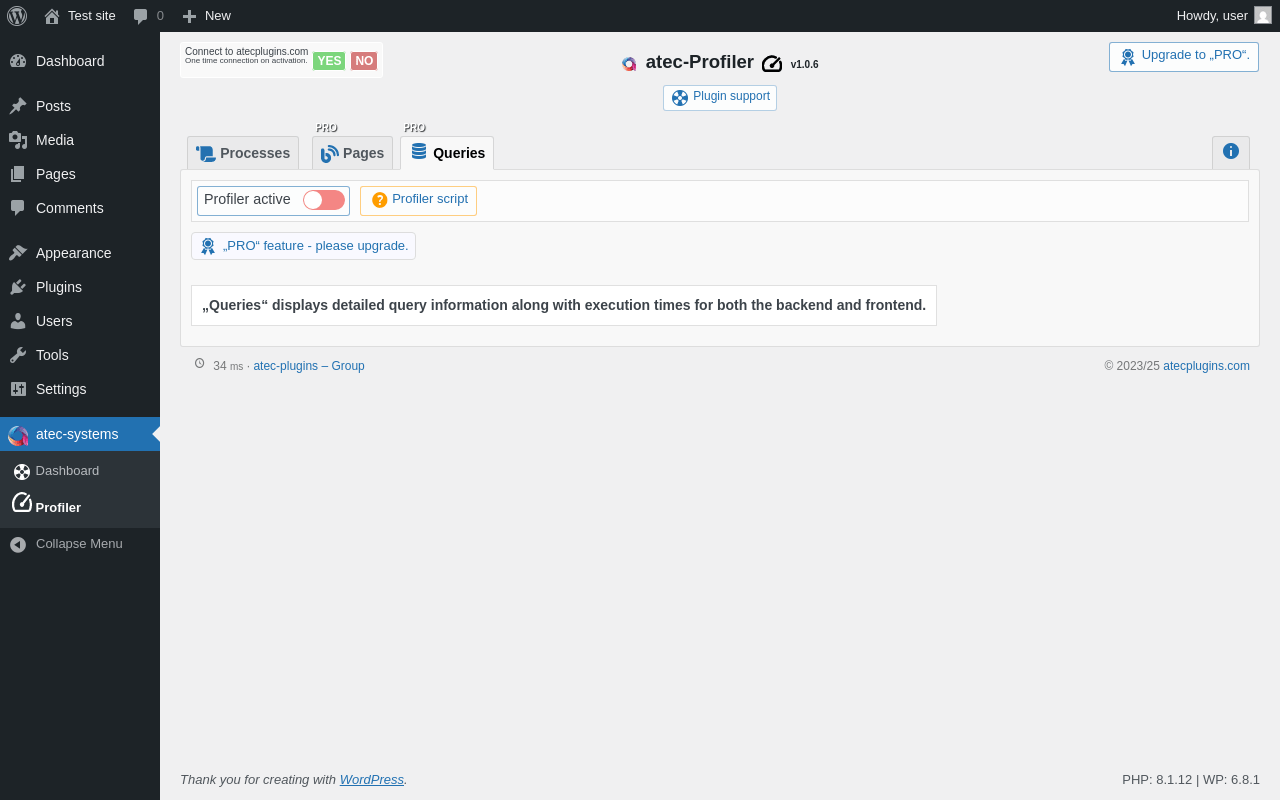
| URL | /wp-admin/admin.php?page=atec_wppr&nav=Queries&_wpnonce=80acfc8682 |
|---|---|
| Aspect | menu-item-tab |
| HTTP status | 200 |
| Load time | 0.215 s |
| Memory usage | 3.5 MiB |
| JS errors | None |
| Resource errors | None |
atec-systems → Profiler →
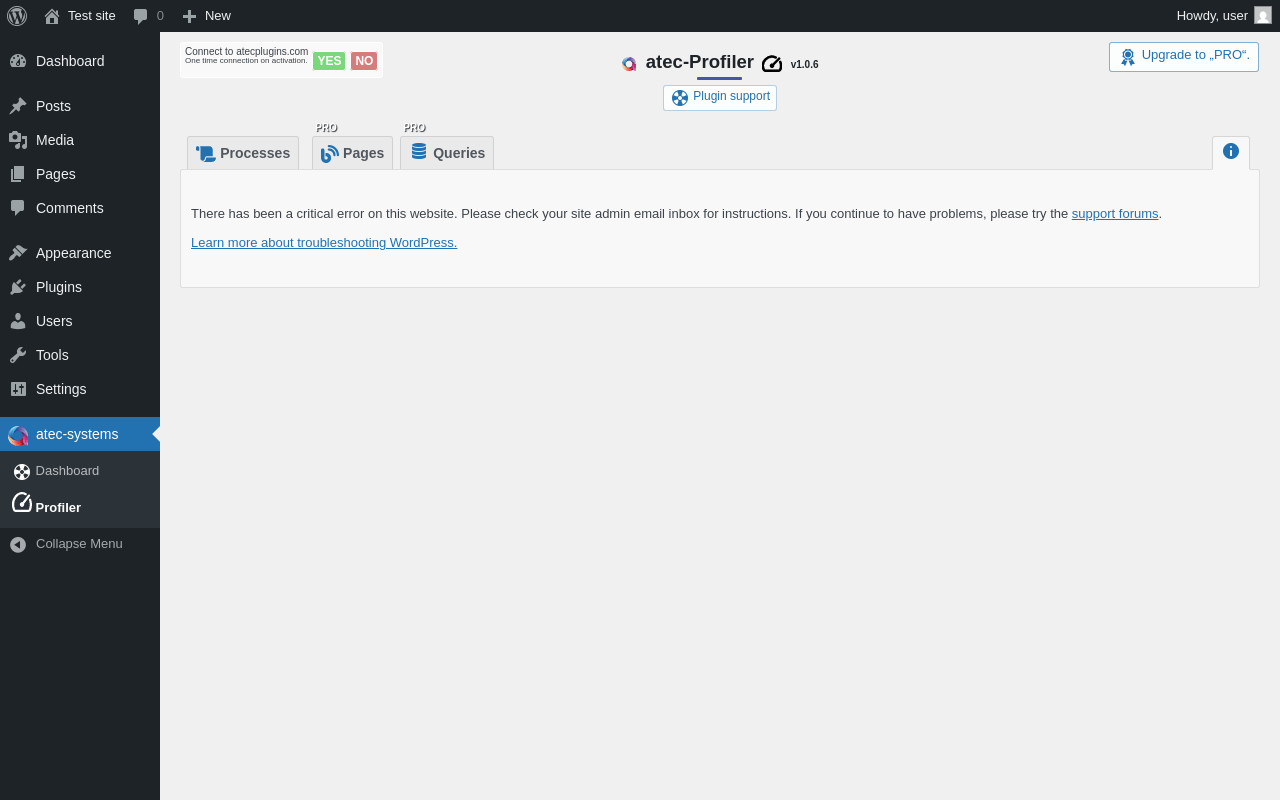
| URL | /wp-admin/admin.php?page=atec_wppr&nav=Info&_wpnonce=80acfc8682 |
|---|---|
| Aspect | menu-item-tab |
| HTTP status | 200 |
| Load time | 0.183 s |
| Memory usage | N/A |
| JS errors | None |
| Resource errors | None |
Test site – Just another WordPress site

| URL | / |
|---|---|
| Aspect | front-page |
| HTTP status | 200 |
| Load time | 0.209 s |
| Memory usage | 3.43 MiB |
| JS errors | None |
| Resource errors | None |
Benchmark
| URL | Load time | Memory usage | ||||
|---|---|---|---|---|---|---|
| Inactive | Active | Change | Inactive | Active | Change | |
| /wp-admin/index.php | 0.335 s | 0.538 s | +0.203 s | 3.51 MiB | 3.52 MiB | + 14.87 KiB |
| /wp-admin/edit.php | 0.204 s | 0.342 s | +0.138 s | 3.57 MiB | 3.59 MiB | + 14.87 KiB |
| /wp-admin/post-new.php | 0.762 s | 1.094 s | +0.332 s | 6.06 MiB | 6.08 MiB | + 19.3 KiB |
| /wp-admin/upload.php | 0.585 s | 0.412 s | -0.173 s | 3.52 MiB | 3.52 MiB | - 2.54 KiB |
| /wp-admin/options-writing.php | 0.224 s | 0.219 s | -0.005 s | 3.5 MiB | 3.5 MiB | + 1.45 KiB |
| /wp-admin/media-new.php | 0.275 s | 0.257 s | -0.018 s | 3.49 MiB | 3.5 MiB | + 9.65 KiB |
| /wp-admin/edit-tags.php?taxonomy=category | 0.193 s | 0.224 s | +0.031 s | 3.5 MiB | 3.52 MiB | + 20.32 KiB |
| /wp-admin/post-new.php?post_type=page | 0.614 s | 0.824 s | +0.210 s | 6.05 MiB | 6.07 MiB | + 14.82 KiB |
| /wp-admin/options-discussion.php | 0.671 s | 0.418 s | -0.253 s | 3.5 MiB | 3.5 MiB | - 2.05 KiB |
| /wp-admin/edit-comments.php | 0.448 s | 0.254 s | -0.194 s | 3.52 MiB | 3.52 MiB | - 2.55 KiB |
| / | 0.539 s | 0.243 s | -0.296 s | 3.43 MiB | 3.44 MiB | + 976 bytes |
| Average | 0.441 s | 0.439 s | -0.002 s | 3.97 MiB | 3.98 MiB | + 8.1 KiB |
Code Statistics
Note: Third-party libraries and minified JS/CSS files are excluded from these statistics where possible, so the numbers you see here may be lower than those reported by other tools.
| Language | % | Lines of code | Comment lines | Files | |
|---|---|---|---|---|---|
| PHP | 80.1% | 1,458 | 109 | 21 | |
| CSS | 14.5% | 263 | 1 | 2 | |
| SVG | 5.1% | 92 | 0 | 49 | |
| JavaScript | 0.4% | 7 | 0 | 1 | |
| Total | 1,820 | 110 | 73 | ||
PHP Code Analysis | More results »
| Lines of code | 1,286 |
|---|---|
| Total complexity | 458 |
| Median class complexity | 21.0 |
| Median method complexity | 2.0 |
| Most complex class | ATEC_group |
| Most complex function | ATEC_group::__construct() |
| Classes | 5 |
|---|---|
| Methods | 32 |
| Functions | 87 |
Additions
Things that the plugin adds to the site. This section is not intended to be comprehensive. The test tool only looks for a few specific types of added content.
No new entries found.
PHP Error Log 11 lines
[17-May-2025 19:00:41 UTC] PHP Fatal error:  Uncaught Error: Class "ATEC\FS" not found in /wp-content/plugins/atec-profiler/includes/framework/INFO.php:32
Stack trace:
#0 /wp-content/plugins/atec-profiler/includes/atec-wppr-dashboard.php(51): ATEC\INFO->__construct()
#1 /wp-content/plugins/atec-profiler/includes/atec-wppr-dashboard.php(135): ATEC_wppr_results->__construct()
#2 /wp-content/plugins/atec-profiler/includes/atec-wppr-install.php(18): require('...')
#3 /wp-includes/class-wp-hook.php(324): atec_wppr()
#4 /wp-includes/class-wp-hook.php(348): WP_Hook->apply_filters()
#5 /wp-includes/plugin.php(517): WP_Hook->do_action()
#6 /wp-admin/admin.php(260): do_action()
#7 {main}
  thrown in /wp-content/plugins/atec-profiler/includes/framework/INFO.php on line 32